
Abstract
We investigated whether specific sequence types, and their shared virulence gene profiles, may be associated with both human and food animal reservoirs. A total of 600 Escherichia coli isolates were assembled from human (n=265) and food-animal (n=335) sources from overlapping geographic areas and time periods (2005–2010) in Canada. The entire collection was subjected to multilocus sequence typing and a subset of 286 E. coli isolates was subjected to an E. coli–specific virulence gene microarray. The most common sequence type (ST) was E. coli ST10, which was present in all human and food-animal sources, followed by ST69, ST73, ST95, ST117, and ST131. A core group of virulence genes was associated with all 10 common STs including artJ, ycfZ, csgA, csgE, fimA, fimH, gad, hlyE, ibeB, mviM, mviN, and ompA. STs 73, 92, and 95 exhibited the largest number of virulence genes, and all were exclusively identified from human infections. ST117 was found in both human and food-animal sources and shared virulence genes common in extraintestinal pathogenic E. coli lineages. Select groups of E. coli may be found in both human and food-animal reservoirs.
Introduction
E
With the aim of comparing E. coli from human extraintestinal infections and from potential animal sources, a representative and systematically collected sample of E. coli isolates was assembled. This collection included E. coli recovered from human urinary tract infection (UTI) cases, isolates recovered from the stool of a convenience sample of healthy individuals, retail meat (beef, pork, and chicken), and directly from food animals at slaughter (pig, beef cattle, and chicken). E. coli isolates were from overlapping geographic areas in Canada and time periods. The entire collection was subjected to multilocus sequence typing (MLST) and a subset was subjected to an E. coli–specific virulence gene microarray (Hamelin et al., 2007; Jakobsen et al., 2011) to investigate whether specific sequence types (STs), and their shared virulence gene profiles, may be associated with human or food-animal reservoirs or shared between both.
Materials and Methods
Bacterial strains and DNA extraction
A total of 600 E. coli isolates were systematically assembled from human and food-animal sources (Table 1). E. coli causing community-acquired UTIs were collected from two community health clinics from all consecutive UTI cases over a defined 2-year period (2005–2007) in Montréal, Québec (Manges et al., 2008); these E. coli represent isolates from community-acquired infections. Isolates collected as part of the Canadian Hospital Ward Antibiotic Resistance Surveillance (CANWARD) study (2007–2008) represent E. coli from hospital-associated extraintestinal infections across Canada (Karlowsky et al., 2013). Commensal E. coli cultured from stool samples from a convenience sample of 23 healthy university students in Montréal, Québec were included (2009–2010), as representatives of normal commensal E. coli. The Public Health Agency of Canada, Canadian Integrated Program for Antimicrobial Resistance Surveillance (CIPARS) provided 168 E. coli isolates from food animals (cecal) at slaughter and 167 isolates from retail meat (Government of Canada, 2009) (Table 1). Abattoirs in Canada, especially for beef cattle and pigs, are centralized; isolates were selected on the basis of the annual slaughter volume rather than on geographic location, and therefore were sampled across Canada. Cecal E. coli isolates from chicken were primarily recovered from abattoirs in Québec and Ontario, with a few additional isolates coming from abattoirs across Canada. Randomly sampled E. coli from the CIPARS retail meat isolate archive (2005–2007) were selected, with equal representation from chicken, pork, and beef meats, from Québec and Ontario. This sampling strategy was used to maximize the number of E. coli coming from the same area as the human source E. coli isolates. From within this 600 isolate collection, a subsample of 286 E. coli isolates was systematically selected for evaluation by E. coli microarray. These 286 isolates were selected to represent a range of diverse STs. Isolates were selected at random when multiple isolates of the same ST were available from within one source. The sample was assembled to include one third of isolates from food-animal sources, one third from hospitalized infections, and one third from community-acquired infections (although this group is slightly over-represented). We also included all intestinal E. coli isolates as we had relatively few isolates from healthy subjects. From the food-animal sources, we elected to include the cecal isolates only in this subsample, as the retail meat isolates could be associated with both animal and human-source E. coli (via slaughter and meat processing and handling).
Twelve isolates from California, United States (1999–2001) were included in this group, as they are representatives of important extraintestinal pathogenic Escherichia coli lineages.
CANWARD, Canadian Hospital Ward Antibiotic Resistance Surveillance study; CIPARS, Canadian Integrated Program for Antimicrobial Resistance Surveillance; PHAC, Public Health Agency of Canada; UTI, urinary tract infection.
MLST
MLST testing was carried out using the
E. coli–specific virulence gene microarray hybridization
E. coli DNA was extracted by bacterial cell lysis, labeled, and hybridized on an E. coli–specific microarray containing 315 virulence genes and gene variants as described previously (Bruant et al., 2006; Jakobsen et al., 2011). Following hybridization, arrays were scanned with a ScanArray LITE (Perkin Elmer, Foster City, CA), and acquisition and quantification of background subtracted fluorescent spot intensities were performed using ScanArray Express software, version 2.1 (Perkin-Elmer). The median value of each set of duplicate spotted oligonucleotides was then compared to the median value of the negative control spots present on the array. Oligonucleotides with a signal-to-noise fluorescence ratio of 3.0 (based on a comparison of the negative control spots) were considered positive. Any gene that was present in fewer than two isolates was removed from further analyses.
Statistical analyses
We present proportions of MLST sequence types in Table 2 arranged by source. The proportions of each virulence gene in human versus animal isolates are presented in Appendix Table A1. Odds ratios (and 95% CI) are presented indicating which virulence genes are over- or under-represented. Additional multivariable analyses were not performed due to limited sample sizes. We performed a nonmetric multidimensional scaling analysis to examine how similar the E. coli are by source (Fig. 1a) and by source for those E. coli representing the most common STs. All analyses were conducted in R (version 2.15.1) using the isoMDS command. Ninety-five percent confidence ellipses were estimated using the ellipse package in R.
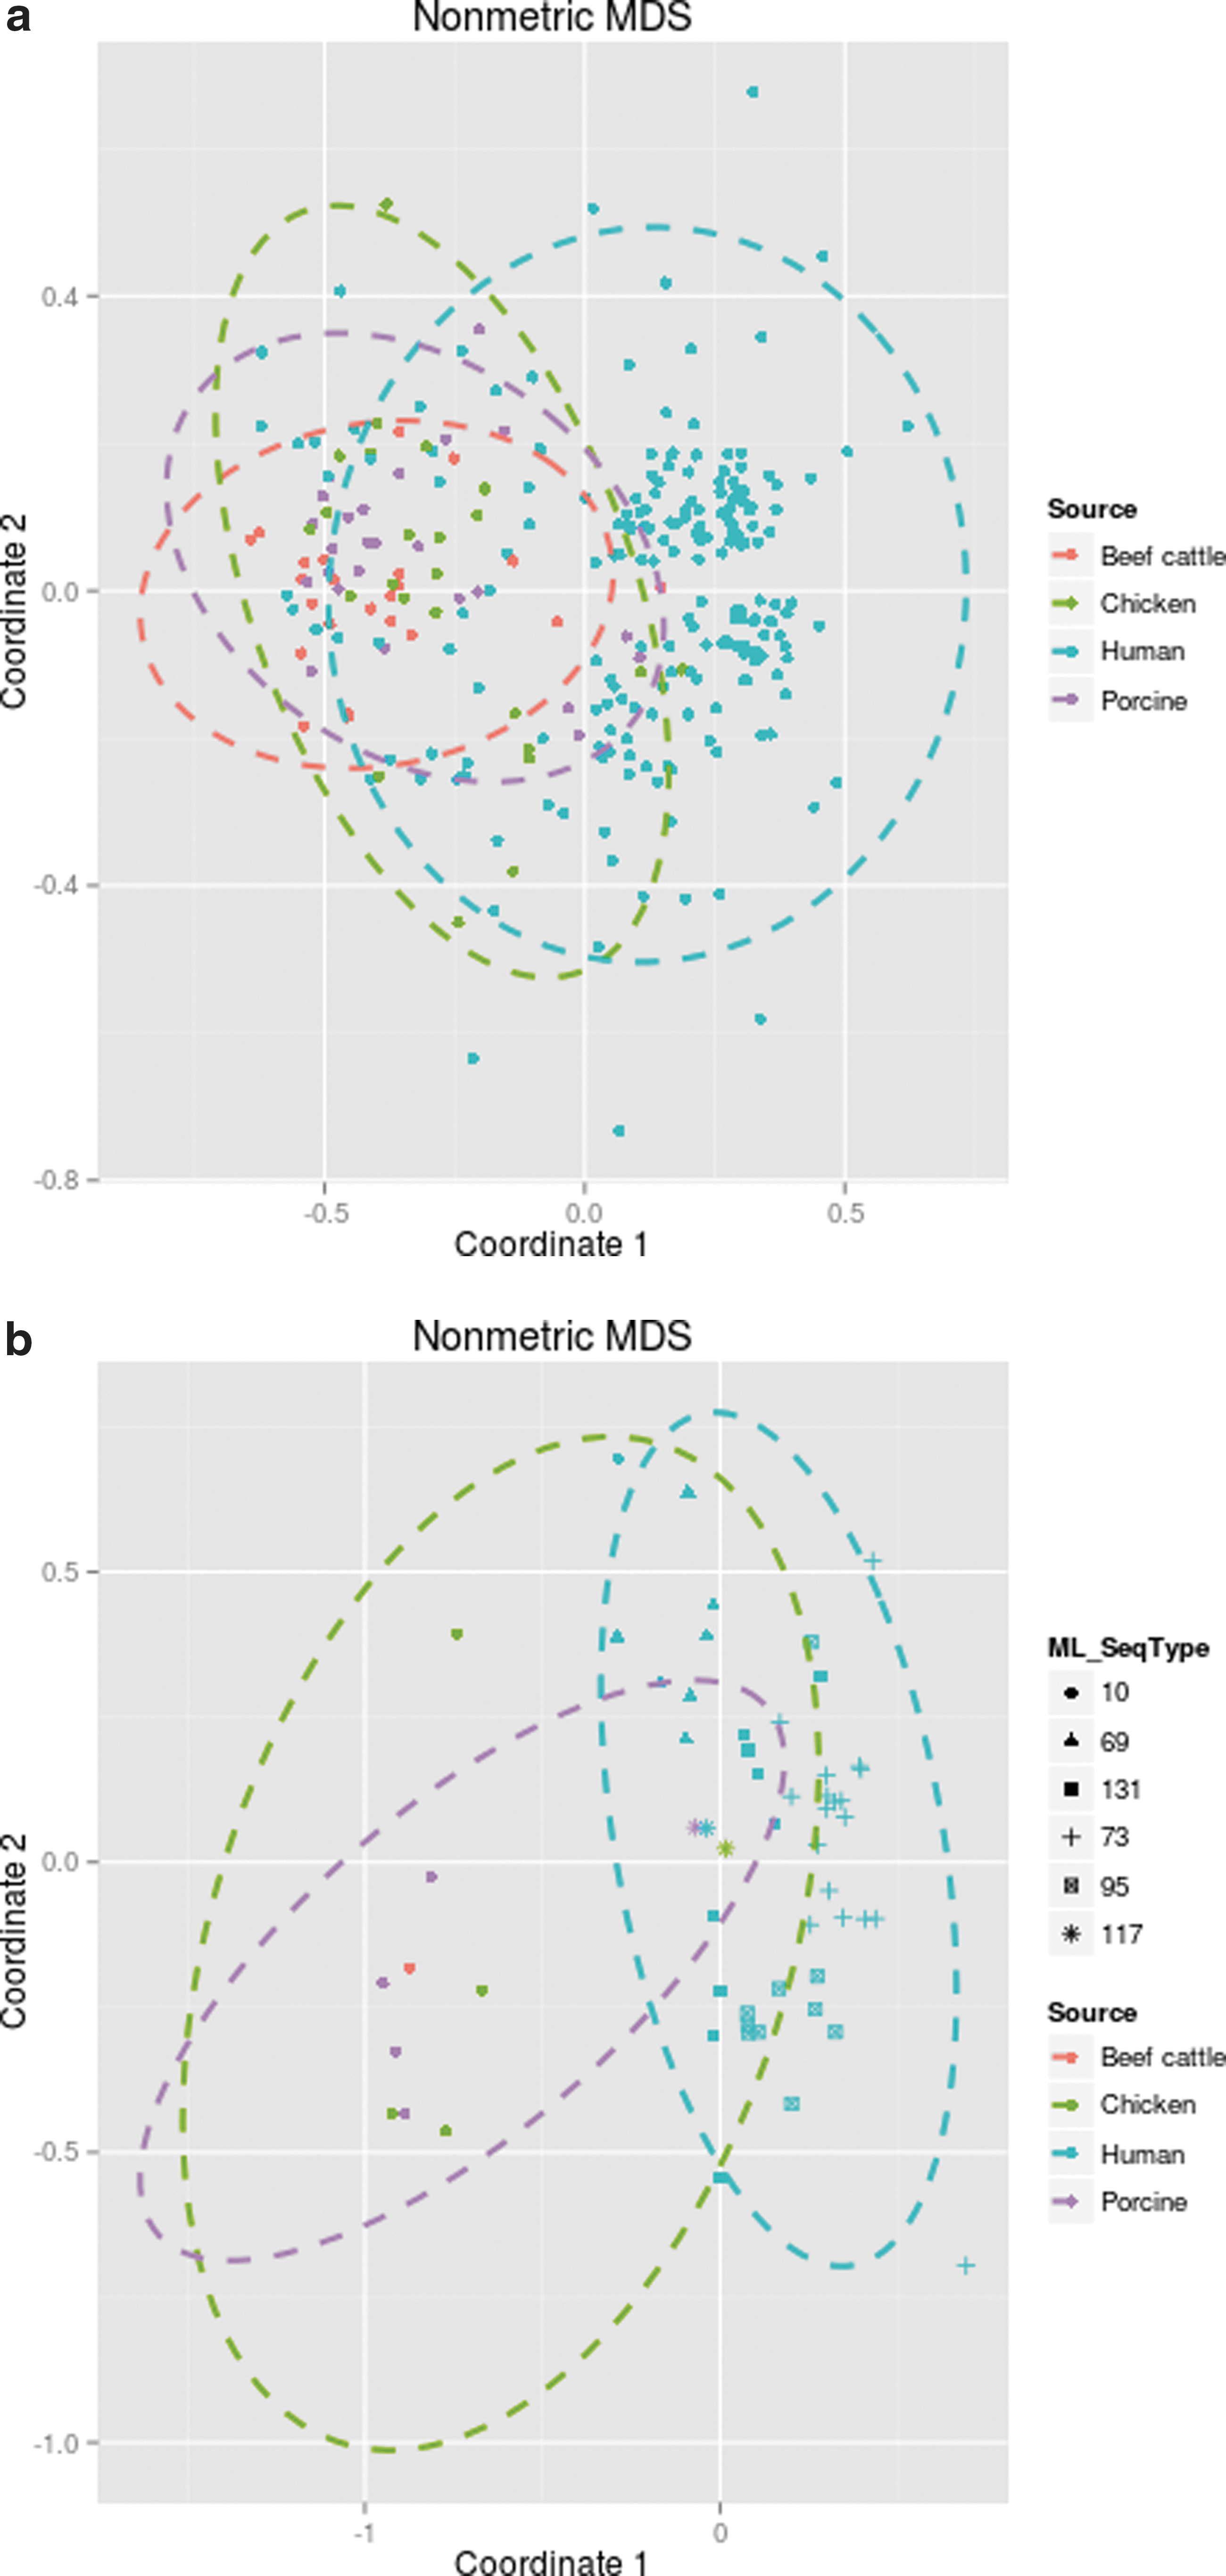
Visualization of nonmetric MDS analysis using virulence gene data to cluster Escherichia coli isolates by source (human, chicken, pork/porcine, or beef/bovine).
UTI, urinary tract infection.
Results
A total of 600 E. coli isolates from food animals, collected from cecal swabs and from retail meat, representing beef/beef cattle, pork/pigs and chicken, and from human infections and healthy human stool, were assembled (Table 1). A detailed breakdown of MLST results for all E. coli is presented in Table 2. The most common ST was E. coli ST10, which was present in all human and food-animal sources. The next most common STs included ST69, ST73, ST95, ST117, and ST131. The common STs—73, 95, and 92—were exclusively associated with human source E. coli; ST69 and ST131 were largely associated with humans, though a few isolates were identified in chicken (ST131) or pork meat (ST69). STs 10, 117, 101, 38, 394, and 746 were identified in humans, retail meat, and food animals, while STs 641, 1490, 278, 401, and 48 were only identified in retail meat or food-animal sources. Over one third of E. coli isolates from each source contained a variety of unknown or nonannotated STs.
A subsample of 286 E. coli representing diverse STs was subjected to an E. coli–specific virulence gene microarray. The distribution of STs among these 286 isolates from food animals and humans characterized by microarray (Table 1) was similar to the full sample of 600 isolates (data not shown). Specific sets of virulence genes were exclusively present or over-represented in animal-source isolates (exclusively in animal isolates: eae, escJ, escN, espA, espG, f17d-A, ler, nleA, cif, nleA(EHEC), and nleB(O103) and over-represented in animal isolates: lpfA, yjaA, astA, gafD, csgA, and flmA). These gene profiles suggest the presence of potential diarrheagenic E. coli pathotypes. The enteropathogenic E. coli–related genes present in some of these isolates have been reported previously (Racicot Bergeron et al., 2012). Specific sets of virulence genes were exclusively present or over-represented in human source isolates (exclusively in human isolates: senB, sat, cnf, sfaD, z4184, papA(10), papGIII, sfaHII, wzxO6, kfiB, papA(48), focG, and focA and over-represented in human isolates: tspE, vat, neuA, neuC, irp(2), iha, b1432, usp, irp(1), fyuA, gimB (orf1), ibeA, kpsM-II, papC, malX, chuA, sitD, and many others). The complete summary of the distribution of virulence gene distribution by isolate source is provided in Appendix Table A1.
Nonmetric multidimensional scaling (NMDS) analysis, using Jaccard distances, of virulence genes by source and ST was investigated. Figure 1a shows all isolates with complete virulence gene data and colored by source; 95% confidence ellipses are included. The fit-based R2 was 0.97. A large portion of the human isolates are distinct from the animal-source isolates. However, there is a region where the E. coli from all four sources overlap. Figure 1b shows the NMDS results for source and the most common STs in our data (fit-based R2 was 0.98). These results show that ST117 E. coli isolates from a chicken and porcine source cluster with a ST117 human isolate. Human source ST131 and ST69 and a few ST95 isolates, based on virulence gene profiles, also appear within the confidence ellipse defined by the chicken-source isolates. It is also important to note that virtually all of the ST73 isolates cluster together and lie primarily in the human-isolate-only space.
A core group of genes was associated with all 10 common STs including artJ, ycfZ, csgA, csgE, fimA, fimH, gad, hlyE, ibeB, mviM, mviN, and ompA. Unsurprisingly, the STs comprising primarily human infection–related E. coli had a higher number of virulence genes (range 36–50). Notably, STs 73, 92, and 95 exhibited the largest number of virulence genes, and all were exclusively identified from human infections. ST117 shared the virulence genes fliC, chuA, fepC, iss, irp, fyuA, sit, ompT, iucD, iut, usp, deoK, and malX, which are common to ExPEC lineages (Johnson and Russo, 2005). However, the kpsMII gene was absent. STs 38, 10, and 641 exhibited fewer classic ExPEC virulence genes (Johnson and Russo, 2005) and all were identified in both human and animal samples.
E. coli ST131 is currently the most important ST among human ExPEC (Denisuik et al., 2013; Nicolas-Chanoine et al., 2014). In this study, ST131 was identified in nine community-acquired UTI samples, four hospital-acquired infections, and from two retail chicken meat samples. Of the 9 ST131 isolates examined by microarray, all exhibited the 10 core genes mentioned above and the majority also exhibited fliC, chuA, fepC, iss, irp, fyuA, kpsMII, sitA, sitD, ompT, and ccdB.
Discussion
There is increasing concern that E. coli causing extraintestinal infections in humans may be transmitted via the foodborne route. E. coli isolates for this study were systematically selected from human infection (community- and hospital-associated infections) and food-animal sources from a specific time period and geographic areas in Canada. ST10, ST69, ST73, ST95, ST117, and ST131 were the most common E. coli STs in this study. Representative information on the distribution of these common STs by human and animal source is difficult to find. To get an idea of the range of sources for these STs, we queried the MLST database (
The distribution of virulence genes by source suggests that there are few genes confined exclusively to food-animal isolates; moreover, the virulence genes found exclusively in food-animal isolates occur in a relatively small proportion of all food-animal isolates (range 2.6–7.8%). Similarly, the genes confined to human source isolates are also relatively infrequent in all human source isolates (with some exceptions such as senB, sat, cnf, and sfaD, range 1–34%). These results suggest that although distinct and host-adapted or host-specific E. coli populations exist among E. coli causing human infections and those inhabiting the food-animal gut, there are many genes common in isolates from both sources (Johnson et al., 2003; Jakobsen et al., 2010, 2011). Moreover, the classic ExPEC genes, which were more frequently found among the human infection isolates, were also found in some animal isolates, though the proportion varied (e.g., iss found in 55% of animal isolates and ibe found in 1.3% of animal isolates) (Appendix Table A1). Nonmetric MDS analysis based on virulence genes also shows that specific and select groups of E. coli in food-animal reservoirs may serve as a source for human ExPEC infections.
Conclusions
MLST results suggest that specific MLST lineages are strongly associated with human sources only (ST73 and ST95), while some STs (e.g., ST117 and chicken, ST278 and beef cattle/beef, and ST1490 and pigs/pork) may be associated with specific food-animal species. A smaller number of STs were found in all reservoirs (ST10 and ST117) (Manges and Johnson, 2013). ST117 also shared multiple virulence genes common to ExPEC lineages, which has been observed previously (Vincent et al., 2010; Racicot Bergeron et al., 2012; Manges and Johnson, 2013). MLST and virulence gene profiling demonstrate that certain groups of E. coli may be strongly associated with human infections, whereas other E. coli are more strongly associated with food-animal reservoirs. A smaller, select group of E. coli lineages are found in both human and food-animal sources, indicating possible transmission from food-animal reservoirs to humans.
Footnotes
Acknowledgments
We wish to thank members of the surveillance team of the Canadian Integrated Program for Antimicrobial Resistance Surveillance (Brent Avery) and the CANWARD study team. Funding for this study was contributed by the Health Canada Genomic Research and Development Initiative to P.B. and A.M.K., Public Health Agency of Canada and the Canadian Institutes of Health Research (CIHR), Institute of Infection and Immunity (MOP-114879) to A.R.M.
Disclosure Statement
No competing financial interests exist.
Complete List of Virulence Genes by Isolate Source
| Distribution in source | Gene | % Animal isolates | % Human isolates | % Total | Odds ratio | 95% CI | |
|---|---|---|---|---|---|---|---|
| Genes over-represented among human isolates | tspE | 0.039 | 0.627 | 0.469 | 41.43 | 12.63 | 135.88 |
| vat | 0.026 | 0.507 | 0.378 | 38.59 | 9.23 | 161.30 | |
| neuA | 0.013 | 0.239 | 0.178 | 23.90 | 3.24 | 176.28 | |
| neuC | 0.013 | 0.239 | 0.178 | 23.90 | 3.24 | 176.28 | |
| irp(2) | 0.182 | 0.833 | 0.657 | 22.37 | 11.29 | 44.31 | |
| iha | 0.013 | 0.225 | 0.168 | 21.76 | 2.95 | 160.71 | |
| b1432 | 0.013 | 0.220 | 0.164 | 21.45 | 2.90 | 158.44 | |
| usp | 0.052 | 0.517 | 0.392 | 19.51 | 6.88 | 55.34 | |
| irp(1) | 0.182 | 0.809 | 0.640 | 19.01 | 9.69 | 37.30 | |
| fyuA | 0.184 | 0.799 | 0.635 | 17.61 | 9.00 | 34.46 | |
| gimB (orf1) | 0.013 | 0.163 | 0.122 | 14.77 | 1.98 | 109.84 | |
| ibeA | 0.013 | 0.163 | 0.122 | 14.77 | 1.98 | 109.84 | |
| kpsM-II | 0.130 | 0.684 | 0.535 | 14.52 | 7.03 | 29.99 | |
| papC | 0.052 | 0.397 | 0.304 | 12.02 | 4.23 | 34.15 | |
| malX | 0.130 | 0.641 | 0.503 | 11.97 | 5.81 | 24.64 | |
| chuA | 0.247 | 0.789 | 0.643 | 11.45 | 6.19 | 21.19 | |
| sitD | 0.286 | 0.804 | 0.664 | 10.24 | 5.62 | 18.68 | |
| sitA | 0.286 | 0.780 | 0.647 | 8.86 | 4.90 | 16.03 | |
| fepC | 0.260 | 0.756 | 0.622 | 8.83 | 4.85 | 16.08 | |
| papGII | 0.039 | 0.244 | 0.189 | 7.96 | 2.41 | 26.35 | |
| pic | 0.026 | 0.172 | 0.133 | 7.80 | 1.83 | 33.25 | |
| hlyA | 0.091 | 0.373 | 0.297 | 5.95 | 2.61 | 13.60 | |
| ompT | 0.403 | 0.794 | 0.689 | 5.73 | 3.25 | 10.08 | |
| agn | 0.247 | 0.579 | 0.490 | 4.20 | 2.34 | 7.54 | |
| iss | 0.338 | 0.679 | 0.587 | 4.16 | 2.39 | 7.24 | |
| mcbA | 0.013 | 0.048 | 0.038 | 3.82 | 0.48 | 30.34 | |
| iut(A2) | 0.169 | 0.421 | 0.353 | 3.58 | 1.86 | 6.90 | |
| deoK | 0.221 | 0.483 | 0.413 | 3.30 | 1.81 | 6.03 | |
| iron(2) | 0.169 | 0.397 | 0.336 | 3.24 | 1.68 | 6.26 | |
| iut(UPEC) | 0.182 | 0.416 | 0.353 | 3.21 | 1.69 | 6.09 | |
| iron | 0.169 | 0.383 | 0.325 | 3.05 | 1.58 | 5.90 | |
| iucD | 0.169 | 0.378 | 0.322 | 2.99 | 1.55 | 5.78 | |
| traT | 0.169 | 0.349 | 0.301 | 2.64 | 1.36 | 5.12 | |
| ompT(2) | 0.403 | 0.603 | 0.549 | 2.25 | 1.32 | 3.84 | |
| iutA | 0.156 | 0.282 | 0.248 | 2.13 | 1.07 | 4.23 | |
| iss(3) | 0.545 | 0.670 | 0.636 | 1.69 | 0.99 | 2.88 | |
| Genes present at similar levels in animal and human isolates | rfc | 0.013 | 0.033 | 0.028 | 2.63 | 0.32 | 21.76 |
| ce1A | 0.052 | 0.120 | 0.101 | 2.48 | 0.83 | 7.37 | |
| shf | 0.026 | 0.057 | 0.049 | 2.28 | 0.50 | 10.45 | |
| pilL | 0.039 | 0.072 | 0.063 | 1.91 | 0.54 | 6.78 | |
| f165(1)A | 0.052 | 0.091 | 0.080 | 1.83 | 0.60 | 5.55 | |
| papA(11) | 0.052 | 0.091 | 0.080 | 1.83 | 0.60 | 5.55 | |
| hraI | 0.234 | 0.330 | 0.304 | 1.62 | 0.89 | 2.95 | |
| fliC(H7) | 0.078 | 0.115 | 0.105 | 1.54 | 0.60 | 3.91 | |
| capU | 0.026 | 0.038 | 0.035 | 1.49 | 0.31 | 7.19 | |
| fliC | 0.900 | 0.900 | 0.900 | 1.03 | 0.42 | 2.56 | |
| ccdB | 0.429 | 0.416 | 0.420 | 0.95 | 0.56 | 1.61 | |
| cia | 0.130 | 0.100 | 0.108 | 0.75 | 0.34 | 1.67 | |
| bmaE | 0.013 | 0.010 | 0.010 | 0.73 | 0.07 | 8.22 | |
| cdtB(3) | 0.013 | 0.010 | 0.010 | 0.73 | 0.07 | 8.22 | |
| f17c-A | 0.013 | 0.010 | 0.010 | 0.73 | 0.07 | 8.22 | |
| b1121 | 0.909 | 0.876 | 0.885 | 0.70 | 0.29 | 1.69 | |
| eivG | 0.182 | 0.120 | 0.136 | 0.61 | 0.30 | 1.25 | |
| cvaC | 0.169 | 0.105 | 0.122 | 0.58 | 0.28 | 1.22 | |
| rtx | 0.117 | 0.062 | 0.077 | 0.50 | 0.21 | 1.22 | |
| fimA | 0.935 | 0.876 | 0.892 | 0.49 | 0.18 | 1.32 | |
| fimH | 0.961 | 0.919 | 0.930 | 0.46 | 0.13 | 1.61 | |
| cba | 0.091 | 0.043 | 0.056 | 0.45 | 0.16 | 1.25 | |
| virK | 0.052 | 0.024 | 0.031 | 0.45 | 0.12 | 1.71 | |
| tia | 0.053 | 0.024 | 0.032 | 0.44 | 0.12 | 1.69 | |
| cma | 0.091 | 0.038 | 0.052 | 0.40 | 0.14 | 1.14 | |
| cib | 0.104 | 0.043 | 0.059 | 0.39 | 0.14 | 1.05 | |
| eibA | 0.013 | 0.005 | 0.007 | 0.37 | 0.02 | 5.91 | |
| wzyO86 | 0.026 | 0.010 | 0.014 | 0.36 | 0.05 | 2.62 | |
| paa(ETEC) | 0.039 | 0.010 | 0.017 | 0.24 | 0.04 | 1.45 | |
| csgE | 0.987 | 0.933 | 0.948 | 0.18 | 0.02 | 1.42 | |
| cnf(2) | 0.026 | 0.005 | 0.010 | 0.18 | 0.02 | 2.02 | |
| eae(beta) | 0.039 | 0.005 | 0.014 | 0.12 | 0.01 | 1.16 | |
| paa | 0.039 | 0.005 | 0.014 | 0.12 | 0.01 | 1.16 | |
| Genes overrepresented among animal isolates | lpfA | 0.169 | 0.081 | 0.105 | 0.44 | 0.20 | 0.95 |
| yjaA | 0.779 | 0.526 | 0.594 | 0.31 | 0.17 | 0.58 | |
| astA(2) | 0.234 | 0.077 | 0.119 | 0.27 | 0.13 | 0.57 | |
| astA(1) | 0.230 | 0.060 | 0.100 | 0.20 | 0.09 | 0.44 | |
| lpfA(O113) | 0.558 | 0.187 | 0.287 | 0.18 | 0.10 | 0.32 | |
| gafD | 0.078 | 0.014 | 0.031 | 0.17 | 0.04 | 0.71 | |
| csgA | 0.987 | 0.909 | 0.930 | 0.13 | 0.02 | 1.00 | |
| flmA | 0.221 | 0.033 | 0.084 | 0.12 | 0.05 | 0.31 | |
| wzyO98 | 0.273 | 0.043 | 0.105 | 0.12 | 0.05 | 0.28 | |
| leoA | 0.052 | 0.005 | 0.017 | 0.09 | 0.01 | 0.80 | |
| lpfA(O157) | 0.052 | 0.005 | 0.017 | 0.09 | 0.01 | 0.80 | |
| tsh | 0.506 | 0.072 | 0.189 | 0.08 | 0.04 | 0.15 | |
| eprJ | 0.792 | 0.211 | 0.367 | 0.07 | 0.04 | 0.13 | |
| spaS | 0.753 | 0.096 | 0.273 | 0.03 | 0.02 | 0.07 | |
| tlrA | 0.187 | 0.005 | 0.053 | 0.02 | 0.00 | 0.16 | |
| toxB | 0.753 | 0.057 | 0.245 | 0.02 | 0.01 | 0.04 | |
| Genes present in animal isolates only | eae | 0.078 | 0.000 | 0.021 | NE | ||
| escJ | 0.078 | 0.000 | 0.021 | NE | |||
| escN | 0.078 | 0.000 | 0.021 | NE | |||
| espA | 0.078 | 0.000 | 0.021 | NE | |||
| espG | 0.078 | 0.000 | 0.021 | NE | |||
| f17d-A | 0.078 | 0.000 | 0.021 | NE | |||
| ler | 0.078 | 0.000 | 0.021 | NE | |||
| nleA | 0.078 | 0.000 | 0.021 | NE | |||
| cif | 0.052 | 0.000 | 0.014 | NE | |||
| nleA(EHEC) | 0.052 | 0.000 | 0.014 | NE | |||
| nleB(O103) | 0.052 | 0.000 | 0.014 | NE | |||
| espB-2 | 0.039 | 0.000 | 0.010 | NE | |||
| espB-3 | 0.039 | 0.000 | 0.010 | NE | |||
| etpD | 0.039 | 0.000 | 0.010 | NE | |||
| map(1) | 0.039 | 0.000 | 0.010 | NE | |||
| map(2) | 0.039 | 0.000 | 0.010 | NE | |||
| nleB(O157) | 0.039 | 0.000 | 0.010 | NE | |||
| nleE | 0.039 | 0.000 | 0.010 | NE | |||
| set | 0.039 | 0.000 | 0.010 | NE | |||
| tir-1 | 0.039 | 0.000 | 0.010 | NE | |||
| eae(gamma) | 0.026 | 0.000 | 0.007 | NE | |||
| nleA(EPEC) | 0.026 | 0.000 | 0.007 | NE | |||
| nleF | 0.026 | 0.000 | 0.007 | NE | |||
| tccP | 0.026 | 0.000 | 0.007 | NE | |||
| wzy(O146) | 0.026 | 0.000 | 0.007 | NE | |||
| wzy(O66) | 0.026 | 0.000 | 0.007 | NE | |||
| Genes present in human isolates only | senB | 0.000 | 0.335 | 0.245 | NE | ||
| sat | 0.000 | 0.292 | 0.213 | NE | |||
| cnf(1) | 0.000 | 0.282 | 0.206 | NE | |||
| sfaD | 0.000 | 0.273 | 0.199 | NE | |||
| z4184 | 0.000 | 0.196 | 0.143 | NE | |||
| papA(10) | 0.000 | 0.191 | 0.140 | NE | |||
| papGIII | 0.000 | 0.177 | 0.129 | NE | |||
| sfaHII | 0.000 | 0.158 | 0.115 | NE | |||
| wzxO6 | 0.000 | 0.134 | 0.098 | NE | |||
| kfiB | 0.000 | 0.100 | 0.073 | NE | |||
| papA(48) | 0.000 | 0.096 | 0.070 | NE | |||
| focG | 0.000 | 0.081 | 0.059 | NE | |||
| focA | 0.000 | 0.067 | 0.049 | NE | |||
| cdtB(1) | 0.000 | 0.048 | 0.035 | NE | |||
| papA(13) | 0.000 | 0.048 | 0.035 | NE | |||
| papA(16) | 0.000 | 0.048 | 0.035 | NE | |||
| papGIV | 0.000 | 0.043 | 0.031 | NE | |||
| kpsM-III | 0.000 | 0.038 | 0.028 | NE | |||
| sfaA | 0.000 | 0.038 | 0.028 | NE | |||
| papA(12) | 0.000 | 0.033 | 0.024 | NE | |||
| wb(O8) | 0.000 | 0.033 | 0.024 | NE | |||
| mcjA | 0.000 | 0.024 | 0.017 | NE | |||
| nfaE | 0.000 | 0.024 | 0.017 | NE | |||
| pixA | 0.000 | 0.024 | 0.017 | NE | |||
| afaE | 0.000 | 0.019 | 0.014 | NE | |||
| cdtB(4) | 0.000 | 0.019 | 0.014 | NE | |||
| facA | 0.000 | 0.019 | 0.014 | NE | |||
| papA(40) | 0.000 | 0.019 | 0.014 | NE | |||
| aap | 0.000 | 0.014 | 0.010 | NE | |||
| cka | 0.000 | 0.014 | 0.010 | NE | |||
| mccB | 0.000 | 0.014 | 0.010 | NE | |||
| papA(15) | 0.000 | 0.014 | 0.010 | NE | |||
| papA(8) | 0.000 | 0.014 | 0.010 | NE | |||
| papA(9) | 0.000 | 0.014 | 0.010 | NE | |||
| wzyO22 | 0.000 | 0.014 | 0.010 | NE | |||
| aatA | 0.000 | 0.010 | 0.007 | NE | |||
| wzyO15 | 0.000 | 0.010 | 0.007 | NE | |||
| Common in both human and animal isolates | ompA | 1.000 | 0.866 | 0.902 | NE | ||
| hlyE | 1.000 | 0.895 | 0.923 | NE | |||
| mviM | 1.000 | 0.904 | 0.930 | NE | |||
| ibeB | 1.000 | 0.957 | 0.969 | NE | |||
| artJ | 1.000 | 0.971 | 0.979 | NE | |||
| gad | 1.000 | 0.981 | 0.986 | NE | |||
| mviN | 1.000 | 0.986 | 0.990 | NE | |||
The genes included in this table were present in at least two isolates within the entire dataset.
NE, not estimatable.