
Abstract
Onion bulbs can become contaminated with various molds during the storage period, the most important causal agents being black aspergilli (Aspergillus section Nigri). Taxonomic studies have revealed that this group of Aspergillus contains many species that cannot be reliably identified using standard morphological methods. Therefore, it is necessary to define the fungus causing this problem in the onion exactly, especially since some species assigned to section Nigri are well known as ochratoxin and/or fumonisin producers. Sixty fungal isolates belonging to 10 fungal genera were isolated from 40 onion samples originated from the Taif region in Saudi Arabia. Black aspergilli were detected in 37 onion samples. Using primer pairs (awaspec and Cmd6) designed based on partial calmodulin gene sequence data, 37 isolates were identified as A. welwitschiae. The ochratoxin A and fumonisin B2 contents of the onion samples were examined. No ochratoxins were detected in the collected samples, while fumonisin B2 was detected in 37.5% of the onion samples. Eighteen of 37 isolates of Aspergillus welwitschiae were recognized as potential producers for fumonisin B2. Multiplex polymerase chain reactions designed to detect biosynthetic genes of fumonisins confirmed these results.
Introduction
B
The taxonomy of Aspergillus section Nigri has been studied by many taxonomists and several schemes have been proposed (Abarca et al., 2004; Samson et al., 2007; Varga et al., 2006). In their review of diagnostic tools for identifying black aspergilli, Samson et al. (2007) provided different schemes and suggested a polyphasic approach for identification using molecular analysis, morphology, and growth on specific media at different temperatures, extrolite production, and Ehrlich reaction. After various revisions and amendments, the number of accepted species within this section is 25, including the recently described species A. ibericus, A. brasiliensis, A. aculeatinus, A. sclerotiicarbonarius, A. uvarum, A. floridensis, and A. trinidadensis (Serra et al., 2006; Varga et al., 2007; Noonim et al., 2008; Perrone et al., 2008, 2011; Jurjević et al., 2012).
Ochratoxin A (OTA) is a nephrotoxic mycotoxin naturally found in a wide range of food commodities throughout the world. According to scientific cooperation on questions relating to food (SCOOP) report 2, the contents of OTA in wheat, rye, barley, maize, and oat were 0.27, 0.60, 0.30, 0.17, and 0.19 μg/kg, respectively (European Commission, 2002). Among other toxic effects, OTA is carcinogenic, teratogenic, genotoxic, and immunosuppressive (Creppy, 1999; Petzinger and Weidenbach, 2002). It has been classified as “possibly carcinogenic to humans” (group 2B) by the International Agency for Research in Cancer. Three Aspergillus sections are known to produce OTA: section Circumdati (A. ochraceus, A. westedijkiae), section Flavi (A. albertensis, A. alliaceus), and section Nigri (A. carbonarius and A. niger) (Téren et al., 1996; Varga et al., 1996; Heenan et al., 1998). Among the species of section Nigri, A. carbonarius shows high ochratoxigenic potential, with most of isolates having the ability to produce OTA in culture (Heenan et al., 1998). It has been proposed that A. carbonarius would be the main source of OTA production in grapes and derivatives (Pitt, 2000; Cabanes et al., 2002), particularly in the Mediterranean region (Serra et al., 2003). Patino et al. (2005) developed two polymerase chain reaction (PCR) assays to detect A. carbonarius and A. ochraceus, considered to be the main sources of OTA contaminating commodities, particularly grapes, coffee, and derivatives, in warm climates. Gashgari et al. (2011) used PCR specific primers to detect ochratoxigenic A. niger group in raisin samples.
Fumonisins have been associated with human esophageal cancer in China and in South Africa, and are involved in human neural tube defects (Marasas et al., 2001). Because of these findings, fumonisin levels in food and feed are regulated by the European Commission Regulation (EC No 1126/2007) (European Commission, 2002), and fumonisins are classified by the International Agency for Research on Cancer in Group 2B of the carcinogenic compounds. Fumonisin B (FB) analogs are the most common fumonisins, among which FB1 predominates, followed by FB2 and FB3, while FB4 is usually detected in insignificant amounts (Rheeder et al., 2002). However FB2 was reported as more cytotoxic than FB1 (Gutleb et al., 2002). Many researchers around the world reported the abilities of black aspergilli to produce fumonisins (Frisvad et al., 2007, 2011; Logrieco et al., 2009; Mogensen et al., 2010; Varga et al., 2010; Susca et al., 2010; Abrunhosa et al., 2011; Chiotta et al., 2011; Palumbo et al., 2013).
There are only limited data available about the presence of mycotoxigenic black aspergilli and their ochratoxin and fumonisin producing potentials in onion bulbs. The aim of this study is the exact identification of black Aspergillus species from onion using molecular markers, as well as to study their ability to produce mycotoxins on the genetic level.
Materials and Methods
Isolation of storage fungi
Mycobiota of onion bulbs were isolated as described by Abdel-Sater and Eraky (2001). Forty samples (250 g) each of stored onion (Allium cepa) were collected randomly from different markets and vendors in Taif city. Samples were transferred into the Laboratory and kept at 4°C for fungal analysis. Onion bulbs were cut into segments (1 cm3) and five g from segments were soaked in 500 mL sterilized distilled water. From serial dilution, 1-mL aliquots were inoculated onto three plates of dichloran–Rose Bengal–chloramphenicol agar.
Plates were then incubated at 25°C for 7 days, and fungal colonies growing on these plates were purified. Pure cultures were obtained by transferring hyphal tips to malt extract agar with penicillin G and chloramphenicol (MEApc, 75 mg/L MEA). Isolates were maintained on MEApc at 4°C. Taxonomic identification of the different genera and species was made according to macroscopic and microscopic criteria with appropriate keys (Pitt and Hocking, 1985; Klich and Pitt, 1988; Samson et al., 2000; Klich, 2002). The identification of black aspergilli was confirmed with calmodulin (caM) gene sequencing.
Detection of natural occurrence of OTA and FB2 in onion samples
Samples that showed high contamination with black aspergilli were examined for OTA and FB2 contamination. For OTA detection, 50 g of each sample were extracted with 250 mL methanol–water (55:45 vol/vol) plus 100 mL n-hexane in a blender. After centrifugation of the mixture, 50 mL of the aqueous methanol layer was removed by pipette and shaken with 2 50-mL portions of chloroform. The combined chloroform extracts were evaporated to dryness on a hot water bath under nitrogen, and the residue was dissolved in 0.5 mL chloroform and refrigerated (Scott et al., 1970). For the qualitative analysis of ochratoxin thin-layer chromatography (TLC) technique used. OTA was detected in the sample extracts after TLC on 0.3-mm layers of Adsorbosil 5 silica gel (Merck, Darmstadt, Germany), using toluene–ethyl acetate–90% formic acid (6:3:1 vol/vol/vol) for development. Each extract showed a green fluorescent spot under ultraviolet (UV) light with the same retention factor (Rf) value (0.55). The fluorescence turned blue on treatment with ammonia (Shotwell et al., 1969), confirming the presence of OTA in the samples. For detection, the FB2 method of Pepeljnjak et al. (2003) was used. Sample was homogenized with 100 mL acetonitrile/water mixture (9:1) in an electric homogenizer (3500 turn/min) for 10 min and then filtrated. A filtrate was extracted with n-hexane (2×25 mL) to remove lipids. The upper hexane phase of the filtrate was removed and the water-soluble phase, adjusted to pH 8–9 with 25 mL NaHCO3 was then shaken with 2×25 mL of chloroform. The water-soluble phase was partially evaporated at 80°C and then concentrated in vacuum by lyophilization. The lyophilizate (100 mg) was dissolved in water (100 mL). Water solution of the sample (50 μL) and 10 μL of FB2 standard (0.5 mg/mL) (Sigma Chemical Co., approximately 98%, TLC) were spotted on preparative GF254 silica plates (Merck Millipore) activated beforehand by a 1-h heating period at 110°C. Plates were developed with acetonitrile–toluene–water (93:5:2) and subsequently dried on warm air. Detection of FB was performed directly through fluorescence quenching in short UV light (366 nm) as bright blue zones with R f 0.75.
Determination of ochratoxin and fumonisin producing potentials of A. welwitschiae isolates (TLC)
For OTA detection, all isolates were cultured on Czapek agar with 20% sucrose supplemented with 0.7% yeast extract (Thom and Raper, 1945). The contents of each plate were extracted with 250 mL methanol–water (55:45 vol/vol) plus 100 n-hexane in a blender, and the procedure of Scott et al. (1970) was applied as previously mentioned. FB2-producing ability of the isolates was performed by culturing the tested isolates on YGS agar plated (yeast extract 20 g; sucrose 40 g; 17 agar agar; 1 L sterile water). Fumonisin was extracted by grinding the moldy agar (20 g) in a Waring blender for 10 min with 100 mL acetonitrile/water mixture (9:1), and then the method of Pepeljnjak et al. (2003) was used.
DNA isolation from black aspergilli
The isolation of DNA from mycelium was performed according to the method described by Ferracin et al. (2009). Briefly, mycelium from liquid cultures was recovered by filtration and pulverized to a fine powder under liquid nitrogen in a mortar. Approximately 400 mg of the ground mycelium was suspended in 800 mL of lysis buffer (200 mM Tris-HCl; 250 mM NaCl; 25 mM EDTA; 1% wt/vol sodium dodecyl sulfate) and maintained at 65°C for 20 min. The DNA was purified with phenol:chloroform (25:24) and chloroform:isoamyl alcohol (24:1) and precipitated in 3M NaCl solution in the presence of 95% ethanol, then washed with 70% ethanol, and resuspended in ultrapure water.
For the identification of A. niger and A. welwitschiae isolates, two species-specific primers have been designed based on the alignment of partial calmodulin sequences of the members of section Nigri. The first primer was awaspec (ATTTCGACAGCATTTCTCAGAATTA) and the second primer was nigspec (GACAGCATTTTCCAGAACGA). The designed primers were used in combination with the common primer cmd6 (CCGATAGAGGTCATAACGTGG) described by Hong et al. (2006). Amplification was conducted in a thermal cycler with an initial denaturation of 2 min at 94°C, followed by 30 cycles of 35 s at 94°C, 20 s at 56°C, 30 s at 72°C, and a final extension of 1 min at 72°C. Aliquots of PCR products were checked by electrophoresis on a 1.4% agarose gel revealed with ethidium bromide and visualized by UV transillumination.
PCR and sequencing
For the amplification of the calmodulin (caM) gene, the previously described degenerate primers CF1 F (GCCGACTCTTTGACYGARGAR) and CF4 R (TTTYTGCATCATRAGYTGGAC) were used (Peterson et al., 2005). DNA sequences were determined using a BigDye Terminator v3.1 cycle sequencing kit (ABI) and an ABI 3100 DNA sequencer. Both strands of each fragment were sequenced. DNA sequences were edited with the DNASTAR computer package (DNASTAR, Madison, WI), and an alignment of the sequences was performed using the CLUSTALW program (European Bioinformatics Institute (Ebi), Cambridgeshire, UK) (Thompson et al., 1994). Sequences were submitted to GenBank on the NCBI website (
Phylogenetic reconstruction based on the partial calmodulin sequences was carried out using the MEGA5 software package (Center for Evolutionary Medicine and Informatics, Tempe, AZ) (Tamura et al., 2007). Maximum likelihood analyses were conducted using the Tamura–Nei model (Tamura and Nei, 1993). To determine the support for each clade, a bootstrap analysis was performed with 1000 replications. A. carbonarius CBS 111.26 was used as outgroup in the analysis.
Survey of pks genes (ochratoxin biosynthetic genes)
Two primer pairs PK51C-Met and PKS15KS were used to detect the presence of the two different domains of the same gene (An15g07920) that indicated the ochratoxigenic potentials of strains. The reaction conditions were previously described by Ferracin et al. (2012).
Multiplex PCR analysis of B2 biosynthetic genes in fumonisin-producing A. welwitschiae strains
Two multiplex PCR reactions (A and B) were used for analysis of fumonisin biosynthetic genes according to Palumbo et al. (2013). Multiplex PCR A included fum6, fum8, fum13, and fum19 genes, while multiplex PCR reaction B included fum1, fum7, fum3, and fum14 genes. Multiplex PCR reactions contained 100 ng template DNA, 200 mM dNTPs, 0.2 mM each primer, 1.25 U Taq DNA polymerase (New England Biolabs) and 13 ThermoPol reaction buffer (New England Biolabs). Amplification conditions were: 95°C for 5 min; 35 cycles of 95°C for 30 s, 62°C for 30 s, 68°C for 40 s; and 68°C for 5 min. Amplification products were analyzed by electrophoresis on 1% agarose gels.
Genetic diversity of Aspergillus welwitschiae isolates using specific genes random primer–polymerase chain reaction (SGRP-PCR)
Specific pairs of primers have been designed to bind specific fungal genes (β-tubulin, calmodulin, actin, and others). Since these pairs of primers have recognized binding sites in the fungal genome, it would be doable for a single primer to bind some parts of the fungal genome. Hence, the present work was hypothesized on the concept that the use of a single primer of the specific gene primers instead of a pair of primers would be good enough as random primers. SGRP-PCR was used to study genetic diversity among collected isolates of A. welwitschiae. Primers ITS1, ITS4, Bt1, Bt2, CF1, and CF4 were used as arbitrary primers. PCR assays were performed in 25 μL of a reaction mixture that contained the following: 12.5 μL PCR Master Mix (Fermentas), 0.5 μL MgCl2, 0.04 μL Taq polymerase, 3 μL of each primer, 1 μL template DNA, and 8 μL deionized water. PCR conditions were as follows: 1 step for denaturation at 94°C for 2.30 min followed by 40 cycles of the following: 94°C for 45 s; 36°C for 40 s; 72°C for 2 min; followed by an additional cycle at 72°C for 10 min. The PCR products were resolved by electrophoresis on 1.4% agarose gel in 0.5 X Tris-borate-EDTA buffer, at 125 V for 2 h. Gels were stained with ethidium bromide and photographed under UV light using UVP BioImaging CDS 8000 System (UVP). Dendrograms based on the banding profiles were constructed by the unweighted-pair group method with arithmetic average based on Jaccard's Similarity Coefficient by using Phoretix 1D Advanced v5. 20 software (Non-Linear Dynamics).
Results and Discussion
Mycobiota of onion bulbs
Sixty fungal isolates belonging to 10 genera were collected from 40 samples of different onion cultivars marketed in the Taif region (Table 1). Red onion samples showed high contamination with fungi in comparison with yellow and white samples (Table 2). A. welwitschiae was the most prevalent species, represented by 66.7% of the isolates collected during this work. The identification of black aspergilli was confirmed by caM gene sequencing, and the sequence results were deposited in GenBank under accession numbers from LK031732 to LK031768. Pitt and Hocking (1985) reported the decay of onions by A. niger and Fusarium. Black Aspergillus colonies were present on 60–90% of the leaves sampled from onion crops grown under hot, tropical conditions (Shambat, Sudan), but only about 21% of the leaves in crops grown under temperate conditions (Wellesbourne, UK) as recorded by Hayden et al. (1994). During their study about mycobiota of onion bulbs and their relation to the occurrence of three stored product mites, Abdel-Sater and Eraky (2001) isolated black aspergilli from all examined onion samples. Varga et al. (2012) examined six onion samples for infection with black aspergilli. They successfully isolated black aspergilli from all examined samples.
CFU, colony-forming units; ND, not detected.
Molecular characterization for the collected isolates
Many researchers previously reported that Aspergillus niger was the most predominant species in onion samples (Walker and Lindegren, 1924; Dingley, 1969; Curtis et al., 1974; Varga et al., 1993, 1994; Schwartz and Mohan, 1995; Tyson and Fullerton, 2004; Ozer and Koycu, 2004). However, the Aspergillus niger “aggregate” consists of several species of Aspergillus section Nigri, including A. niger, A. tubingensis, A. luchuensis, and A. brasiliensis, which are difficult to distinguish morphologically (Abarca et al., 2004; Hong et al., 2013). The two FB2-producing species A. niger and A. welwitschiae (previously named A. awamori) (Perrone et al., 2011; Hong et al., 2013) also cannot be distinguished. So, the morphological identification of the collected isolates in this study was accomplished with molecular characterization. Two primer pairs were designed for molecular identification of A. niger and A. welwitschiae species. Using these primers, our results indicated that all collected isolates belong to Aspergillus welwitschiae species (Fig. 1). Analysis of the partial calmodulin sequences also confirmed the previous identification in all cases. The calmodulin data set consisted of 416 characters and the evolutionary history was inferred using the Maximum Likelihood method (Fig. 2). Varga et al. (2012) isolated 35 strains from black aspergilli from 6 onion samples. All collected isolates were also found to belong to the Aspergillus welwitschiae species.
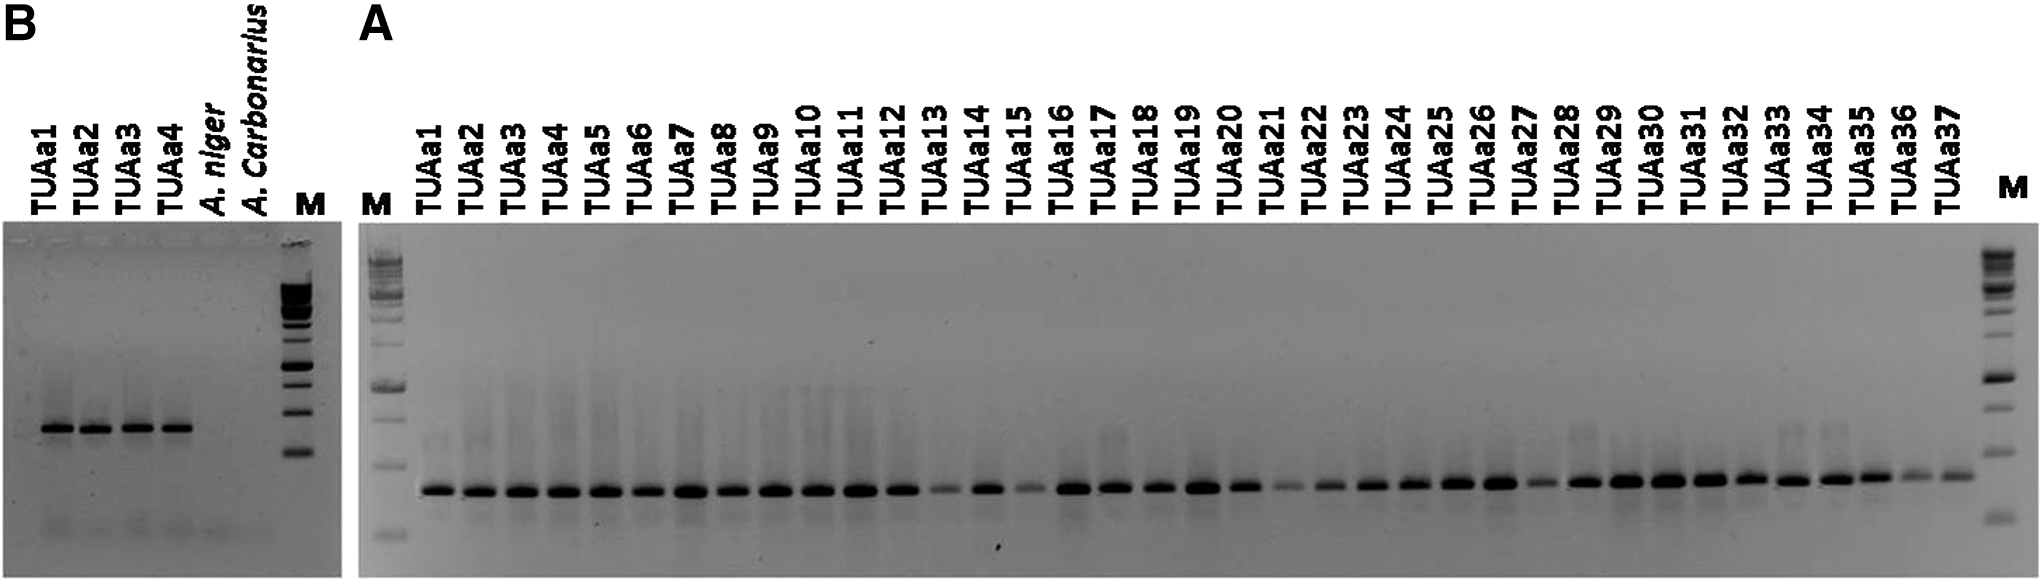
Polymerase chain reaction products obtained amplifying
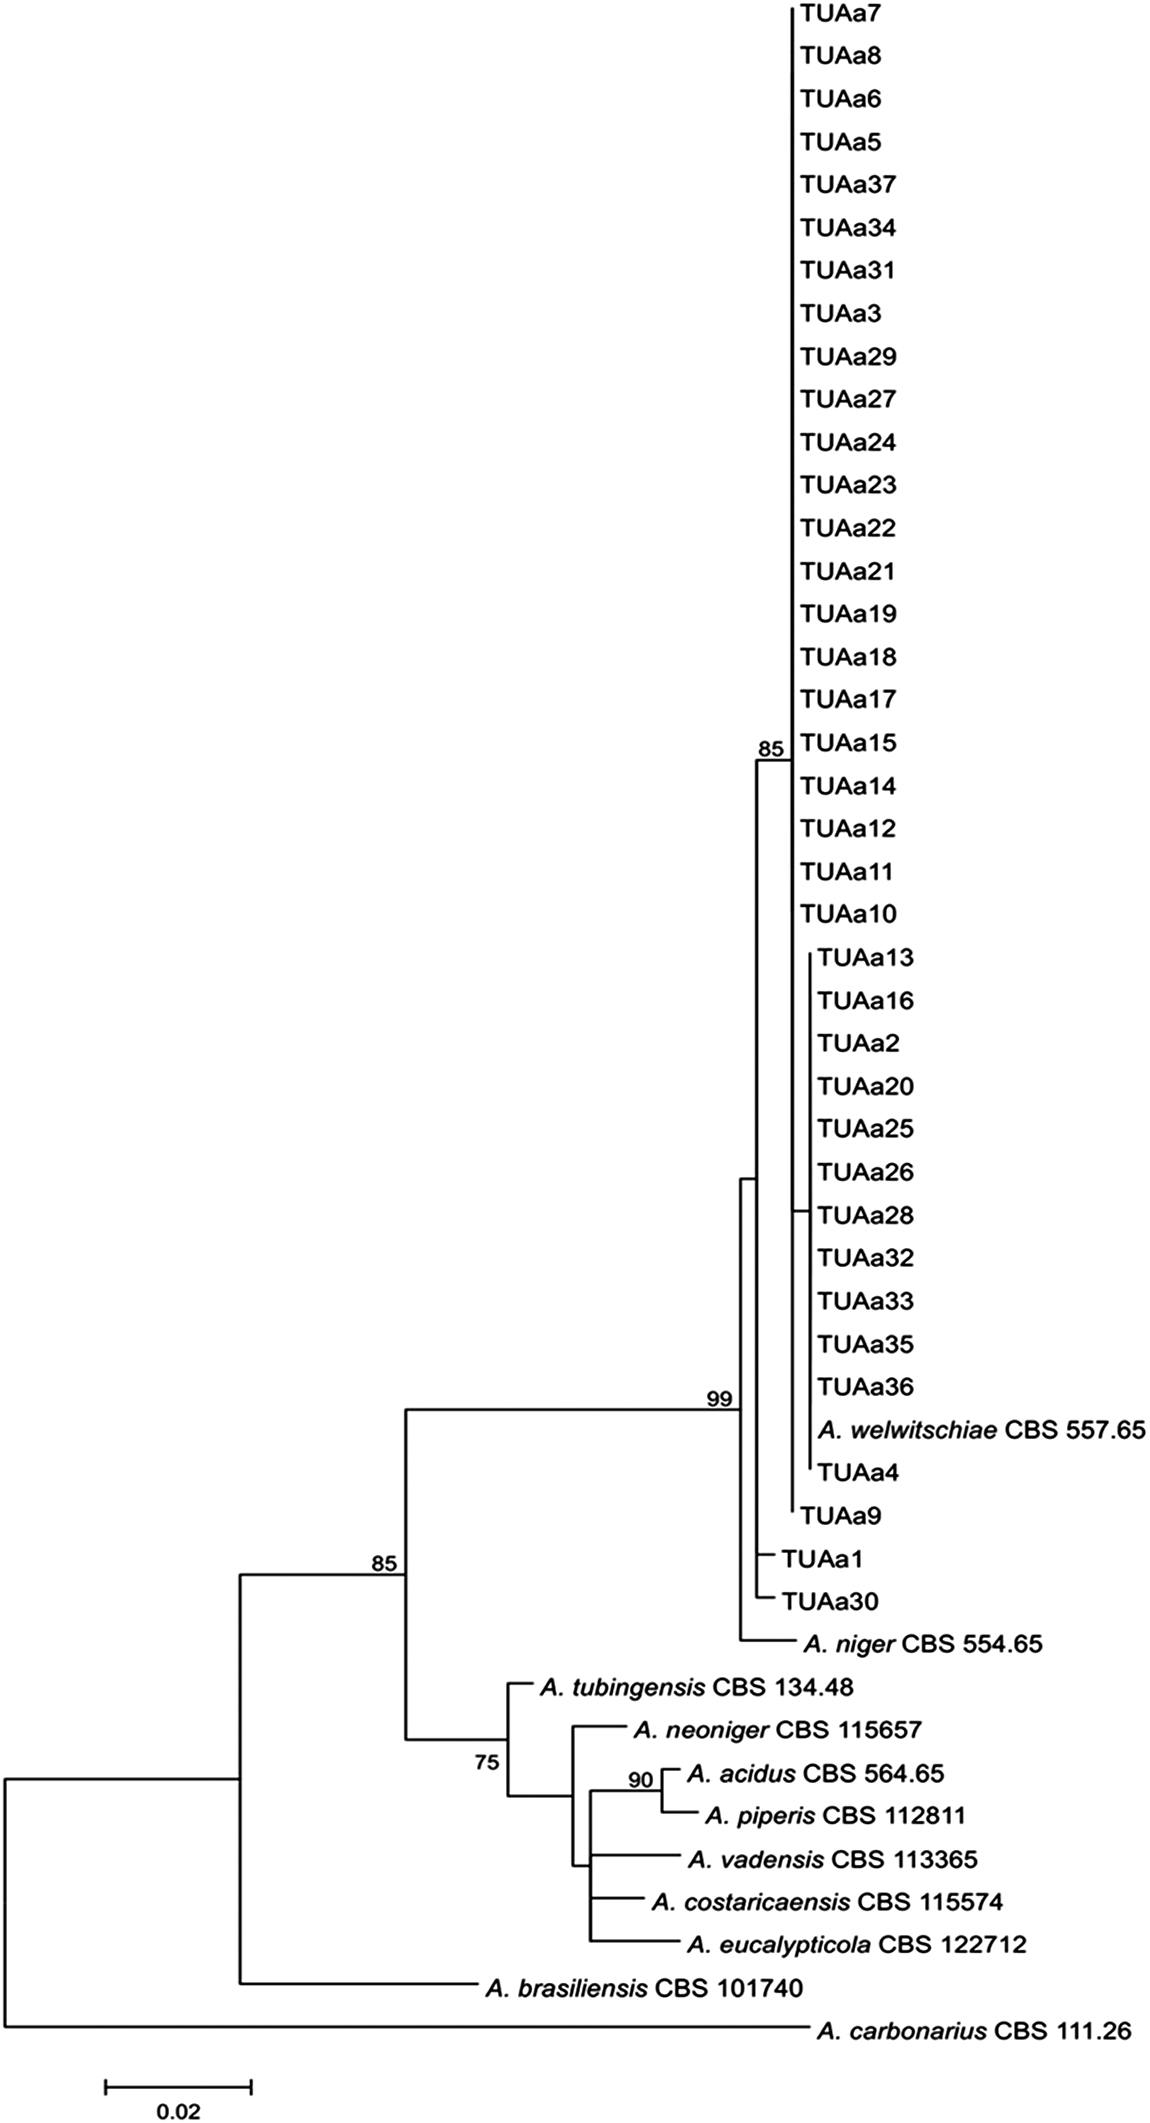
Phylogenetic tree of black Aspergillus isolates came from onions based on calmodulin sequence data. The numbers above branches indicate bootstrap values. Only values >70% are shown.
Detection of OTA and FB2 in onion samples and from black aspergilli
The mycotoxin analysis showed that OTA was present below the detection limit in any onion samples used in this study. However, FB2 was detected in 15 onion samples representing 37.5% of the studied samples (Table 2). Van de Perre et al. (2012) reported that OTA or FB2 were not detected in onion samples from Belgium, Brazil, Egypt, and India. Varga et al. (2012) recorded that two samples of the six examined onion samples were found to be contaminated with fumonisins at a relatively low rate (about 0.3 μg/kg).
All A. welwitschiae isolates were tested for their potentials for OTA and fumonisin production. None of the isolates showed ochratoxigenic potential, but 18 isolates of 37 produced FB2. Storari et al. (2012), during their studies in mycotoxin-producing black aspergilli in herbal teas available on the Swiss market, recorded that fumonisins were produced by 76% of A. niger and 37% of A. welwitschiae isolates. Also, 7% of A. niger and none of the A. welwitschiae isolates could produce OTA. A. welwitschiae has also been reported as an OTA- and fumonisin-producing species occurring in dried fruits from different countries (Varga et al., 2010; Perrone et al., 2011; Hong et al., 2013). Further reports revealed production of fumonisins by A. niger and A. welwitschiae strains from grape (Logrieco et al., 2009; Mogensen et al., 2010; Varga et al., 2010; Chiotta et al., 2011). Frisvad et al. (2011) studied fumonisin and ochratoxin production in 180 strains of A. niger. They reported that fumonisins were detected in 81% of A. niger, and OTA in 17%, while 10% of the strains produced both mycotoxins. Mogensen et al. (2010) recorded that 75% of A. niger strains from raisins produced fumonisins. The percentage of A. niger–producing ochratoxins from Thai coffee beans was 41% (Noonim et al., 2009). Our group studied the ochratoxin-producing abilities of nine isolates of A. niger isolated from raisins; two isolates were ochratoxin producers (Gashgari et al., 2011).
Survey of pks genes taking part in ochratoxin biosynthesis
The possible association between the presence of the pks locus and the capability of the respective strain of A. niger to produce OTA was studied by Ferracin et al. (2012). They amplified a single 988-bp band corresponding to the C-MeT PKS domain and discriminating between producing and nonproducing OTA strains. Equally, they used a primer pair (PKS15KS) to amplify a single 766-bp band only from OTA-producing strains. Using the same primer pair, the collected isolates from onion did not show any amplification. This result indicated that these pks genes are missing in all A. welwitschiae isolates collected from onion samples. These results are confirmed by the inability of these isolates to produce OTA (Table 2).
Multiplex PCR analysis of FB2 biosynthetic genes in fumonisin-producing A. welwitschiae strains
Multiplex primer sets developed by Palumbo et al. (2013) successfully amplified products from eight genes taking part in the fumonisin biosynthetic pathway. Multiplex primer set A amplified fum19, fum6, fum8, and fum13 fragments of 479, 374, 272, and 168 base pairs, respectively. Multiplex primer set B amplified fum1, fum14, fum7, and fum3 fragments of 452, 321, 238, and 173 base pairs, respectively. The results of Palumbo et al. (2013) indicated that all eight amplicons were produced from the FB2-producing A. niger strains NRRL328 and NRRL62529, and the FB2-producing A. welwitschiae strain NRRL62530, while one or more fragments were absent in nonproducer strains. Multiplex primer sets were used to detect the presence of the fumonisin biosynthetic genes in A. welwitschiae isolates collected in this study. The amplification results indicated the presence of 8 genes in 18 isolates of A. welwitschiae (Fig. 3). Those isolates proved to be fumonisin producers by TLC. The rest of the isolates showed amplicons for one to seven genes (Fig. 3). These isolates were recorded as FB nonproducing isolates during TLC analysis.
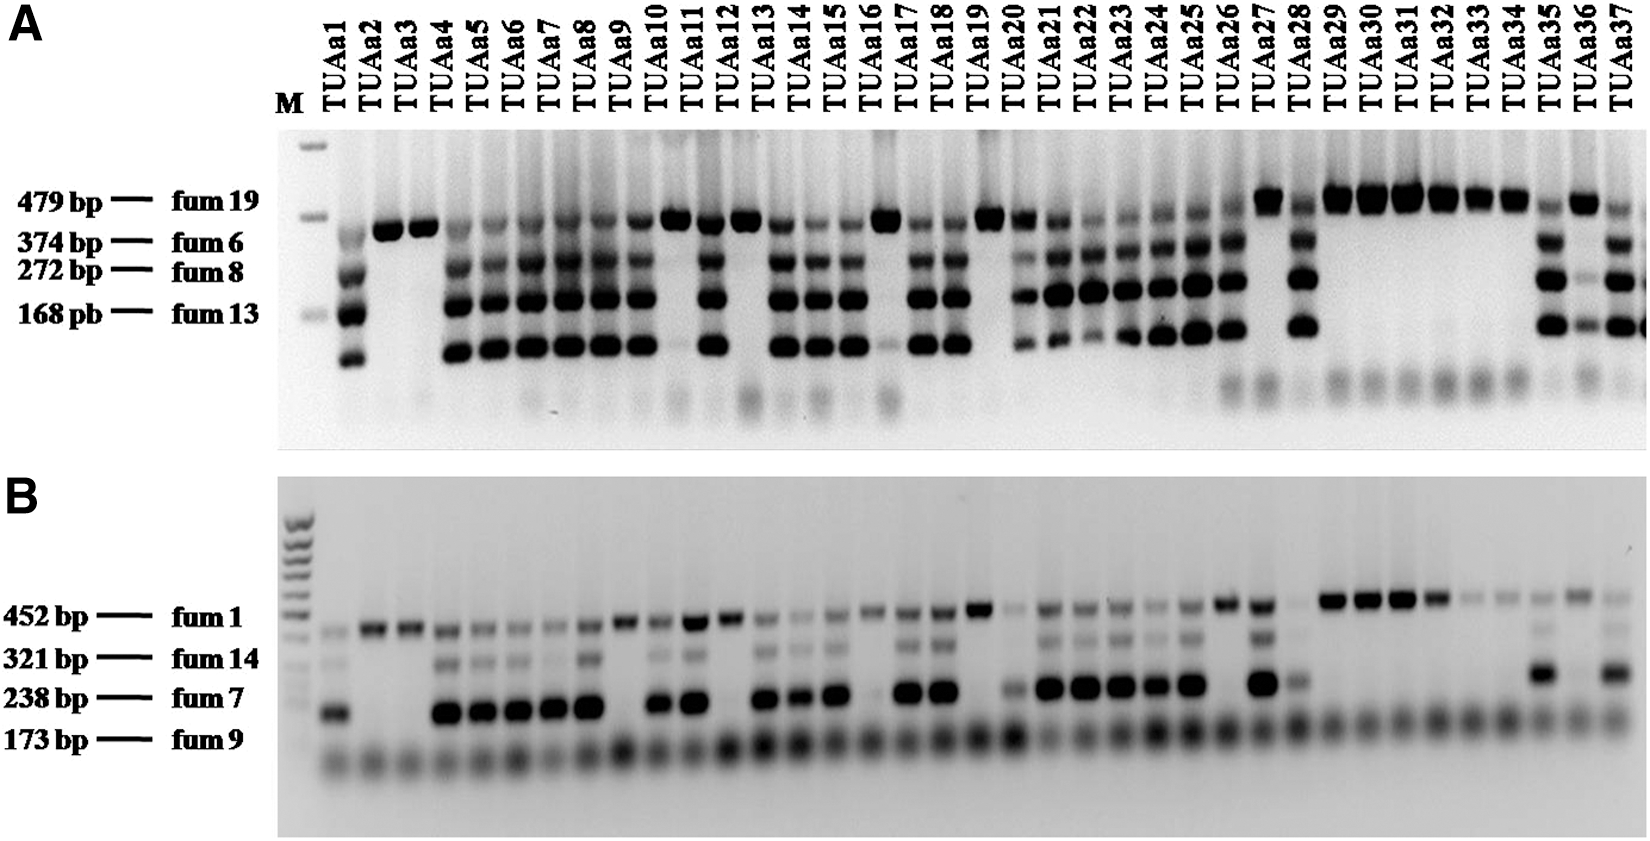
Multiplex polymerase chain reaction analysis of fumonisin B2 (FB2) biosynthetic genes. Multiplex primer sets
Genetic diversity of A. welwitschiae isolates
Thirty-seven isolates of A. welwitschiae were used to study the genetic diversity within this population isolated from onion samples. The SGRP-PCR technique was employed using six different primers (Figs. 4 and 5). The polymorphic fragment patterns were reproducible with slight variation in intensity and occasionally in the banding pattern. With the primers used, each isolate yielded 10–18 bands (Fig. 4). Therefore, for each primer, all amplification products were scored for each isolate according to molecular weight. The banding pattern obtained from agarose gel electrophoresis for each primer was scored and a binomial matrix was created (0 and 1 for absence and presence of PCR bands, respectively). The data were analyzed using the Nei and Li coefficient (Nei and Li, 1979). A dendrogram was constructed by the unweighted-pair group method of arithmetic average based on Jaccard's similarity coefficient. The dendrogram constructed from the combined results of six primers (Fig. 5) showed that the percentage of similarity between the isolates was between 30% and 100%. This result supports that this population has a high genetic diversity. Fumonisin-producing isolates (TUAa 4-8; TUAa11; TUAa13-15; TUAa17,18; TUAa 21-25; TUAa35; and TUAa37) were scattered in all clusters of the dendrogram. Thus, the constructed dendrogram showed no correlation between DNA banding patterns and the ability of fumonisin production. Similar results have been described in other studies with Aspergillus spp., showing no correlation between DNA banding profiles and mycotoxin production (Lourenco et al., 2007; Gashgari et al., 2010). Fungaro et al. (2004) compared random amplified polymorphic DNA (RAPD) patterns of toxigenic and nontoxigenic strains of A. carbonarius isolated from coffee beans. Although the PCR-based assay described by the authors was successfully employed to detect A. carbonarius in coffee samples, no association was found between the RAPD genotype and the ability to produce OTA of the strains. Since the RAPD-PCR technique amplified random fragments of the fungal genome, the fragment that contained a gene regulating toxin production may not be amplified using this technique with the used primers as recorded by Gashgari et al. (2010).
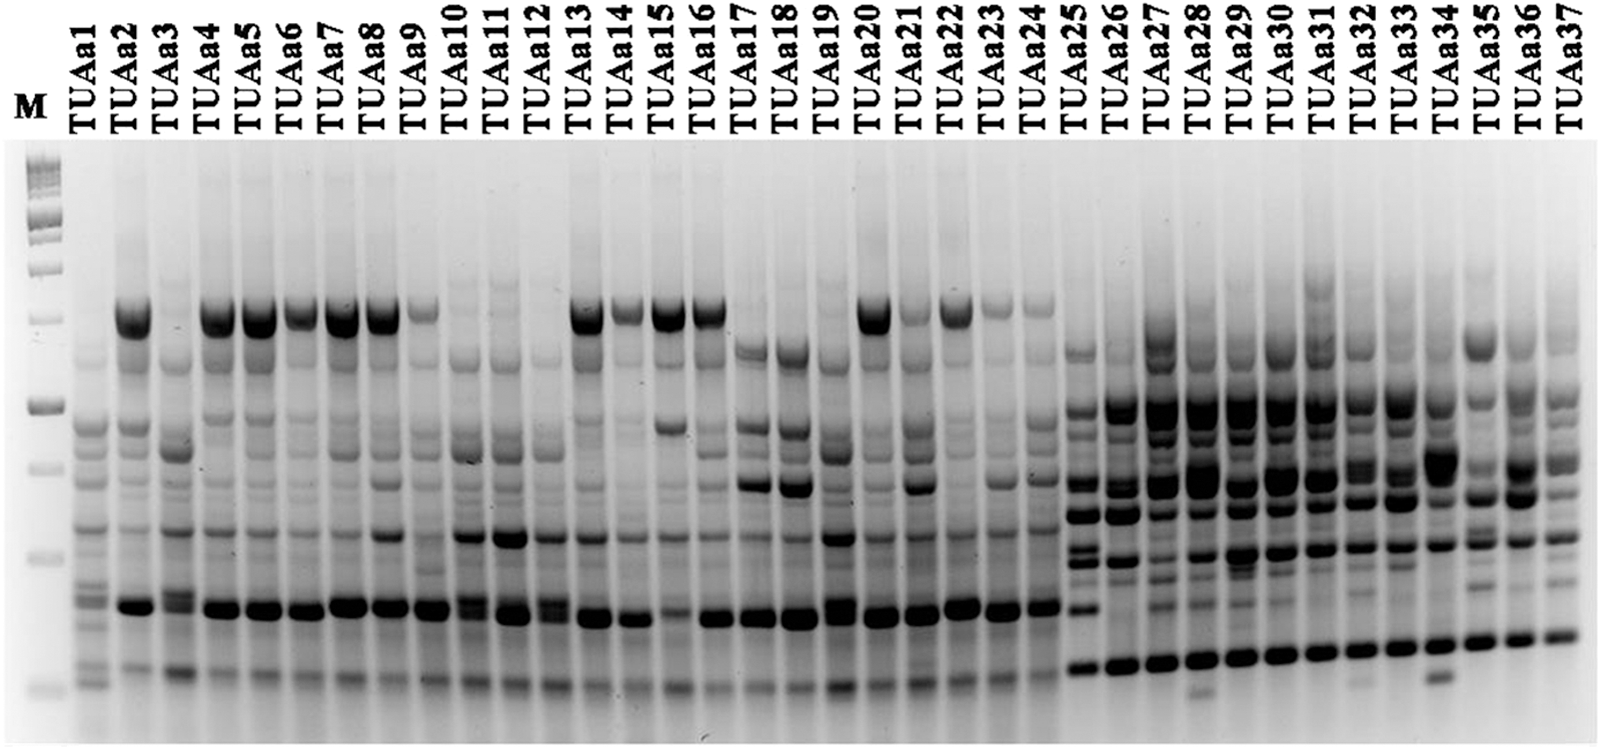
DNA banding patterns from random amplified polymorphic DNA analysis of Aspergillus welwitschiae isolates using ITS1 primer. Lane M is a 1-kb DNA ladder.
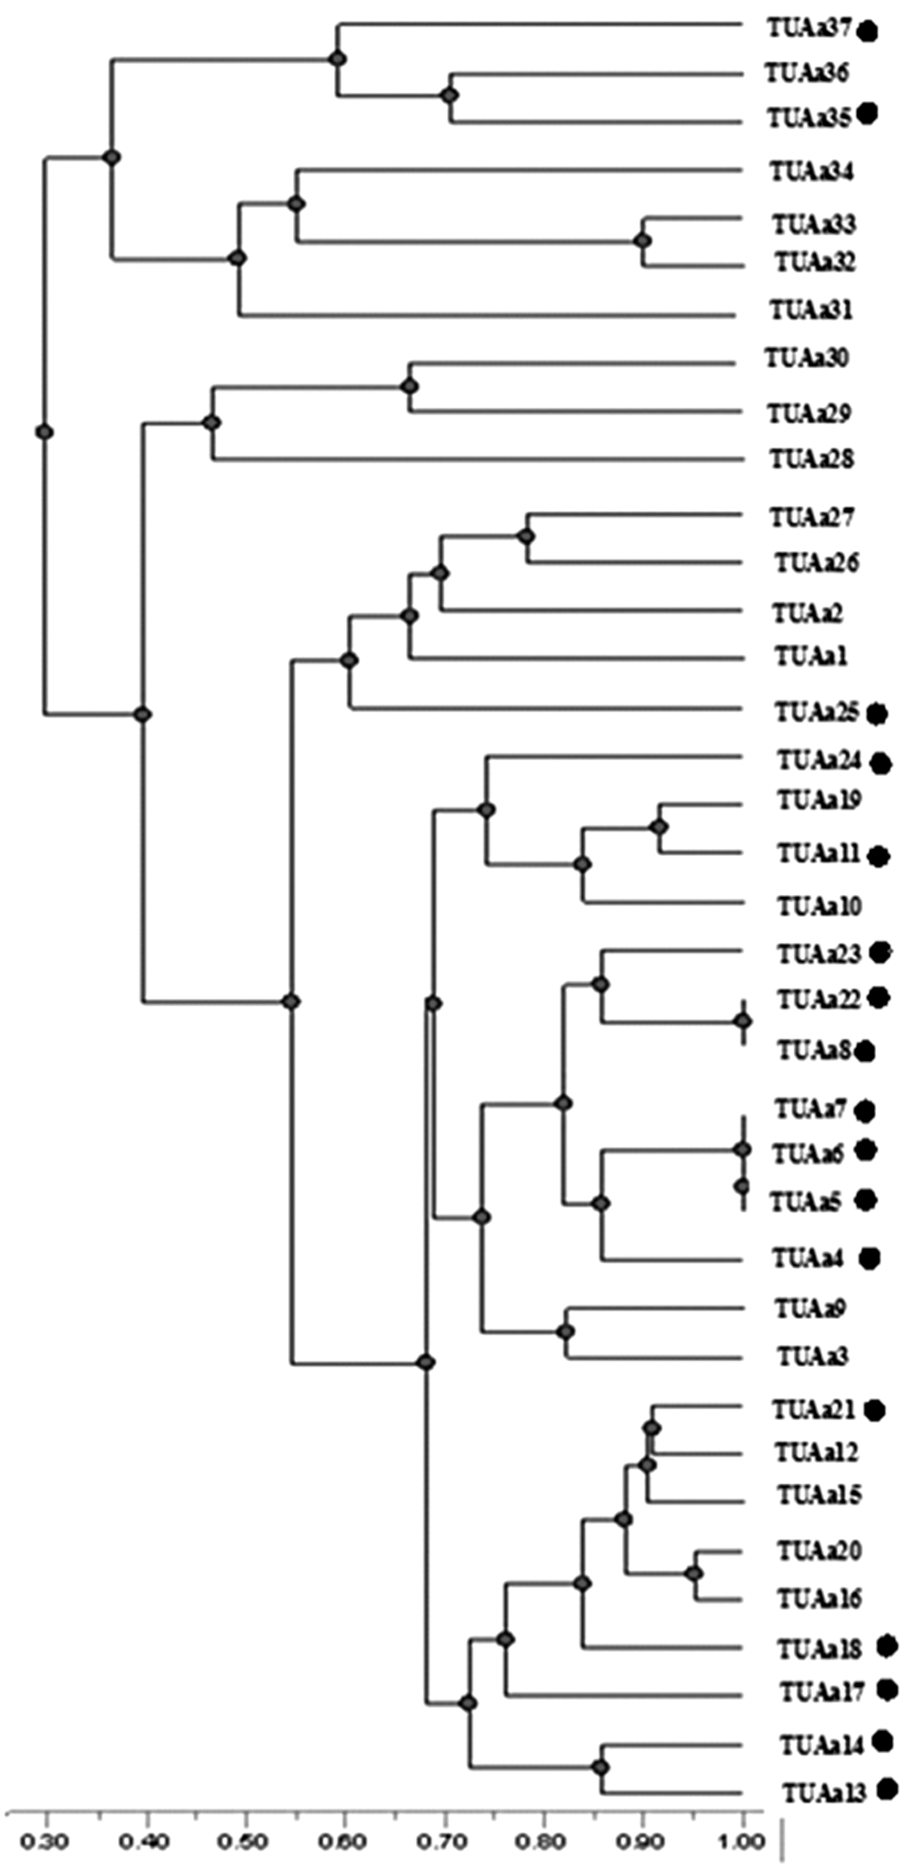
Dendrogram showing relationships among 37 isolates of Aspergillus Welwitschiae isolated from different onion samples. Genetic distances were obtained by the specific genes random primer–polymerase chain reaction technique using combining results of six primers. Fumonisin-producing isolates are marked with dots. The scale shows the genetic distance.
Conclusions
Our study has shown that the most common fungus isolated from the onion bulb was A. welwitschiae. The designed primer pairs could easily discriminate A. welwitschiae from other species of Aspergillus section Nigri. Of 37 isolates of A. welwitschiae, 18 isolates were fumonisin producers, while none of them was able to produce ochratoxins. Multiplex PCR reactions targeting fumonisin biosynthetic genes confirmed the abilities of isolates for fumonisin production.
Footnotes
Acknowledgment
This work was supported by a grant (Contract No. 1827-433-1) sponsored by Taif University, Saudi Arabia.
Disclosure Statement
No competing financial interests exist.