
Abstract
Beef product recall data from 2005 through 2012 associated with Shiga toxin–producing Escherichia coli (STEC) O157 contamination were used to develop quantitative models to estimate the number of illnesses prevented by recalls. The number of illnesses prevented was based on the number of illnesses that occurred relative to the number of pounds consumed, then extrapolated to the number of pounds of recalled product recovered. A simulation using a Program Evaluation and Review Technique (PERT) probability distribution with illness-related recalls estimated 204 (95% credible interval, 117–333) prevented STEC O157 illnesses from 2005 through 2012. Recalls not associated with illnesses had more recalled product recovered and prevented an estimated 83 additional STEC O157 illnesses. Accounting for underdiagnosis resulted in an estimated total of 7500 STEC O157 illnesses prevented over 8 years. This study demonstrates that recalls, although reactive in nature, are an important tool for averting further exposure and illnesses.
Introduction
T
If FSIS investigators determine that an FSIS-regulated product contains a pathogen or is harmful to health, a recall committee is convened to discuss the investigative findings and whether a recall can be recommended (FSIS, 2013a). FSIS personnel coordinate with the establishment to determine the scope of the recall, conduct effectiveness checks to ensure product is removed from commerce, and distribute public notification of the recall (FSIS, 2013b). Following the recall action, the quantity of product recovered by the establishment is also obtained and posted to the FSIS website.
Evaluations of recall effectiveness have traditionally focused on the comprehensiveness, effectiveness, and speed of removing contaminated product from commerce (Patrick et al., 2007; Hanson et al., 2011). However, several studies have modeled the public health benefits and attempted to estimate the number of illnesses averted by the recall (C.W. Hedberg, unpublished data). Hartnett developed a model focused on food defense examining the response to an event of intentionally contaminated food products (Hartnett et al., 2009). One of three components of the model was the public health authority response, which included exposures averted due to consumer compliance with advisories (Hartnett et al., 2009). A small-scale economic analysis of a single state laboratory–based surveillance system has also been conducted (Elbasha et al., 2000). However, due to a lack of data to determine the number of cases averted, researchers instead calculated threshold values to determine whether the system was cost beneficial (Elbasha et al., 2000).
This study aimed to develop models to quantify STEC O157 illnesses prevented by recalls of beef products from 2005 through 2012 utilizing multiple models to address the inherent uncertainty in the public health data. The results from the study will be used to develop and assess methods of simulating prevented illnesses, evaluate the public health benefits of recalls, and provide a straightforward framework for modeling of food recalls.
Materials and Methods
We obtained data, available on the recall pages of the public FSIS website, from recalls carried out by FSIS-regulated establishments from 2005 through 2012. A spreadsheet was created to include illness-related recalls due to STEC O157 and beef products. Specific data fields included the FSIS recall number; number of pounds recalled; reason for the recall; whether the product was distributed to hotels, restaurants, or institutions (HRI); and the pounds of recalled product recovered.
The Centers for Disease Control and Prevention (CDC) maintains the Foodborne Disease Outbreak Surveillance System (FDOSS), which collects data on foodborne illness outbreaks reported in the United States (Gould et al., 2013). The FSIS recall data were cross-referenced with FDOSS data from 2005 through 2011 to incorporate illness data. As FSIS may initiate an investigation for even single illnesses associated with FSIS-regulated product, we utilized FSIS data for those specific circumstances and for recalls without corresponding FDOSS data.
As shown in Figure 1, the number of illnesses prevented was estimated from the number of illnesses that occurred, relative to the number of pounds consumed and recovered. Loss-adjusted food availability 2012 estimates from the USDA, Economic Research Service (ERS) were used to estimate the amount of product discarded (ERS, 2014). For products distributed to HRI, consumers, or both HRI and consumers, we used factors of 20%, 24%, and 20% product loss, respectively, to estimate the amount of food loss.
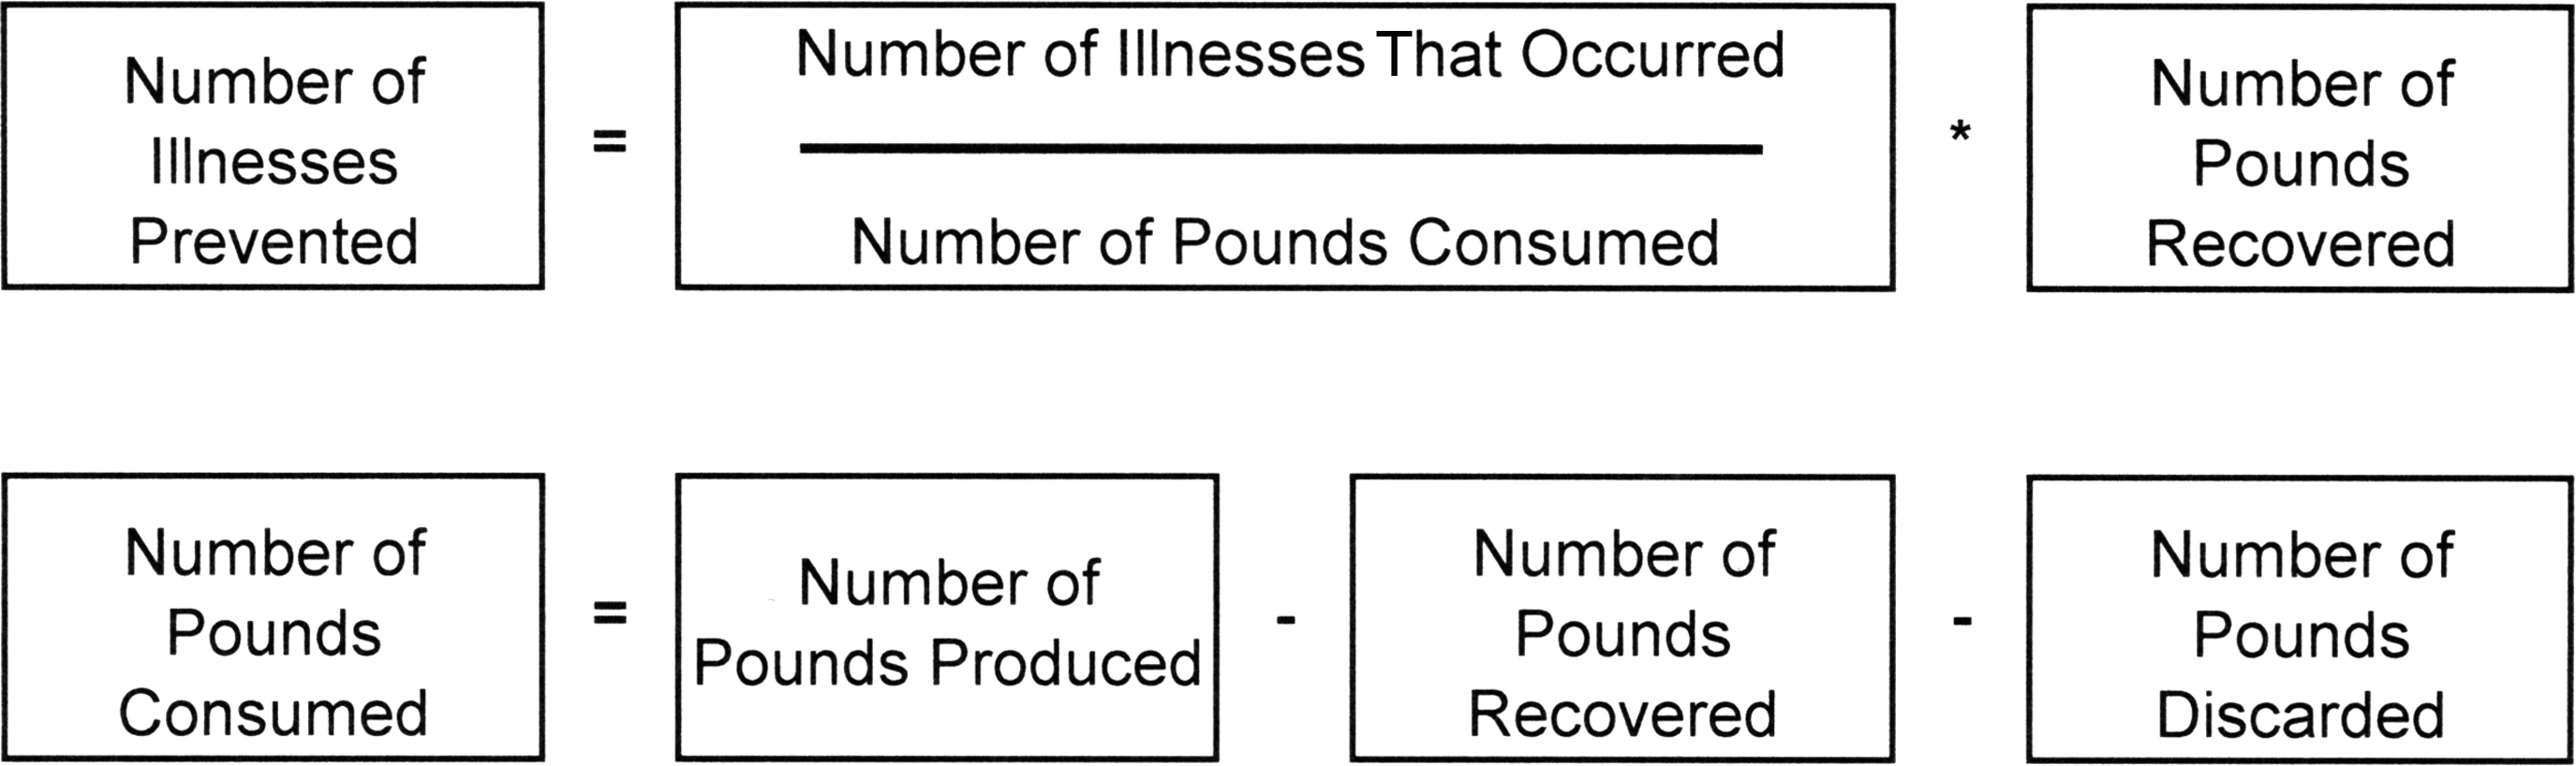
Foundational equations for model generation.
Deterministic model and Beta and Program Evaluation and Review Technique (PERT) simulation models for illness-related recalls
For the deterministic model, we used FSIS recall data to calculate the percent of recalled product that was recovered, number of pounds of product consumed, rate of illnesses per 100,000 pounds of product consumed, and number of illnesses prevented using point estimates. The sum of the number of illnesses prevented by all illness-related recalls of beef products due to STEC O157 conducted from 2005 through 2012 was determined.
We used the Beta probability distribution to describe the uncertainty around the number of illnesses prevented from the deterministic model, relying on the foundational equation presented in Figure 1, but using the percent of recalled product recovered for the simulation. The Beta distribution was characterized by two shape values, α1 and α2 in the equation: Beta (α1, α2). The α1 was defined by the number of pounds of recalled product recovered and α2 was defined by the number of pounds recalled minus the number of pounds of recalled product recovered.
The uncertainty related to the percentage of pounds of recalled product recovered was expressed by a PERT probability distribution due to the nature of the illness-related recall data that are bounded at 0 and 1, with a distribution that is skewed with a long tail to the right (Fig. 2). We gathered descriptive information about two recalls that had a percentage of product recalled more than 2 standard deviations (SD) above the mean. Data on one recall reporting the highest product recovery (92%) was excluded from being the maximum value in the PERT simulation due to concerns with comingling of nonrecalled beef products.
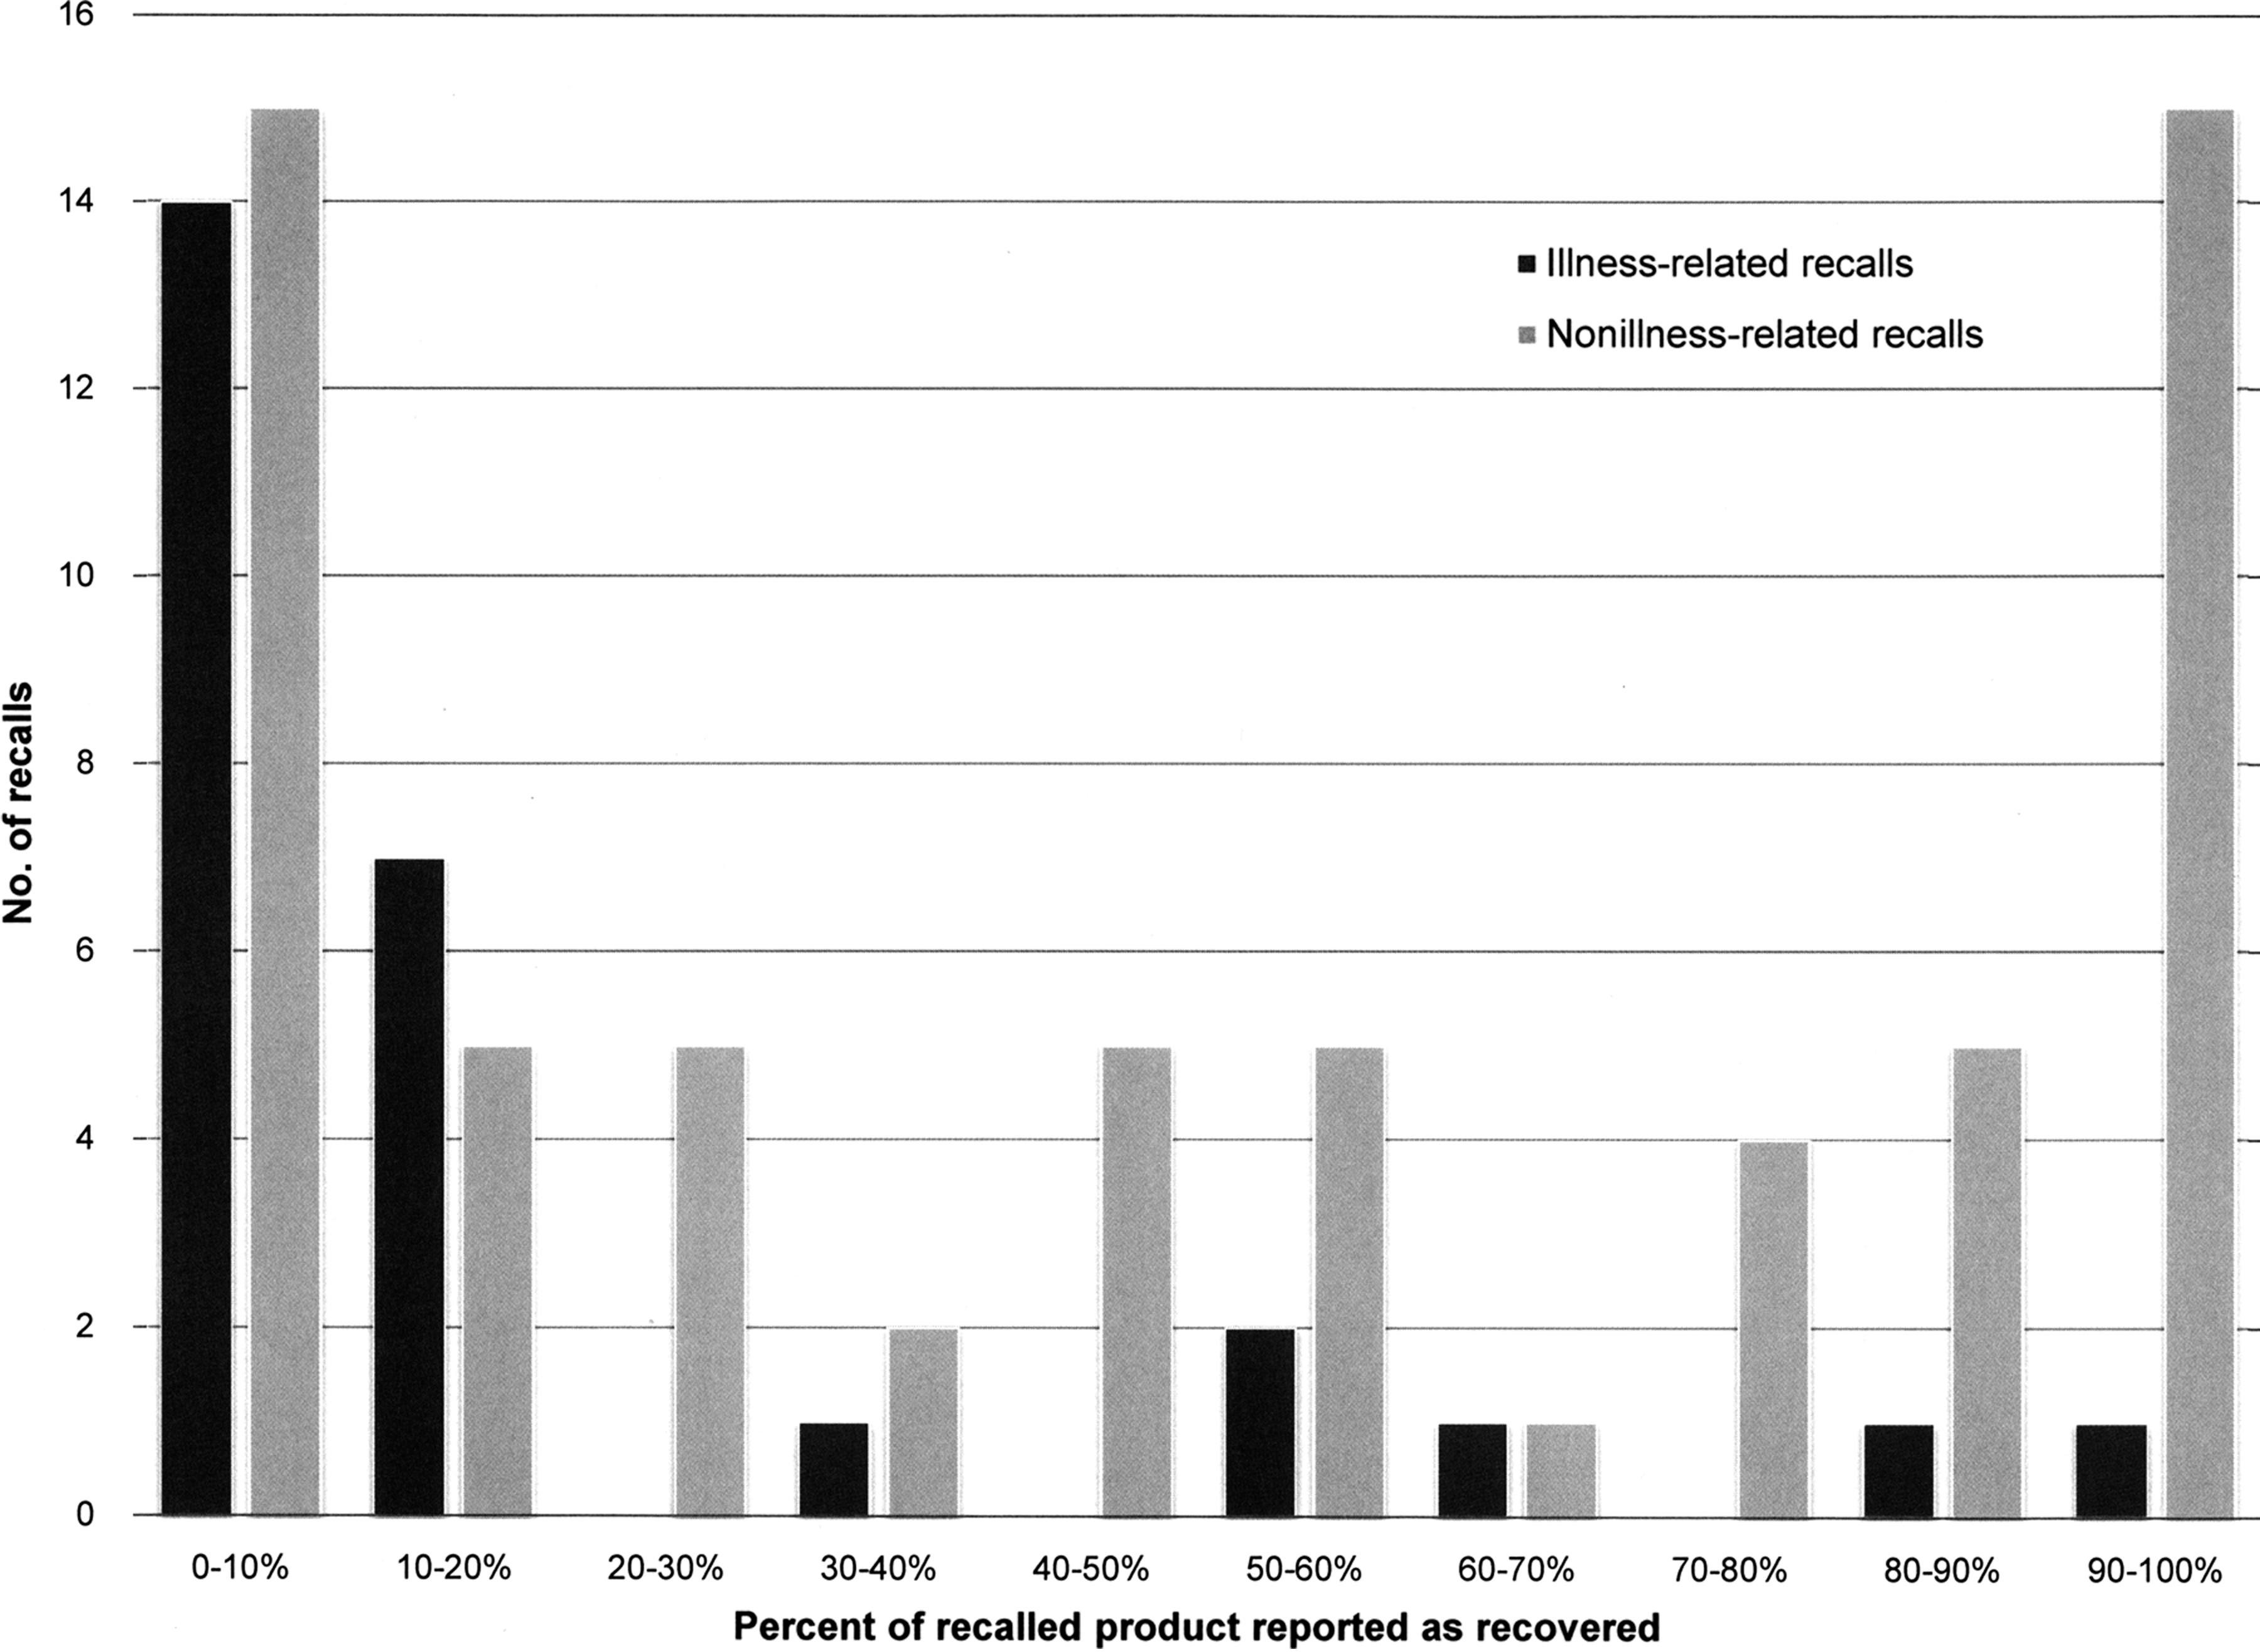
Percent of recalled product recovered, beef product recalls, 2005–2012.
The foundational equations from Figure 1 were modified to estimate the number of illnesses prevented using a PERT distribution with the equation: Pert (minimum value, most likely value, maximum value). The values were defined as a minimum of 0, most likely value of 9.7%, which was the overall percentage of recalled product recovered across all illness-related recalls combined, and maximum of 84.5% corresponding to the maximum product recovered in an illness-related recall, excluding the 92% outlier.
For the Beta and PERT simulations, Latin Hypercube sampling was conducted with 10,000 iterations using @RISK for Excel version 6.1.2 (Palisade Corporation, Ithaca, NY). The number of illnesses was expressed as the mean and 95% credible interval.
Nonillness recalls of beef products due to STEC O157
The deterministic model used data from illness-related recalls of beef products due to STEC O157. This methodology allowed us to use the number of illnesses that occurred relative to the number of pounds of product consumed and recovered following the recall action. In order to assess a more complete picture of the illnesses prevented, we used the mean and median number of illnesses per 100,000 pounds of product consumed calculated from each of the illness-related recall models to estimate the number of illnesses prevented by nonillness-related recalls. The mean and median were multiplied by the total pounds of recalled product that were reported as recovered for the nonillness recalls. We further divided the recalls into triads based on the percent of product recovered to evaluate the likelihood of illness in a recall based on the percentage of recalled product recovered using SAS for Windows version 9.3 (SAS Institute Inc., Cary, NC).
Results
A median of 13 recalls (range, 5–22 recalls) of FSIS-regulated products occurred each year due to STEC and a total of 27 (median 3 each year, range 0–10) of those were STEC O157 illness-related recalls of beef products.
Among the 27 illness-related recalls, approximately 38,930,000 total pounds (median 154,000 pounds) of beef products were recalled. Approximately 3,780,000 total pounds (median 5000 pounds) of recalled beef products were recovered. This represents 9.7% of recalled product recovered overall for the 8-year study period.
As anticipated, there was great variability in the amount of beef product recovered following a recall. While the median percentage of beef product recovered by each recall was 5%, the mean percentage was 19% and the range was from 0% to 92%. The bounded distribution was skewed with a large number of illness-related recalls with a small amount of recovered product on the left and a long tail to the right with few recalls with a large amount of recovered product (Fig. 2). A total of 517 STEC O157 illnesses (median 9, range 1–79) were reported as associated with the 27 recalls.
Deterministic model and Beta and PERT simulation models for illness-related recalls
Table 1 lists the individual results of the estimated number of illnesses prevented by illness-related recalls in the 2005–2012 period. Figure 3 graphically illustrates the results of the models using a modified boxplot design. The “whiskers” for the Beta and PERT probability distribution simulations show the minimum and maximum values. The box outlines the 95% credible intervals, divided in two by the mean for the simulation.
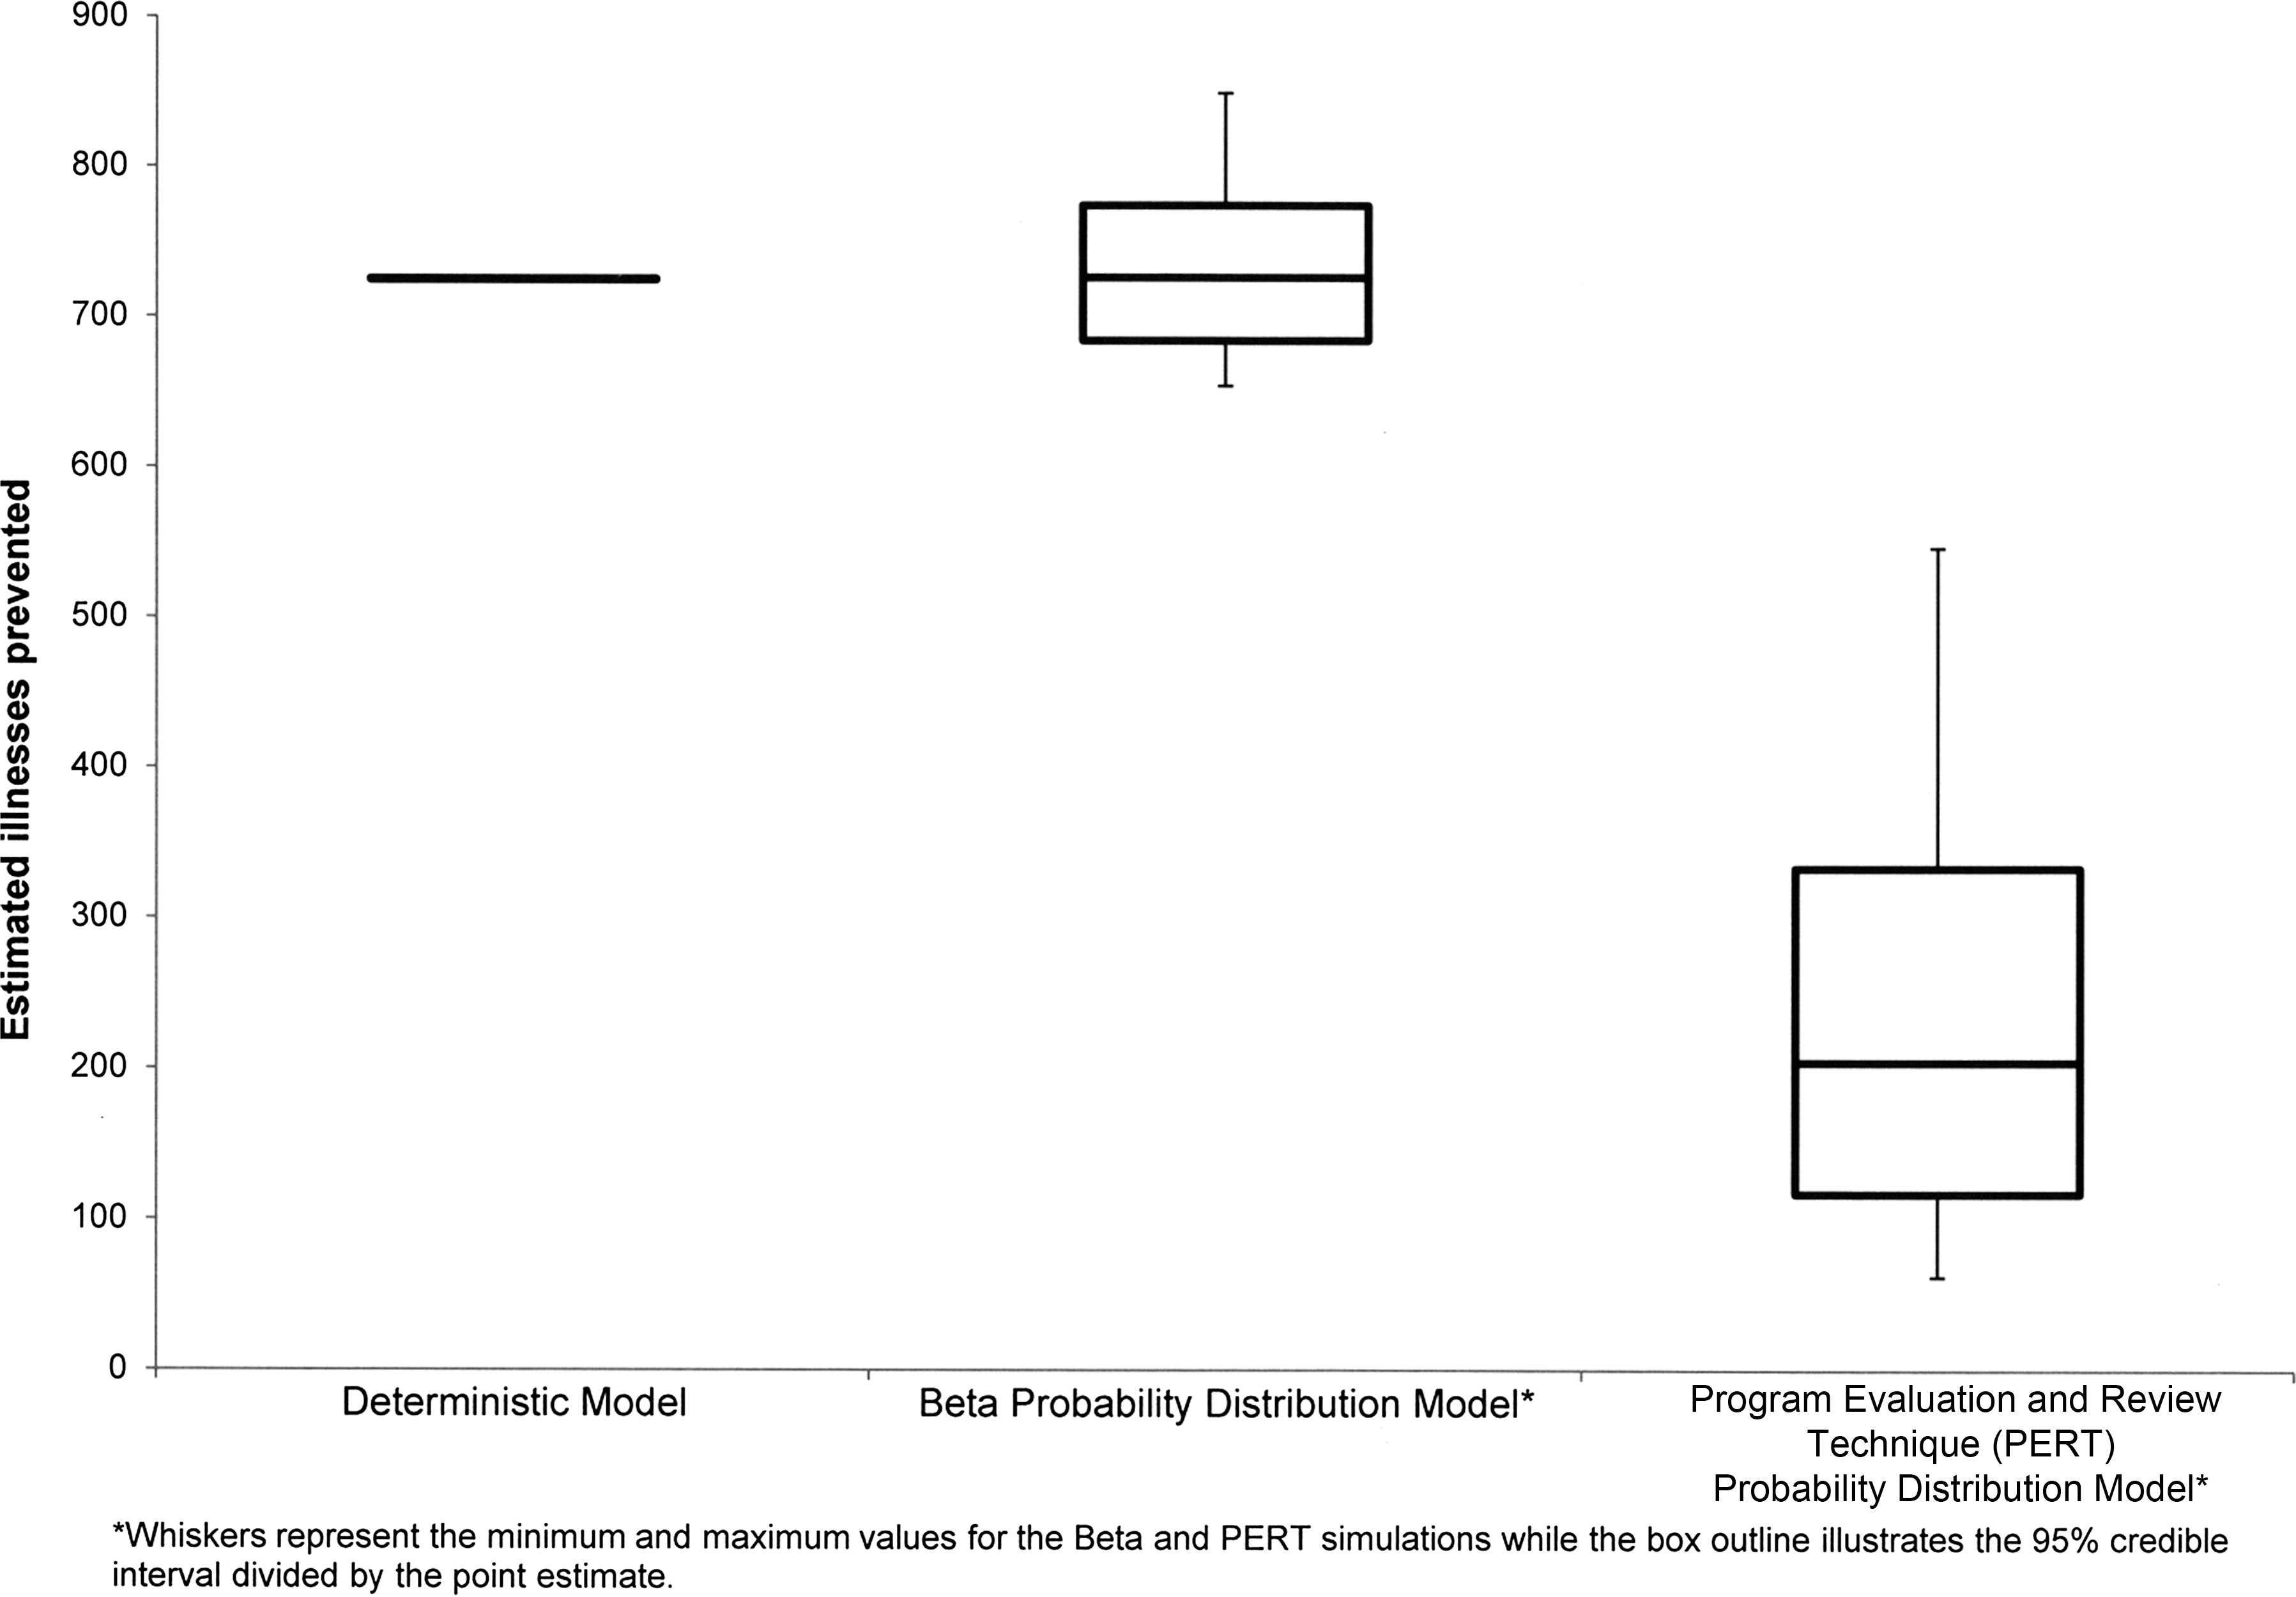
Modified boxplot of illnesses prevented, illness-related recalls of beef products, 2005–2012, by model approach.
Point estimates for Beta and Program Evaluation and Review Technique (PERT) models are the mean value.
The number of illnesses prevented by an individual recall ranged from 0 to 291 illnesses (mean 27 illnesses) for the deterministic model. Over the 27 illness-related recalls, an estimated total of 725 illnesses were prevented. Two recalls in particular, both from 2009, each contributed more than 260 prevented illnesses to the total calculation due in part to a high percentage of recalled product recovered.
Using the Beta probability distribution, we estimated that the total number of illnesses prevented over the 8-year study period was 726 (95% credible interval, 684–774). The number of illnesses prevented by an individual recall resulted in a minimum of 0 and a maximum of 291 prevented illnesses.
Using the PERT probability distribution for simulation of the percentage of product recovered, we estimated that the total number of illnesses prevented over the 8-year study period was 204 (95% credible interval, 117–333). The number of illnesses prevented by an individual recall resulted in a minimum of 0 and a maximum of 32 prevented illnesses. The two recalls from 2009 contributing the largest number of prevented illnesses in the deterministic model and Beta probability distribution simulation were much more muted, totaling 23 prevented illnesses.
Nonillness recalls of beef products due to STEC O157
From 2005 through 2012, a total of 63 recalls of beef products due to STEC O157 occurred without reported illnesses. Of those, one recall did not have an estimated amount of product recalled and was excluded. For multiple recalls, where the amount of recalled product reported as recovered exceeded 100%, we adjusted the amounts to reflect a maximum of 100% of product recovered. The remaining 62 recalls accounting for an estimated total of 9.5 million (median 5000) pounds of recalled product are presented in Figure 2 compared against the illness-related recalls of beef products due to STEC O157. While both types of recalls had a relatively large number where <10% of product was recovered, the nonillness-related recalls had a strikingly dissimilar “U-shaped” distribution compared to the right-skewed distribution of illness-related recalls. Additionally, the recalls not associated with illnesses had a higher percentage of recovered product. An estimated total of 1.2 million (median 2000) pounds of product were recovered from all 62 recalls.
The number of prevented illnesses estimated for the recalls not associated with illnesses varied depending on the model and whether the mean or median number of illnesses per 100,000 pounds of product consumed was used. The largest number of prevented illnesses was estimated as 14,286 illnesses and resulted from using the mean of 1199 illnesses per 100,000 pounds of product consumed from the Beta probability distribution simulation model. The smallest number, 71 prevented illnesses, resulted from using the median of 6 illnesses per 100,000 pounds of product consumed from the Beta probability distribution model. Using the median of 7 illnesses per 100,000 pounds of product consumed from the PERT probability distribution simulation model, there were an estimated 83 prevented STEC O157 illnesses.
All recalls (i.e., illness-related and nonillness-related recalls) were divided into similar-sized triads; 29 recalls in the 0–10% product recovery range (triad 1), 32 recalls in the 10–60% range (triad 2), and 28 recalls in the 60–100% range (triad 3). The percent of all recalls that were illness related decreased from 48% in triad 1 to 31% and 11% in triad 2 and triad 3, respectively (test for trend, test statistic=9.4, p=0.002).
Discussion
From 2008 through 2010, beef was consistently within the top three commodities associated with outbreak-related illnesses, and STEC O157 in beef was among the top three pathogen-commodity pairs for most outbreaks (Gould et al., 2011a, 2013). By 2011 and 2012, the latest years with published data, a total of 801 and 831 foodborne disease outbreaks were reported, respectively, of which only 17 and 24 were caused by STEC O157 infections (CDC, 2014a, 2014b). Beef was associated with 11 outbreaks in each of the 2 years, accounting for 118 illnesses in 2011 and 232 illnesses in 2012, but STEC O157 associated with beef consumption was not within the top 5 pathogen-food category pairs in 2011 or 2012 (CDC, 2014a, 2014b).
Ground beef remains a staple of the American diet. In 2006–2007, 75% of respondents to a FoodNet survey reported consuming a ground beef product; 18% reported consuming it with a pink color, which may indicate it is undercooked (Taylor et al., 2012). These behaviors demonstrate an ongoing risk of illness from sporadic contamination of ground beef.
As the number of STEC O157 illness outbreaks associated with beef products declines, the need for robust surveillance and food monitoring programs will continue. Improving the speed and effectiveness of public health investigations to identify contaminated sources and subsequently take public health actions, such as recalls, is essential. Enhancing our knowledge of the public health benefits of recalls could provide motivation to improve foodborne illness investigations and recall actions.
We used several models to estimate the number of illnesses prevented by recalls of beef products due to STEC O157. While the estimates resulting from the deterministic and Beta distribution models represented a large number of prevented illnesses, we believe the PERT estimates to be a more appropriate indicator of the illnesses prevented. The number of prevented illnesses using the deterministic and Beta models was affected by the percent of pounds recovered in any given recall, and therefore was heavily influenced by outliers, as evidenced by the sensitivity analysis. The PERT model, however, reduced the impact of the outliers and more uniformly utilized illness data to produce the estimates.
Our results for recalls that were not associated with illnesses strongly suggest that removing product from commerce is a key determinant of illness risk. The “U-shaped” distribution of the percentage of product recovered suggests that effectively preventing foodborne illnesses from occurring may depend on ensuring that contaminated product is recalled and recovered quickly. FSIS recommendations and policies for keeping contaminated product out of commerce, such as not applying the mark of inspection pending certain test results, which requires establishments to control product tested by FSIS for STEC O157 and other pathogens (Office of the Federal Register, 2012), may have more public health benefits than originally estimated.
We recognize that a small fraction of infectious diseases are diagnosed and reported to public health professionals. Scallan estimated multipliers of 1.0 for under-reporting and 26.1 for underdiagnosis for STEC O157 infections (Scallan et al., 2011). We applied these multipliers to the PERT distribution results in order to estimate the total possible illnesses prevented. From 2005 through 2012, for illness-related recalls, an estimated 5300 STEC O157 illnesses were prevented. For nonillness-related recalls, the estimated total is 2200 STEC O157 illnesses prevented.
In order to improve the models and increase the precision of the estimates, there are a number of steps to be taken. The amount of product recovered is reported from an establishment to FSIS. Although a certain amount of uncertainty is inherent, more accurate estimates are needed from the entirety of the reporting chain from grocers, hotels, restaurants, institutions, distributors, and establishments. Furthermore, we need to elucidate factors behind the uncertainty and learn about what leads to lower, as well as higher, amounts of recalled product being reported as recovered. More than 30% of recalls, both illness-related and nonillness-related, were categorized in the 0–10% category for the percent of recalled product recovered. In order to prevent illnesses, there needs to be focus on an upward shift to a higher percentage product recovery. Additional studies of consumers are also needed to further quantify the percentage of consumers that take action by discarding or returning recalled product.
There are also improvements that can be made to ensure better data quality, and in particular, data connectedness between federal establishments. We would recommend a continued commitment to ensuring that databases from multiple different agencies, not only FSIS and CDC, but across federal, state, and local public health, agriculture, and environmental health entities, include fields to enhance data connectedness.
Time is of the essence when conducting foodborne illness investigations. Improvements within the entire system, from detection of clusters to initiation of recalls, would result in larger numbers of prevented illnesses. Analysis of public health programs identified elements such as intervals between case report and interviews and submission of isolate and subtyping as critical (Hedberg et al., 2008). In regard to beef products and regulatory agencies, ensuring more detailed and complete records of beef grinding to improve the efficiency of traceback have been supported (Gould et al., 2011b). We recommend a commitment to ensure that resources are available to quickly investigate foodborne illnesses and swiftly take preventive action to stop new illnesses from occurring.
Conclusions
This study demonstrates that recalls, although reactive in nature, are also an important tool to prevent further exposure and illnesses. The simulation using a PERT distribution resulted in an estimated 204 illnesses prevented by recalls for FSIS-regulated beef products recalled due to STEC O157 illnesses from 2005 through 2012. Including an underdiagnosis multiplier increases the estimate to a total of 5300 illnesses prevented. Furthermore, for recalls not related to illnesses, our results suggest that removing product from commerce is a key determinant of illness risk. These recalls are estimated to have prevented an additional 83 STEC O157 illnesses, approximately 2200 using the underdiagnosis multiplier. Although improvements to data quality and further study of the factors contributing to the amount of product recovered following a recall would allow for further refinement of the model, the data and results of this study can drive improvements to prevent additional illnesses.
Footnotes
Acknowledgments
The authors would like to thank L. Hannah Gould, Wayne Schlosser, Kirk Smith, Danah Vetter, Lisa Volk, and Kelly Walsh for sharing their valuable knowledge and expertise.
Disclosure Statement
No competing financial interests exist.