




Abstract
The goals of this study were to monitor the growth kinetics of Salmonella Enteritidis in chicken juice using real-time polymerase chain reaction (PCR) and to evaluate its efficacy by comparing the results with an experimental database. Salmonella Enteritidis was inoculated in chicken juice samples at an initial inoculum of 104 CFU/mL with inoculated samples incubated at six different temperatures (10, 15, 20, 25, 30, and 35°C). Sampling was carried out for 36 h to observe the growth of Salmonella Enteritidis. The total DNA was extracted from the samples, and the copy number of the Salmonella invasion gene (invA) was quantified by real-time PCR and converted to Salmonella Enteritidis cell concentration. Growth kinetics data were analyzed by the Baranyi and Roberts model to obtain growth parameters, whereas the Ratkowsky's square-root model was used to describe the effect of the interactions between growth parameters and temperature on the growth of Salmonella Enteritidis. The growth parameters of Salmonella Enteritidis obtained from an experiment conducted at a constant temperature were validated with growth data from chicken juice samples that were incubated under fluctuating temperature conditions between 5°C and 30°C for 30-min periods. A high correlation was observed between maximum growth rate (μmax) and storage temperature, indicating that the real-time PCR-monitoring method provides a precise estimation of Salmonella Enteritidis growth in food material with a microbial flora. Moreover, the μmax data reflected data from microbial responses viewer database and ComBase. The results of this study suggested that real-time PCR monitoring provides a precise estimation of Salmonella Enteritidis growth in food materials with a background microbial flora.
Introduction
N
Predictive microbiology is an essential and basic tool to model bacterial growth and estimating microbial behavior in foods to ensure the safety and quality of final products (McMeekin et al., 1997; Bovill et al., 2001; Longhi et al., 2013; Cárdenas et al., 2008; Ferrer et al., 2009; Pouillot and Lubran, 2011; Costa et al., 2016). Most published studies have used conventional culture methods, which are considered to be the gold standard for bacterial detection and identification (Manichanh, 2011; Lungu et al., 2012; Laupland and Valiquette, 2013; Liang et al., 2016). However, conventional culture methods is labor intensive, requires skilled personnel, time consuming (requires 4–8 days), not suitable for routine testing of large numbers of samples, and can be difficult for sample with high level of background flora (Uyttendaele et al., 2003; Kawasaki et al., 2005; Juneja et al., 2007; Lungu et al., 2012; McKee et al., 2012; Ahmed et al., 2014). The use of selective medium can also lead to false negative results, derived from insufficient colony counts (Hoadley and Cheng, 1974; Forsythe, 2008; Özkanca et al., 2009; Lavieri et al., 2014).
In recent years, the use of highly sensitive and specific real-time polymerase chain reaction (PCR) methods have been developed for the rapid detection and quantification of foodborne pathogens from foods and other samples (Kawasaki et al., 2010; Zhao et al., 2014; Law et al., 2015). In a previous study, real-time PCR was used to monitor the growth kinetics of Salmonella in pasteurized and nonpasteurized milk samples (Kawasaki et al., 2014), demonstrating the potential use of real-time PCR to construct growth prediction models in food samples with high-throughput results. In this study, we monitored the growth kinetics of Salmonella Enteritidis in chicken juice sample, and evaluated the ability of real-time PCR quantification and a mathematical model to predict bacterial growth under constant and fluctuating temperatures.
Materials and Methods
Bacterial strains and culture conditions
Salmonella enterica serovar Enteritidis IFO3313 (obtained from the Institute for Fermentation Osaka, Japan) was grown overnight at 35°C in trypticase soy broth (TSB, BBL, Becton Dickinson and Company, USA). Two incubation steps were performed by transferring pre-enrichment culture into new TSB medium and incubated at 35°C. The optical density (OD 600 nm) was monitored until it reached 0.80, measured by automatic OD-measuring instrument (BioPlotter, Toyo Sokki Co. Ltd., Japan). Enriched culture was diluted in 9 mL of phosphate-buffered saline in a 10-fold dilution series to generate 103, 104, 105, 106, and 107 colony-forming units per mL (CFU/mL). To measure the concentration of bacterial solution, 104 CFU/mL of the diluted culture was spread onto trypticase soy agar (TSA; Difco, Becton Dickinson and Company, USA) using spiral plater (Eddy Jet 2; IUL, S.A., Spain), incubated at 35°C for 24 h, and was counted to determine the initial inoculation number.
Sample preparation
Sliced chicken meat obtained from slaughterhouse was placed in trays at 5°C to collect chicken drip solutions. To remove large particles, chicken juice samples were centrifuged at 15,000 × g for 15 min. Each 10-mL sample was placed inside sterilized centrifuge tube that was stored at −20°C and defrosted at 5°C before use. To assess natural contamination of Salmonella, samples were checked following the FDA-BAM (Food and Drug Administration-Bacteriological Analytical Manual) Salmonella determination method. Furthermore, to determine the initial concentration of background flora in a sample, the solution was spread on TSA using spiral plater and incubated at 35°C for 24 h to measure the viable cell count.
Bacterial inoculation and sample collection at constant temperature
Each 10 mL of chicken juice sample was inoculated with 50 μL of diluted Salmonella Enteritidis culture. An initial inoculum level of 104 CFU/mL was used, since the optimum quantification range for real-time PCR starts at 103 CFU/mL (Pfaffl, 2000). Inoculated chicken juice samples were incubated at six different constant temperatures (10, 15, 20, 25, 30, and 35°C). Sampling was conducted every 3 h from each sample at 10, 15, 20, 25, and 30°C, with sampling for the sample incubated at 35°C conducted every 1 h. The amount of 200 μL chicken juice sample from each tube was transferred into a microcentrifuge tube and stored at −20°C immediately until all samples were collected for DNA extraction.
Bacterial inoculation and sample collection at fluctuating temperatures
A 10 mL of sample was inoculated with 50 μL of diluted Salmonella Enteritidis culture at an initial inoculum level as 104 CFU/mL. Each 500 μL aliquots of inoculated samples were transferred into 20 glass test tubes and incubated in two different water baths set at 5 and 30°C. Temperature changes were recorded using temperature data logger (Thermo recorder tr-52, T&D Corporation, Japan) every 5 s. The temperature was cycled repeatedly between 5°C and 30°C with a cycle period of 30 min. The samples were transferred into microcentrifuge tubes and immediately stored at −20°C until DNA extraction.
Standard curve construction
Standard curve was constructed to observe the relationship between DNA copy number and Salmonella Enteritidis cell number from samples. Salmonella Enteritidis cultures were diluted in chicken juice to obtain concentrations as 103, 104, 105, 106, and 107 CFU/mL. Standard curve was used to obtain quantitative value of the Salmonella Enteritidis cell concentration from each DNA template and converted to bacterial cell concentration (CFU/mL).
DNA extraction
A 25 μL aliquot of each chicken juice sample obtained during sampling periods and standard curve samples of Salmonella Enteritidis in chicken juice were extracted using the Qiagen DNeasy Blood and Tissue Kit (QIAGEN GmbH, Germany). DNA extraction procedure was performed following Qiagen DNeasy Blood and Tissue protocol. The flow-through of extracted solutions obtained was used as DNA template for real-time PCR.
Real-time PCR conditions
The primers targeted Salmonella invA gene fragment to generate a modified 287-bp amplicon product (Rahn et al., 1992). The detection probe was labeled with FAM (6-carboxyfluorescein) and BHQ1 (Black Hole Quencher). Each 25 μL of real-time PCR reaction contained 2.5 μL of DNA template and 22.5 μL of real-time PCR master mix solution, consisting of TaqMan gene expression master mix (Applied Biosystems, USA), 200-nM primers (Fwd-primer: 5′-GTGAAATTATCGCCACGTTCCGGCAA-3′ and Rev-primer: 5′-CTTCATCGCACCGTCAAAGGAACC-3′), and 100-nM probe (Internal probe: 5′-FAM-AGTCGCGGCCCGATTTTCTCTGGATGGT-BHQ1-3′). Reactions were run in an ABI Prism 7900 Sequence Detection System (Applied Biosystems, USA). PCR conditions were set for 2 min at 50°C, 10 min at 95°C, followed by 50 cycles of 15 s at 95°C, and 1 min at 65°C. The fluorescence signals were monitored for quantification of PCR products; a fluorescence threshold was manually set (dRn = 0.2) across all samples in the experiment such that it bisected the exponential phase of the fluorescence signal increase. The cycle threshold (CT) was defined as the cycle number at which the dRn fluorescence of a sample crossed the threshold.
Model development for growth kinetics of Salmonella Enteritidis
Cell concentration of Salmonella Enteritidis obtained from real-time PCR were fitted by the Baranyi and Roberts model (Baranyi and Roberts, 1994), using DMFit program. The growth rate parameters were transformed into the specific growth rate (μmax, 1/h) as follows:
where ln is the natural logarithm. The relationship between μmax and temperature was described by the following Ratkowsky's square root model (Ratkowsky et al., 1982):
where b, T, and Tmin indicate constant, temperature, and minimum growth temperature, respectively.
Data comparison with microbial responses viewer database and ComBase
To validate the estimated μmax of Salmonella Enteritidis in chicken juice, data were compared with the estimated μmax from existing predictive model databases, including microbial responses viewer (MRV) database
Model performance evaluation
The performance of the secondary and tertiary models was evaluated using the acceptable predicted zone method (Oscar, 2005). Prediction errors or relative errors (REs) for individual prediction cases were calculated as follows:
such that an RE of less than zero represented a fail–safe prediction and an RE greater than zero represented a fail–dangerous prediction. The percent RE in an acceptable prediction zone from −0.3 (fail–safe) to 0.15 (fail–dangerous) to quantify the performance of the μmax model (Oscar, 2009). The performance of the secondary model for μmax was classified as acceptable when the%RE was 70, that is, 70% of the predictions of μmax could not deviate from observed values by more than 30% in the fail–safe direction or by more than 15% in the fail–dangerous direction. The proportion of RE (pRE) that fell into the acceptable prediction zone (the number of RE in the acceptable prediction zone/total number of prediction cases) of an RE derived from the μmax model was calculated and used as a new measure of model performance.
Furthermore, the tertiary model performance under fluctuating temperatures was evaluated by determining the percentage of residuals in an acceptable prediction zone from −1.0 log (fail–safe) to 0.5 log (fail–dangerous) for the bacterial number (log10 CFU/g) (Oscar, 2005). Observed values and predicted values were used to calculate residuals (r):
where ri (log) is the i th residual, yi is the i th observed value (log), and ŷi is the i th predicted value (log). In addition, more widely used measures of model performance, such as bias and accuracy factors (Bf and Af, respectively) (Ross, 1996) and root mean square error (RMSE) were also calculated and used to evaluate the model.
Results
Quantification of the performance of real-time PCR
A standard curve from serial dilutions of Salmonella Enteritidis in chicken juice samples was performed to determine the sensitivity of this assay to quantify a range of DNA concentrations, from 2.0 × 10³ CFU/mL to 2.0 × 10⁷ CFU/mL (Fig. 1). The slope from standard curve was −3.2924 with PCR efficiency as 101.2% and R2 value of 0.998 obtained from standard curve generated using 10-fold serial dilutions in chicken juice. The results of this study showed high efficiency since the range of real-time PCR efficiency is 90–110% (Demes et al., 2012).
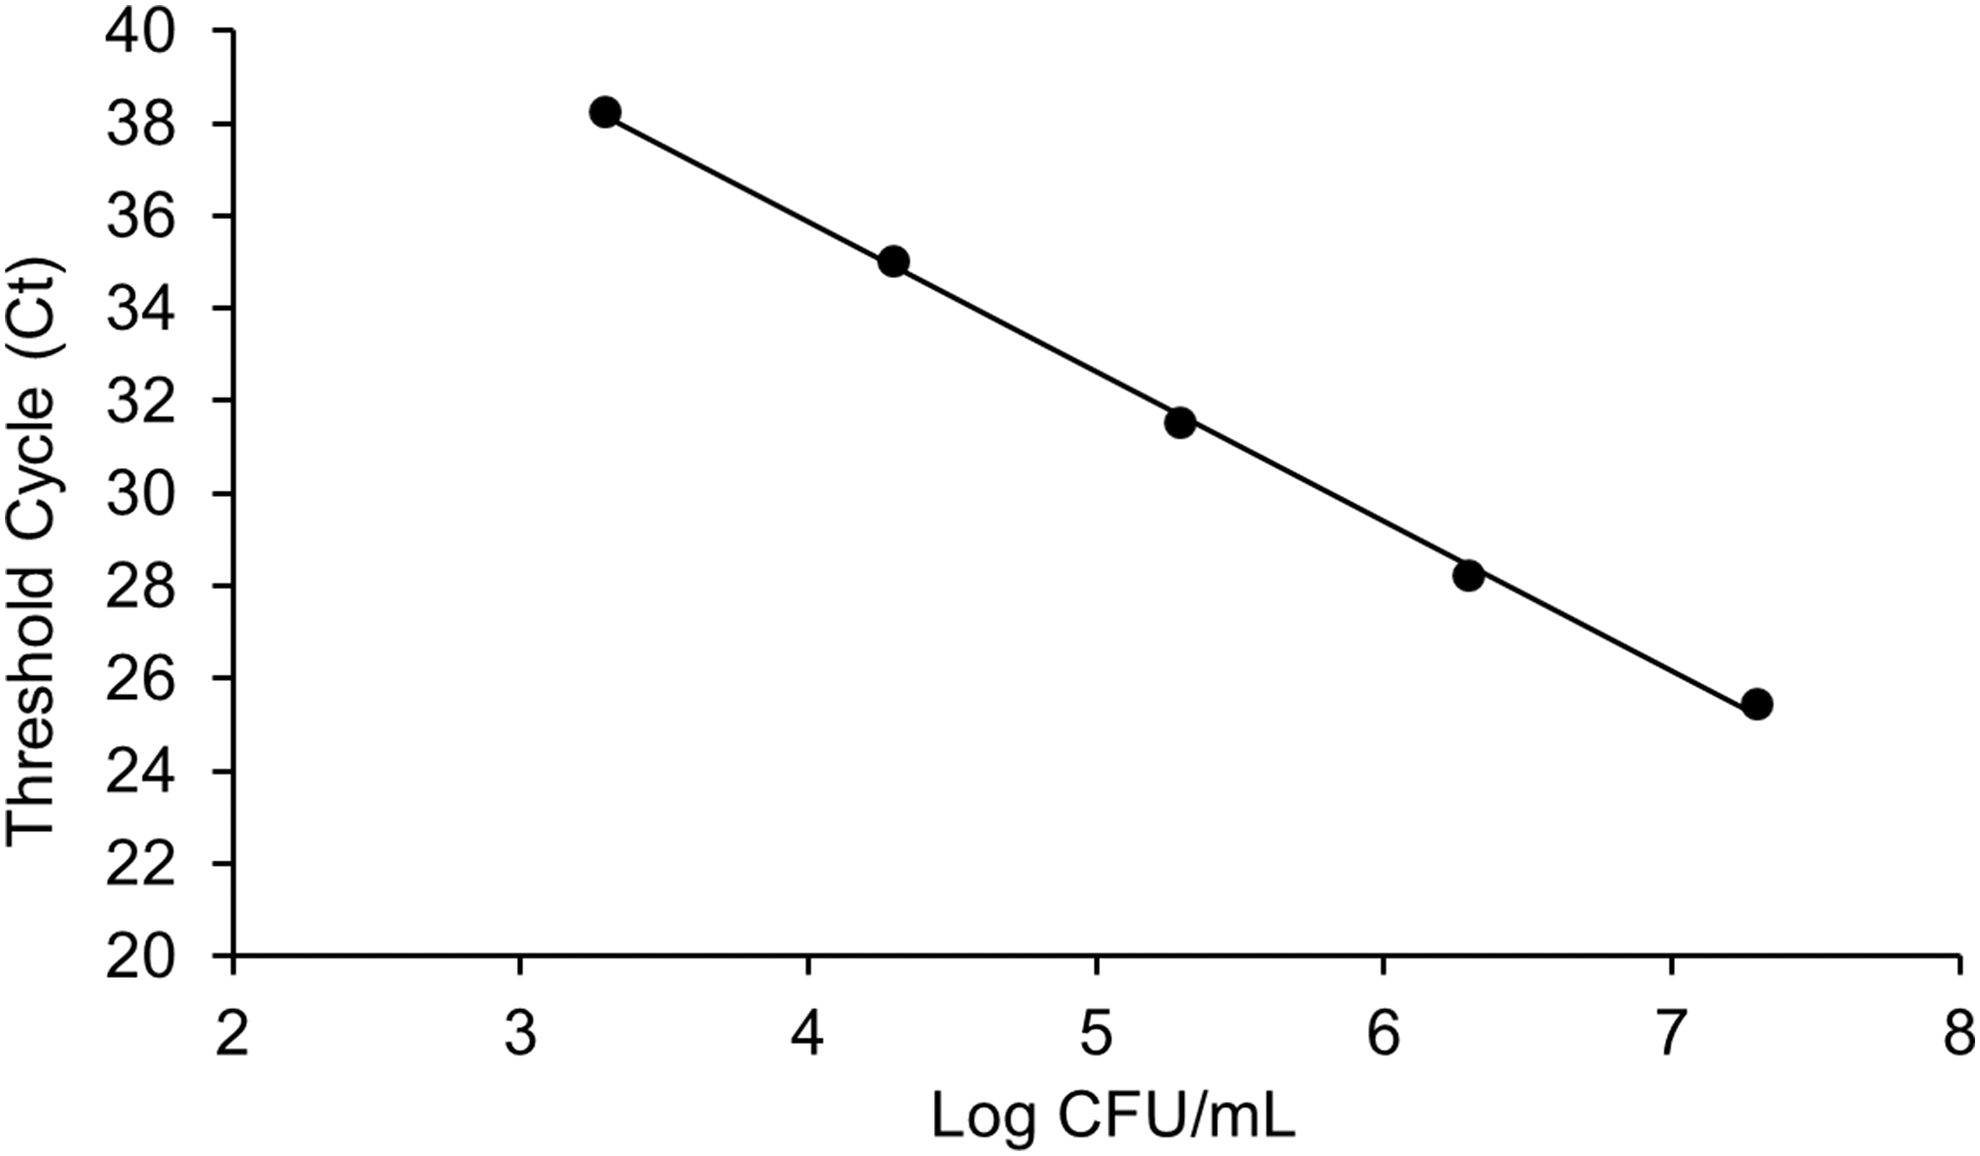
Relationship between Ct values and the number of Salmonella Enteritidis cells inoculated in chicken juice samples, as quantified by real-time PCR. PCR, polymerase chain reaction.
Growth rate estimation by real-time PCR
The results obtained from six different temperatures by real-time PCR quantification showed that Salmonella Enteritidis cell concentrations were between 7.2 and 8.6 CFU/mL when they reached stationary phase. Salmonella Enteritidis in chicken juice samples incubated at 10°C reached stationary phase after 168 h, whereas samples at 15°C reached stationary phase after 48 h, with bacterial concentration as 8.3 and 8.1 log CFU/mL, respectively (data not shown). The total number of microbial flora at the end of the incubation time was measured as 8.3 log CFU/mL using the conventional culture method. High correlation between the actual growth curve and the fitted curve generated by Baranyi and Roberts model was observed, as the R2 value was greater than 0.90 for each storage temperature condition (Fig. 2), and standard deviation as ±0.15 on average.
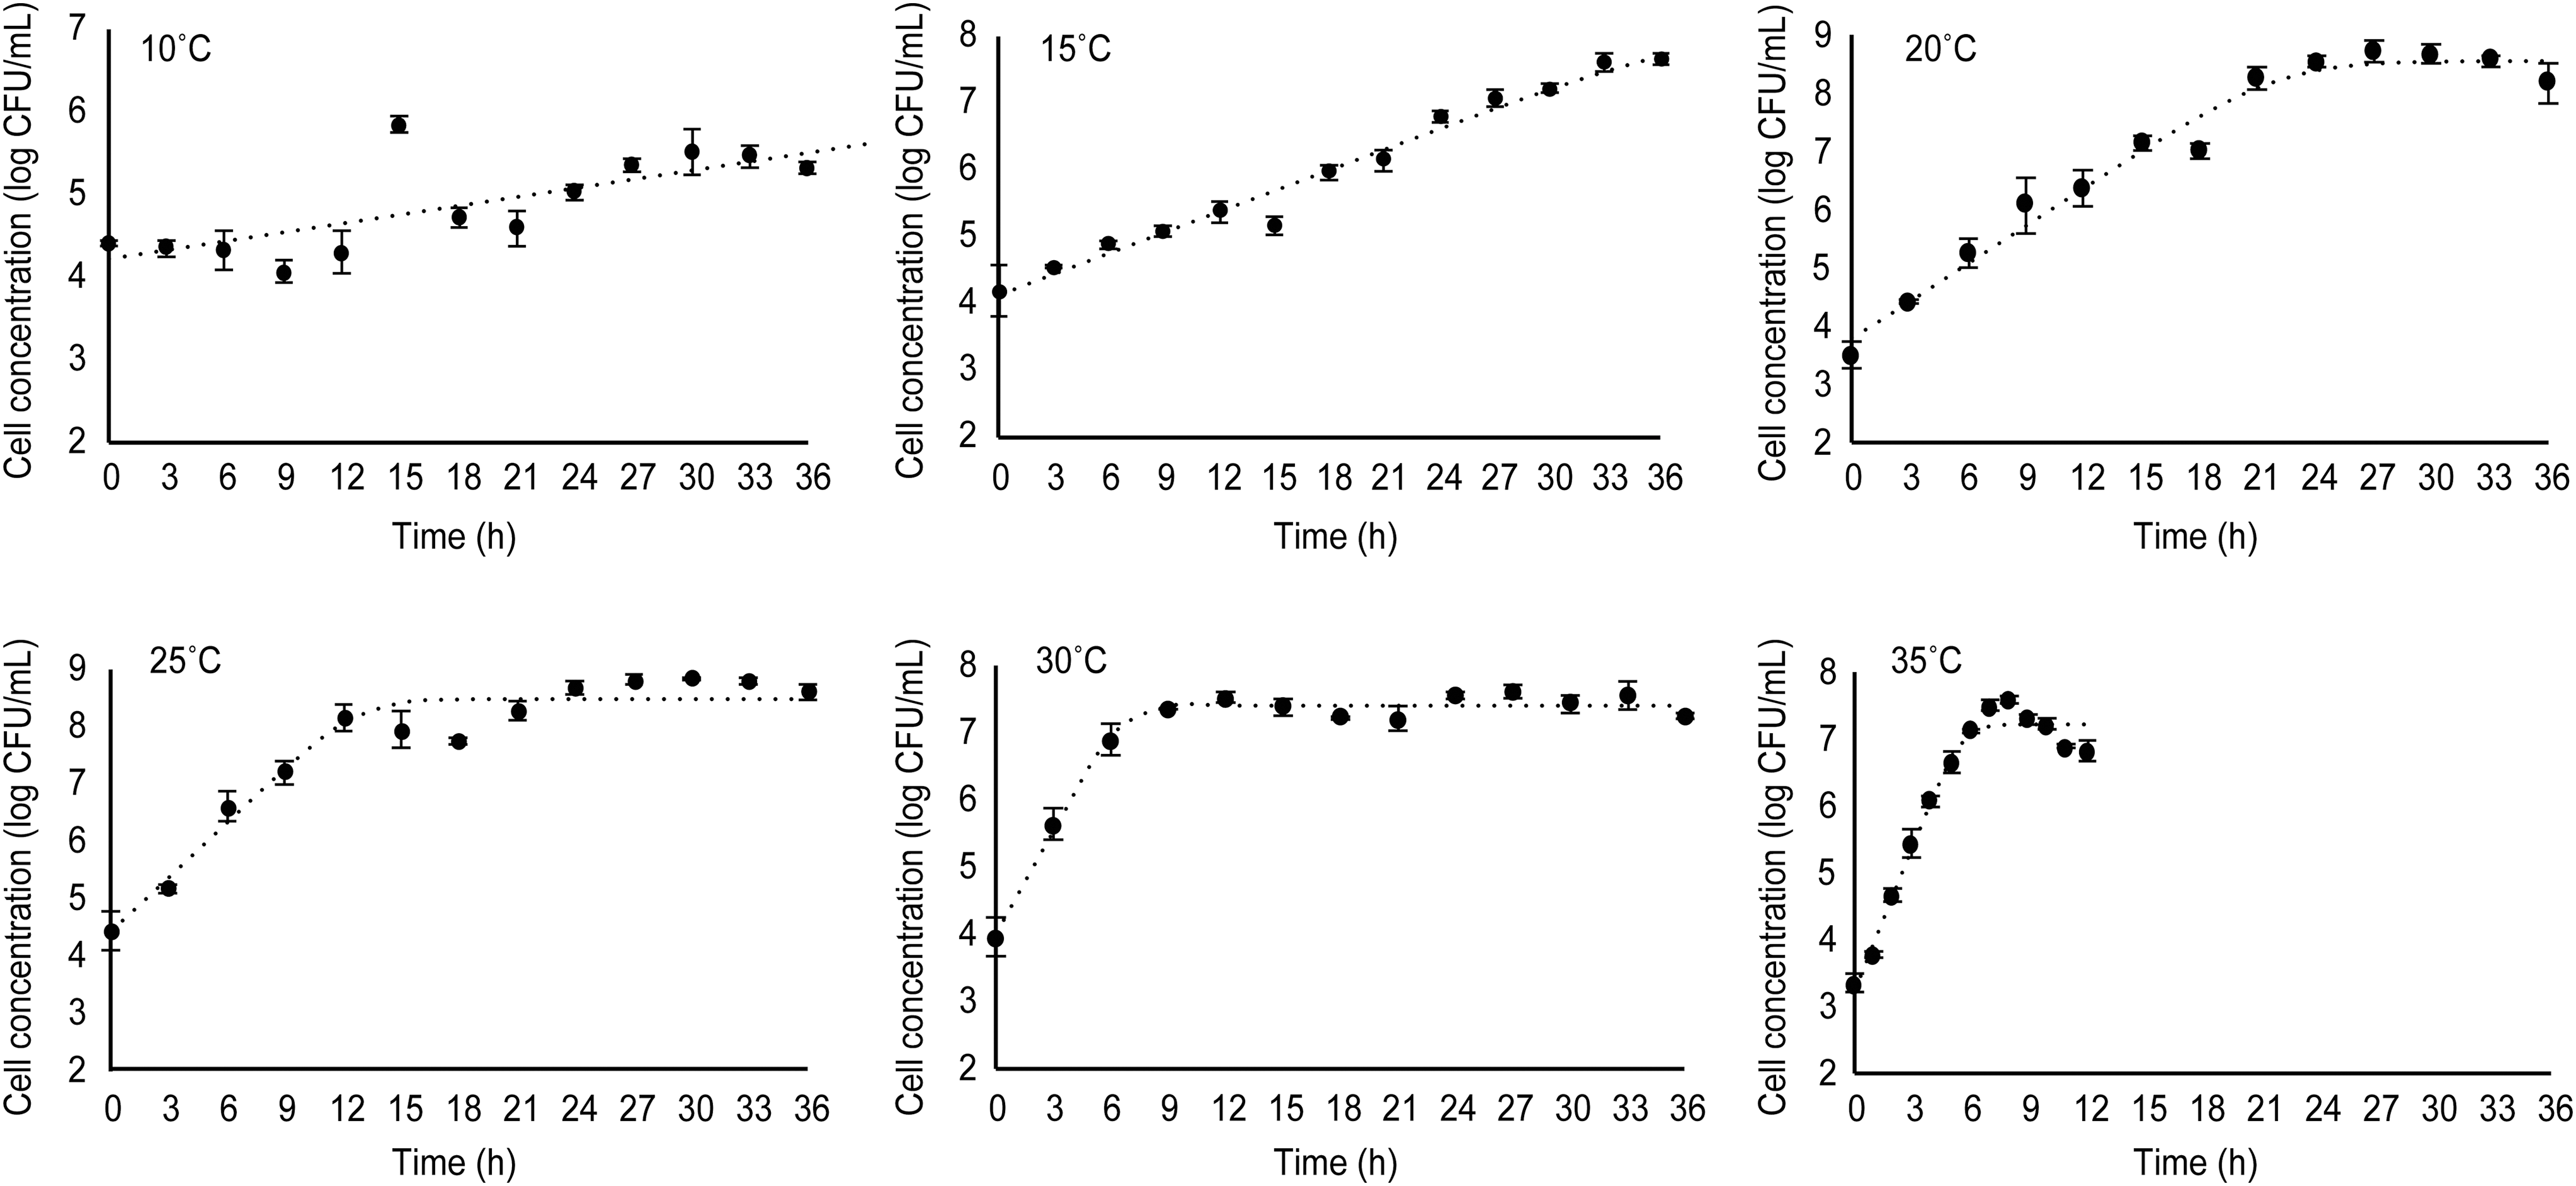
Growth curves of Salmonella Enteritidis in chicken juice samples as quantified by real-time PCR (scatter), with curve fitting calculated by the Baranyi and Roberts model (dotted line) at selected temperatures (n = 3).
Several parameters that were obtained from the Baranyi and Roberts model were used in Ratkowsky's square root model to predict Salmonella Enteritidis growth in chicken juice at the designated storage temperature (Fig. 3). The relationship between
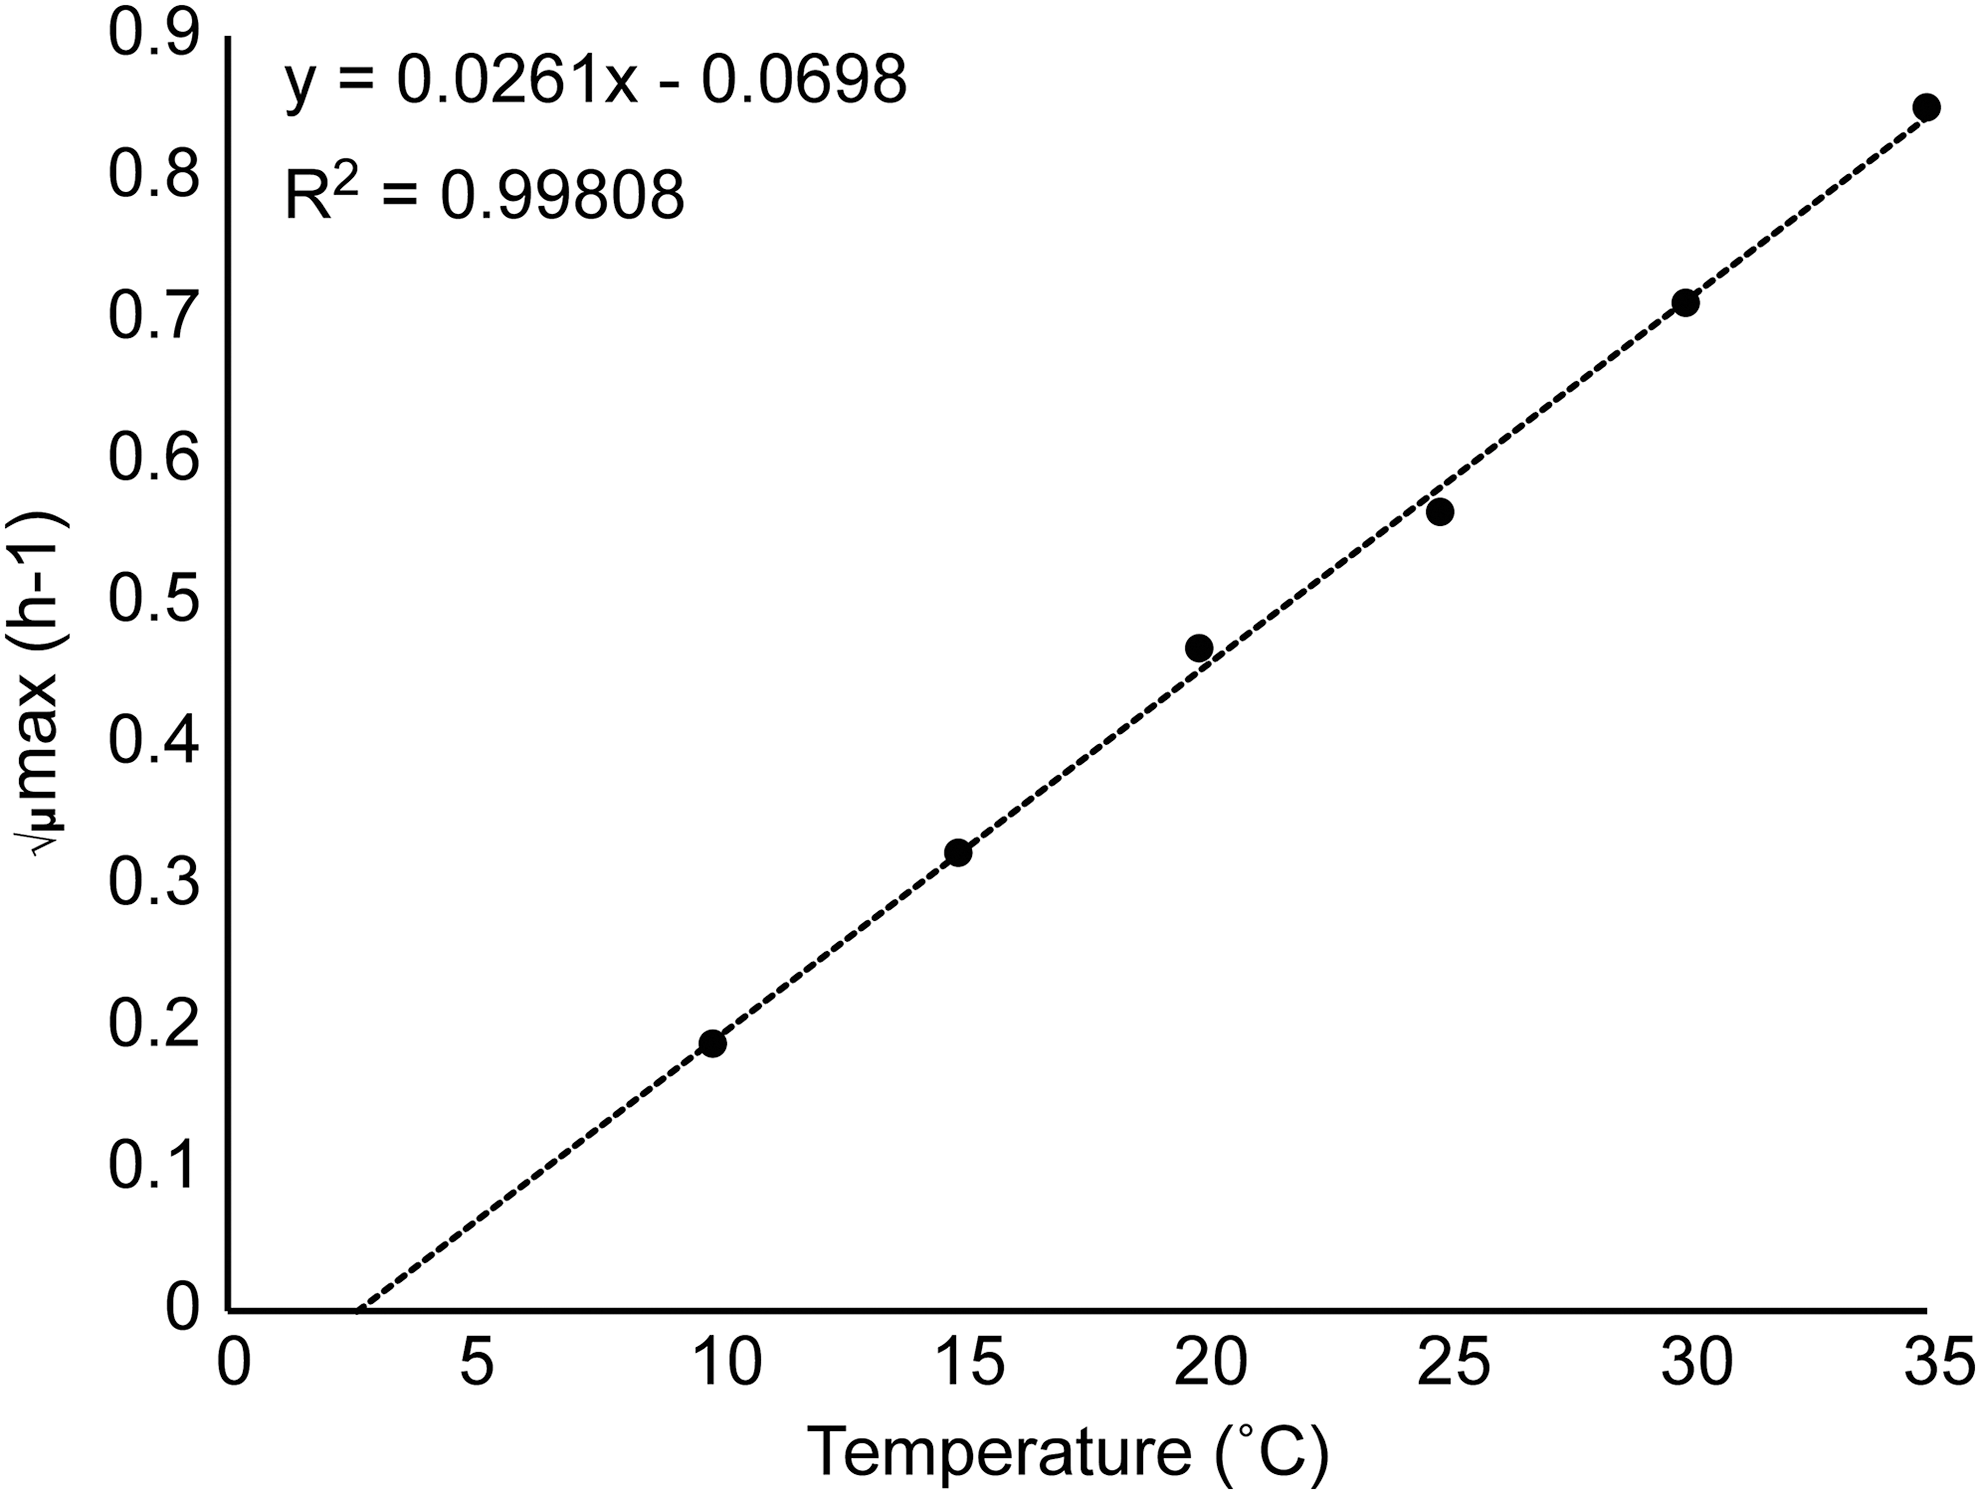
Relationship between the μmax value and storage temperature of Salmonella Enteritidis in chicken juice samples by the square root model. The dotted line represents the fit, which was calculated by the Ratkowsky's square root model.
Data comparison with MRV database and ComBase
To investigate data consistency, we compared the Salmonella Enteritidis μmax values from chicken juice samples with μmax values calculated by predictive tools of MRV and ComBase corresponding to chicken juice environment with an aw of 0.99 and a pH of 6.3. Overall μmax predictions based on real-time PCR were consistent with 485 and 259 Salmonella Enteritidis growth kinetic data from the database available in predictive tool of MRV and ComBase, respectively (Fig. 4). The predicted μmax values for Salmonella Enteritidis that were obtained by the developed model (Eq. 3) showed good agreement with the μmax values estimated from MRV and ComBase predictor. The goodness of fit of the developed model to MRV was demonstrated by a pRE of 1.00, an Af of 1.10, a Bf of 0.96, an RMSE of 0.09, and an R2 of 0.97. The μmax predicted by the ComBase predictor was demonstrated by a goodness of fit with a pRE of 0.67, an Af of 1.24, a Bf of 0.81, an RMSE of 0.34, and an R2 of 0.61.
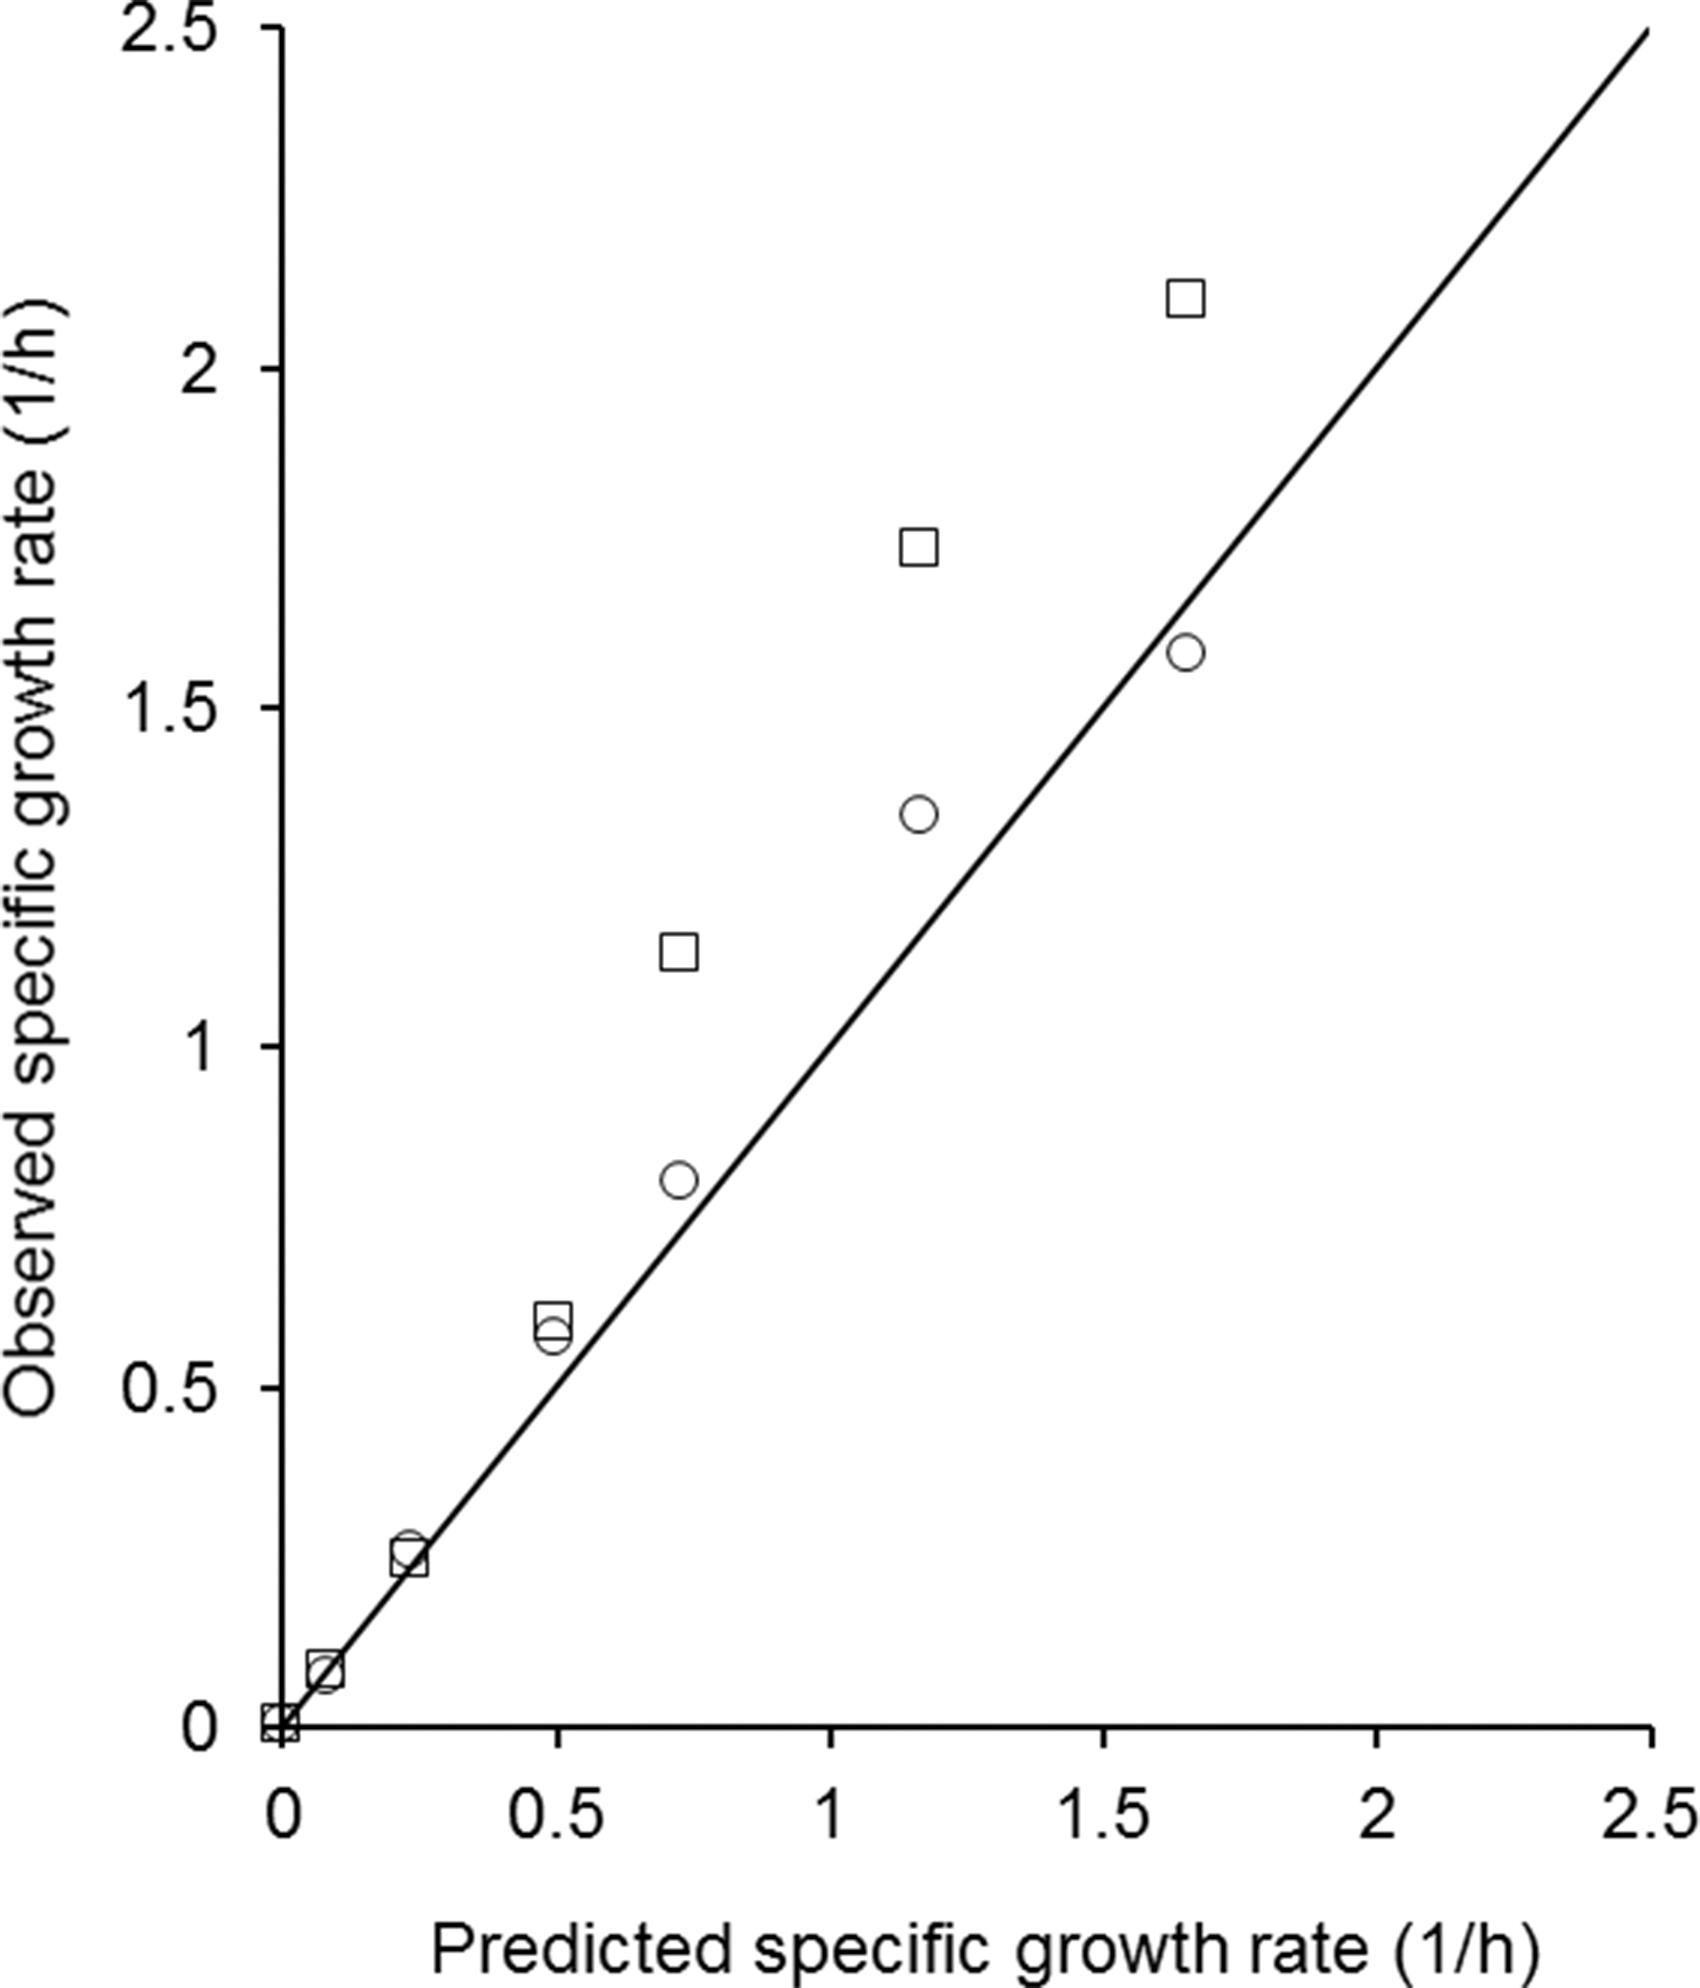
Comparison of μmax values from the actual study with those predicted by MRV database (○) and ComBase (□) for Salmonella Enteritidis grown at 10°C–35°C. The middle diagonal line represents the line of equivalence, where “Observed by real-time PCR” = “Predicted by MRV” and/or “Predicted by ComBase.” MRV, microbial responses viewer.
Growth of Salmonella Enteritidis in chicken juice under fluctuating temperature
The prediction of the Salmonella Enteritidis growth rate under fluctuating temperature was estimated by Baranyi and Roberts model using parameters that were previously calculated at a constant temperature. Changes in the number of Salmonella Enteritidis cells and numerical simulation based on the μmax temperature dependency as described in Eq. 3, under a cycled temperature between 5°C and 30°C are shown in Figure 5. The accuracy of predictive simulation was demonstrated by a pRE of 0.87 and an RMSE of 0.09. The real-time PCR-based prediction of bacterial number over time was successfully conducted with a valid accuracy.
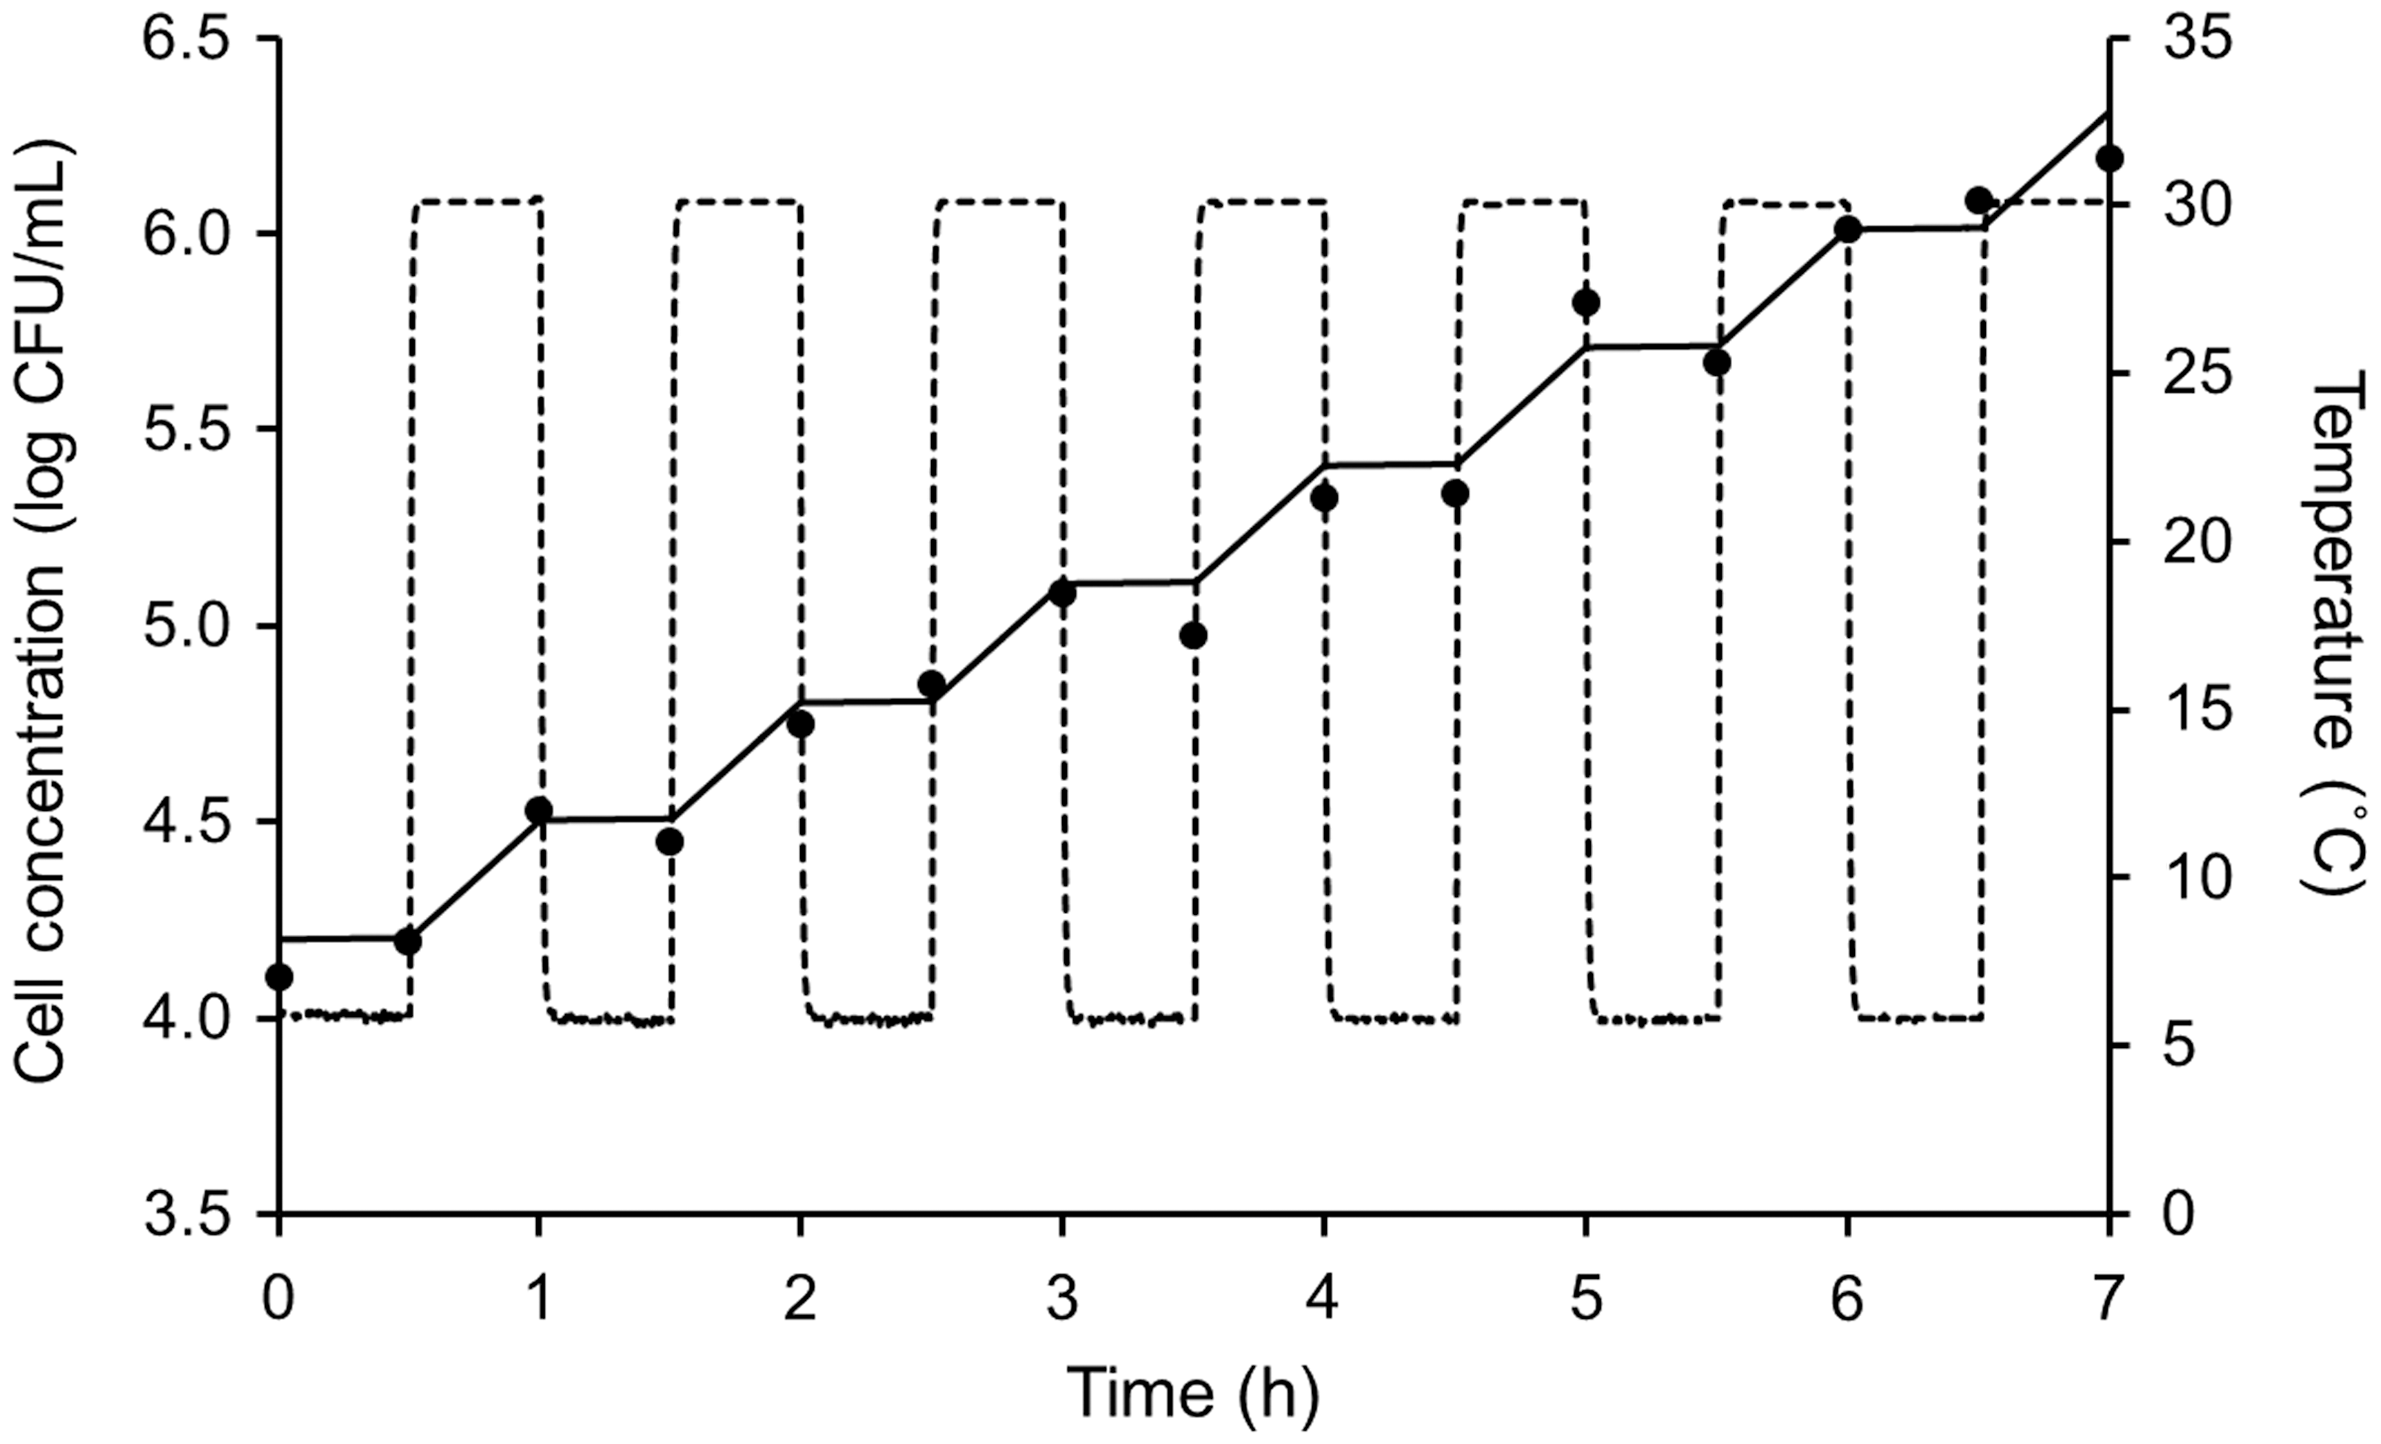
Experimental data of real-time PCR quantification (scatter), temperature (dotted line), and the predictions of the growth of Salmonella Enteritidis in chicken juice samples under fluctuating temperatures (from 5°C to 30°C) every 30 min (solid line).
Discussion
To obtain a precise growth prediction for industrial application, prediction models need to be developed using foodborne pathogens in real food materials (Juneja et al., 2007). This experiment was designed in the belief that inoculated Salmonella will grow by competing with background microbial flora, this is how any outbreak occurs from any food products if present. However, food materials that contain naturally occurring background microflora can lead to a discrepancy in the prediction model related to enumeration accuracy and efficiency using traditional culture methods by a nonselective medium. Whereas, a selective medium has the possibility to underestimate bacterial enumeration since injured bacteria cannot form colonies on selective media (Kang and Sivagusa, 1999). To solve these problems and to get accurate determination of target bacteria, the real-time PCR-based methods described in this study is superior to any other methods in real food systems.
Chicken juice was selected in this study because it has been used as a model for microbial risk assessment, it resembles the environment that microbial pathogens experience on raw poultry products (Birk et al., 2004). The amount of naturally occurring background microflora in the chicken juice sample used in this study was 104 CFU/mL, which is equal to the amount of target bacteria inoculated in the sample. However, the presence of naturally occurring background microbial flora in chicken juice sample did not inhibit quantification because real-time PCR targeting on a specific gene. Real-time PCR showed greater ability, specificity, and accuracy to quantify target bacteria, as described in many research reports (Kimura et al., 2001; Reichert-Schwillinsky et al., 2009; Kawasaki et al., 2010; Lungu et al., 2012).
Growth parameter from constant temperature study, such as specific growth rate (μmax), was fitted to Baranyi and Roberts model using DMFit software. All growth data from this experiment showed goodness fitting with the prediction from the models, indicating that the model reflected Salmonella Enteritidis growth in chicken juice by real-time PCR quantification. High correlation between μmax and the temperature of storage was obtained by this method, with an R2 value as 0.998 (Fig. 3). In a previous study, Mitchell et al. (1995) described Salmonella growth at low temperature having a lack of viability since it could not be enumerated in PCA (Plate Count Agar) because injured Salmonella cannot form colonies after stress exposure at a low temperature. Similarly, Costa et al. (2016) conducted study for predictive modeling, but the prediction results were not satisfactory when the temperature was near minimum temperature required for microorganism growth. None of the modified models was able to accurately predict bacterial growth when temperature range was near refrigerator temperature. The results showed that real-time PCR method is able to avoid error that may occur during plate counting, which was a problem in previous studies.
The validity of the results from this study was evaluated by a comparison with existing predictive tools, such as MRV and ComBase predictor (Koseki, 2009). The μmax model developed in the present study showed an acceptable good agreement with the MRV prediction, with the prediction based on the real-time PCR procedure presenting an overall valid estimation. Some studies reported that the use of real-time PCR is hampered by the inability to distinguish DNA signals originating from live or dead cells, which introduces risk of false-positive results that leads to overquantification (Ross, 1996; Wolffs et al., 2005; Soejima et al., 2008). However, the results of this study showed goodness of fit between real-time PCR quantification data with Baranyi and Roberts model, Ratkowsky's square root model, while also reflecting the previous data from MRV and ComBase.
The growth prediction model in a food sample with naturally occurring background microflora developed in this study is useful for the further development of growth prediction studies. The advantage of real-time PCR is its ability to measure the number of target genes in a large number of samples, and it is extremely easy to use for the analysis of bacterial growth prediction study. The result of this study showed high quantification accuracy of real-time PCR method to collect growth data of target bacteria and to estimate growth kinetics of Salmonella Enteritidis in chicken juice samples with high background microbial flora under constant and fluctuating temperature conditions.
Footnotes
Acknowledgments
This study was conducted under the Project of Food Safety, supported by a grant from the Ministry of Agriculture, Forestry, and Fisheries (MAFF), Japan. Fia Noviyanti was funded by the Otsuka Toshimi Scholarship Foundation.
Disclosure Statement
No competing financial interests exist.