
Abstract
3-Phenyllactic acid (PLA) was reported to have an effective antimicrobial activity. This study evaluated the antimicrobial activity of PLA against foodborne Enterococcus faecalis and its effect on cell membrane. The minimum concentration of PLA to inactivate E. faecalis in brain heart infusion broth was 5 mg/mL. PLA solutions of 5 and 10 mg/mL can inactivate E. faecalis population ≥6 log CFU/mL within 60 and 30 min, respectively. The cell membranes of most E. faecalis cells were damaged after PLA treatment according to the images of scanning electron microscopy and transmission electron microscopy. The differences in the regions of cell membrane protein, fatty acid, and polysaccharide were revealed by Fourier transform infrared spectroscopy, which further indicated cell membrane damages. The cell membrane permeability was increased when the concentration of PLA treatment was increased in the membrane permeability assays. Finally, almost all bacterial cells were damaged after treatment with 10 mg/mL PLA for 30 min, further confirmed by flow cytometry analysis. This study concluded that PLA is effective in inactivating E. faecalis cells through the leakage of intracellular components caused by cell membrane damage.
Introduction
E
3-Phenyllactic acid (2-hydroxy-3-phenylpropanoic acid, or β-phenyllactic acid, PLA) is an organic acid that was first purified from Geotrichumcandidum (Dieuleveux et al., 1998). PLA has a broad-spectrum antimicrobial activity to many bacteria, including Listeria monocytogenes, Staphylococcus aureus, Bacillus cereus, Salmonella enterica, and Escherichia coli, and yeasts and molds (Lavermicocca et al., 2003; Schwenninger et al., 2008; Mu et al., 2012). PLA can also be produced by many lactic acid bacterial species (Mu et al., 2012). Thus, PLA can be considered a rational antibacterial substance to control the contamination of food spoilage bacteria. Although cell membranes were the first target for PLA to inactivate the bacteria, their damaged degrees were different due to the difference of target cell membrane (Ning et al., 2017; Liu et al., 2018). Here, the efficacy of PLA to inactivate enterococci was evaluated in this study using Enterococcus faecalis strain R612Z1 as the target strain, and its effect on cell membrane integrity was analyzed by studying the damages of cell morphology and cell membrane potentials and releasing of intracellular compounds.
Materials and Methods
Bacterial strain and cultivation
E. faecalis R612Z1 was isolated from water-boiled salted duck (Liu et al., 2013). The pure culture was grown in brain heart infusion (BHI; Beijing Land Bridge Tech. Co., Beijing, China) at 37°C for about 18 h and used for the following studies.
Minimum inhibitory concentrations
The E. faecalis culture was incubated in the BHI broth to exponential phase at 37°C for about 6 h. Afterward, the mentioned culture of 125 μL was transferred into each well of a 96-well microliter plate. The BHI broth containing 125 μL PLA (≥98%; Sigma, St. Louis, MO) was added to each well to obtain the final concentrations of 1.25, 2.5, 5, and 10 mg/mL in E. faecalis culture. The bacteria were further cultured at 37°C, and cell growth was monitored at 600 nm using a multimode plate reader (Infinite™ M200 PRO; Tecan, M€annedorf, Switzerland). The minimum inhibitory concentration (MIC) of PLA for E. faecalis R612Z1 was determined as the lowest concentration in which no growth occurred.
Effect on viability assay
PLA solutions (1.25, 2.5, 5, and 10 mg/mL) were prepared in deionized H2O for the next experiments, and filter-sterilized using 0.22 μm pore size membrane filters.
The bacterial cells were cultured in 50 mL BHI broth at 37°C for about 6 h and collected by centrifugation for 10 min (6000 × g; 4°C). This cell pellet was washed with 0.01 M phosphate buffered saline (PBS) and resuspended in different PLA solutions of 50 mL (1.25, 2.5, 5, and 10 mg/mL) with shaking (100 rpm; 25°C), respectively. The bacterial suspension of 1.0 mL was taken out and mixed with 9.0 mL of 0.1 M PBS to neutralize pH at different detection times (0, 10, 30, 60, 120, and 180 min), respectively. These solutions were diluted serially (1:10) in 0.01 M PBS. The number of bacteria in each tube was got by BHI plate counting.
Cell morphology study
Scanning electron microscopy and transmission electron microscopy analyses
The cell morphological changes of E. faecalis control and 10 mg/mL PLA-treated cells were observed by scanning electron microscopy (SEM) and transmission electron microscopy (TEM) analyses according to previous articles (Liu et al., 2015, 2018). E. faecalis cells were cultured in 20 mL BHI broth at 37°C to exponential phase and harvested by centrifugation (6000 × g, 10 min). The bacterial precipitation was mixed with 10 mL of 0.01 M PBS and divided into two tubes. One tube was treated with 10 mg/mL PLA for 30 min at room temperature, and the other was control sample. The mentioned treated and control cells were separately harvested by centrifugation for 10 min at 6000 × g, washed twice with 0.1 M phosphate buffer, and then fixed with glutaraldehyde (2.5%, v/v) at 4°C for about 18 h and dehydrated in different alcohol solutions. The fixed samples were determined by SEM (EVO-LS10; Zeiss, Germany) and TEM (H-7650; Hitachi, Japan) at an operating voltage of 20 and 80 kV, respectively.
Fourier transform infrared spectroscopy
The exponential E. faecalis cells of 100 mL were prepared and treated with PLA as described earlier. After treatment, all the mentioned cells were collected by centrifugation and resuspended in 100 μL of 0.1 M PBS. These cell solutions of 15 μL were placed in a ZnSe window and stove dried (15 min, 50°C). The Fourier transform infrared (FT-IR) spectra were obtained using Cary 600 Series FT-IR spectrometer with an attenuated total reflectance system (Agilent Technologies) from 4000 to 700 cm−1 with an interval of 1 cm−1. The measuring solution was 4 cm−1. The final spectra were achieved averaging 32 scans.
Membrane permeability assay
Confocal laser scanning microscopy and flow cytometry analysis
The exponential E. faecalis cells were prepared as described earlier and divided into different parts. Each part was treated with 1.25, 2.5, 5, and 10 mg/mL PLA for 30 min, respectively. These bacterial cells were harvested by centrifugation (6000 × g, 10 min) and resuspended in 0.01 M PBS. The probes of 5(6)-carboxyfluorescein diacetate (cFDA; 100 μM) and propidium iodide (PI; 30 μM) were added to the mentioned different bacterial suspensions. The probe-treated cells were incubated for 15 min at room temperature in the dark and washed twice with 0.01 M PBS buffer. The confocal laser scanning microscopy (CLSM) images were got using laser light at 488 nm and an Ultra ViewVoX spinning disk confocal microscope (Perkin Elmer, Waltham, MA). Flow cytometry (FCM) analysis was conducted using an Accuri A6 flow cytometer (Becton, Dickinson and Company, NJ) according to our pervious articles (Liu et al., 2018; Sun et al., 2018).
Measurement of extracellular Adenosine triphosphate and ultraviolet-absorbing compounds
The exponential E. faecalis cells were prepared and treated with PLA as described earlier. The bacterial suspension of 1.0 mL was taken out and mixed with 9.0 mL of 0.1 M PBS at different detection times (0, 10, 30, 60, 120, and 180 min). The supernatant fluids of cell suspensions were used to detect the contents of ATP and UV-absorbing compounds. An ATP detection kit (Beyotime, China) was used to detect the extracellular ATP levels. The luminescence value was obtained using Infinite 200 PRO microplate reader (Tecan). The UV-absorbing compounds were determined according to changes in OD260 values, which were detected using an UV-VIS spectrophotometer (Mapada, Shanghai, China).
Depolarization of cell membrane potential
The membrane potential of E. faecalis cells was investigated using a fluorescence probe, DiSC3(5) (3,3′-dipropylthiadicarbocyanineiodide; Huang and Yousef, 2014). The bacterial cells at exponential phase were prepared as mentioned. The cells were suspended in the buffer containing 5 mM HEPES and 5 mM glucose. The DiSC3(5) probe (0.4 μM) and 100 mM KCl were added. The cell suspensions (50 μL each) were added to the black NBS microplate, and PLA solutions (50 μL each) were added to different detected concentrations (1.25, 2.5, 5, and 10 mg/mL). The fluorescence was measured at excitation and emission wavelengths of 622 and 670 nm using Infinite 200 PRO microplate reader.
Statistical analysis
All experiments were conducted in triplicate, and averages of results are reported. Data were analyzed for analysis of variance (ANOVA) using SPSS software (version19.0; IBM-SPSS, Inc., Armonk, NY) to determine least significant differences (p < 0.05).
Results
MIC of PLA and bacterial inactivation
The inhibitory effect of PLA at the selected concentrations was investigated by growth curve analysis (Fig. 1). E. faecalis growth in BHI broth was completely inhibited after 12 h by 5 mg/mL PLA, whereas it was only slightly inhibited by 2.5 mg/mL PLA (Fig. 1A). Thus, the MIC of PLA against the growth of E. faecalis R612-Z-1 in BHI broth was 5 mg/mL.
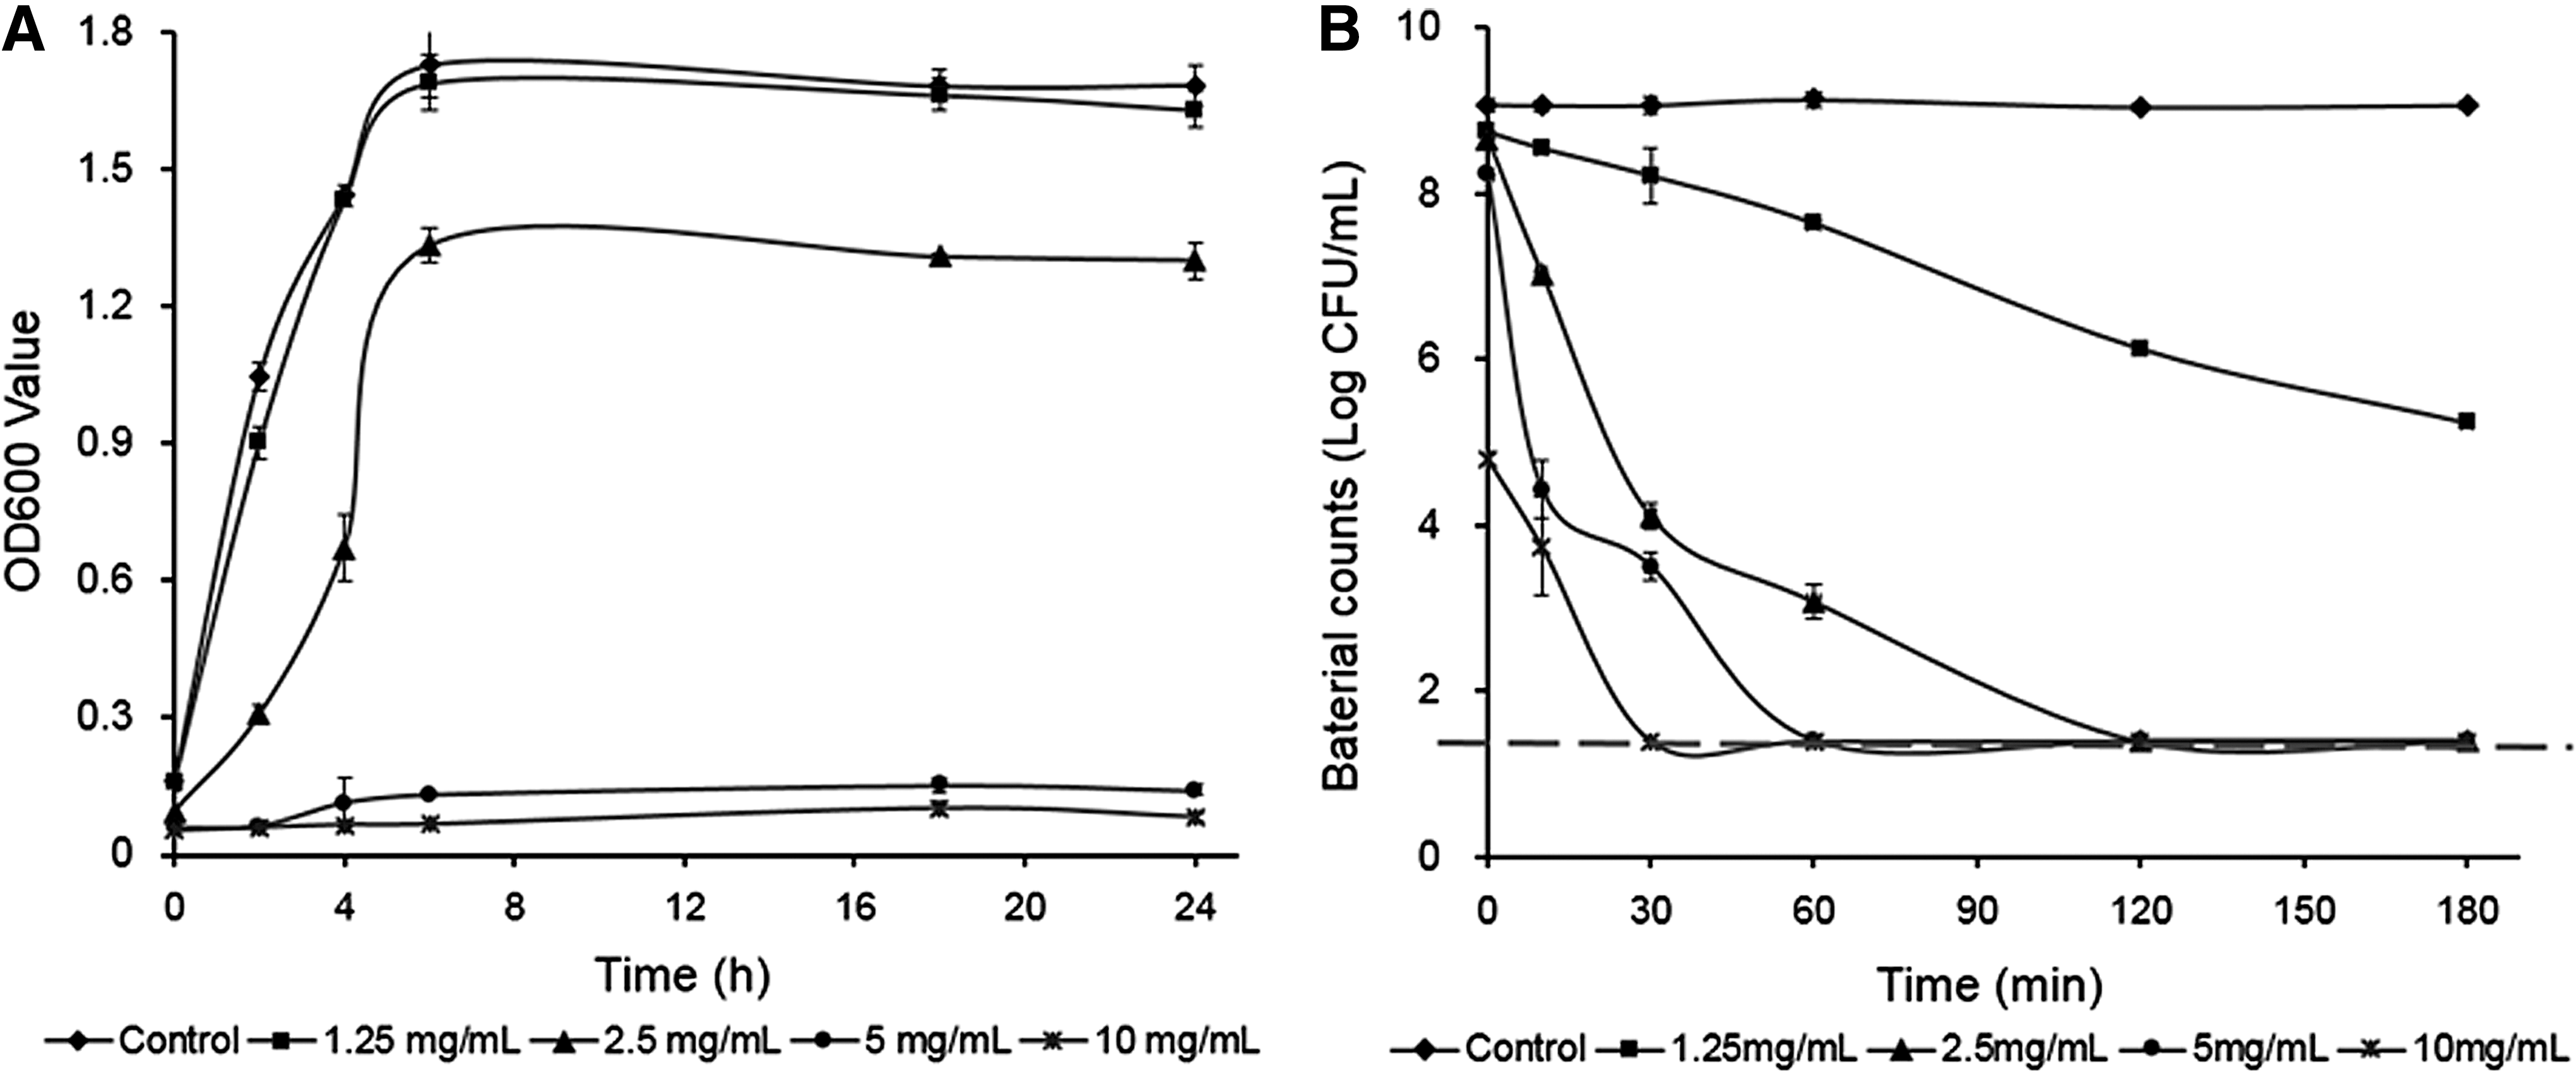
Growth inhibition of Enterococcus faecalis in BHI broth with PLA
The results of E. faecalis inactivation in PLA solutions are shown in Figure 1B. PLA solutions of 2.5, 5, and 10 mg/mL can inactivate ∼6 log CFU/mL of E. faecalis within 120, 60, and 30 min, respectively, whereas PLA of 1.25 mg/mL cannot inactivate the same bacterial population even up to 180 min.
Changes of E. faecalis cell morphology
SEM and TEM analyses
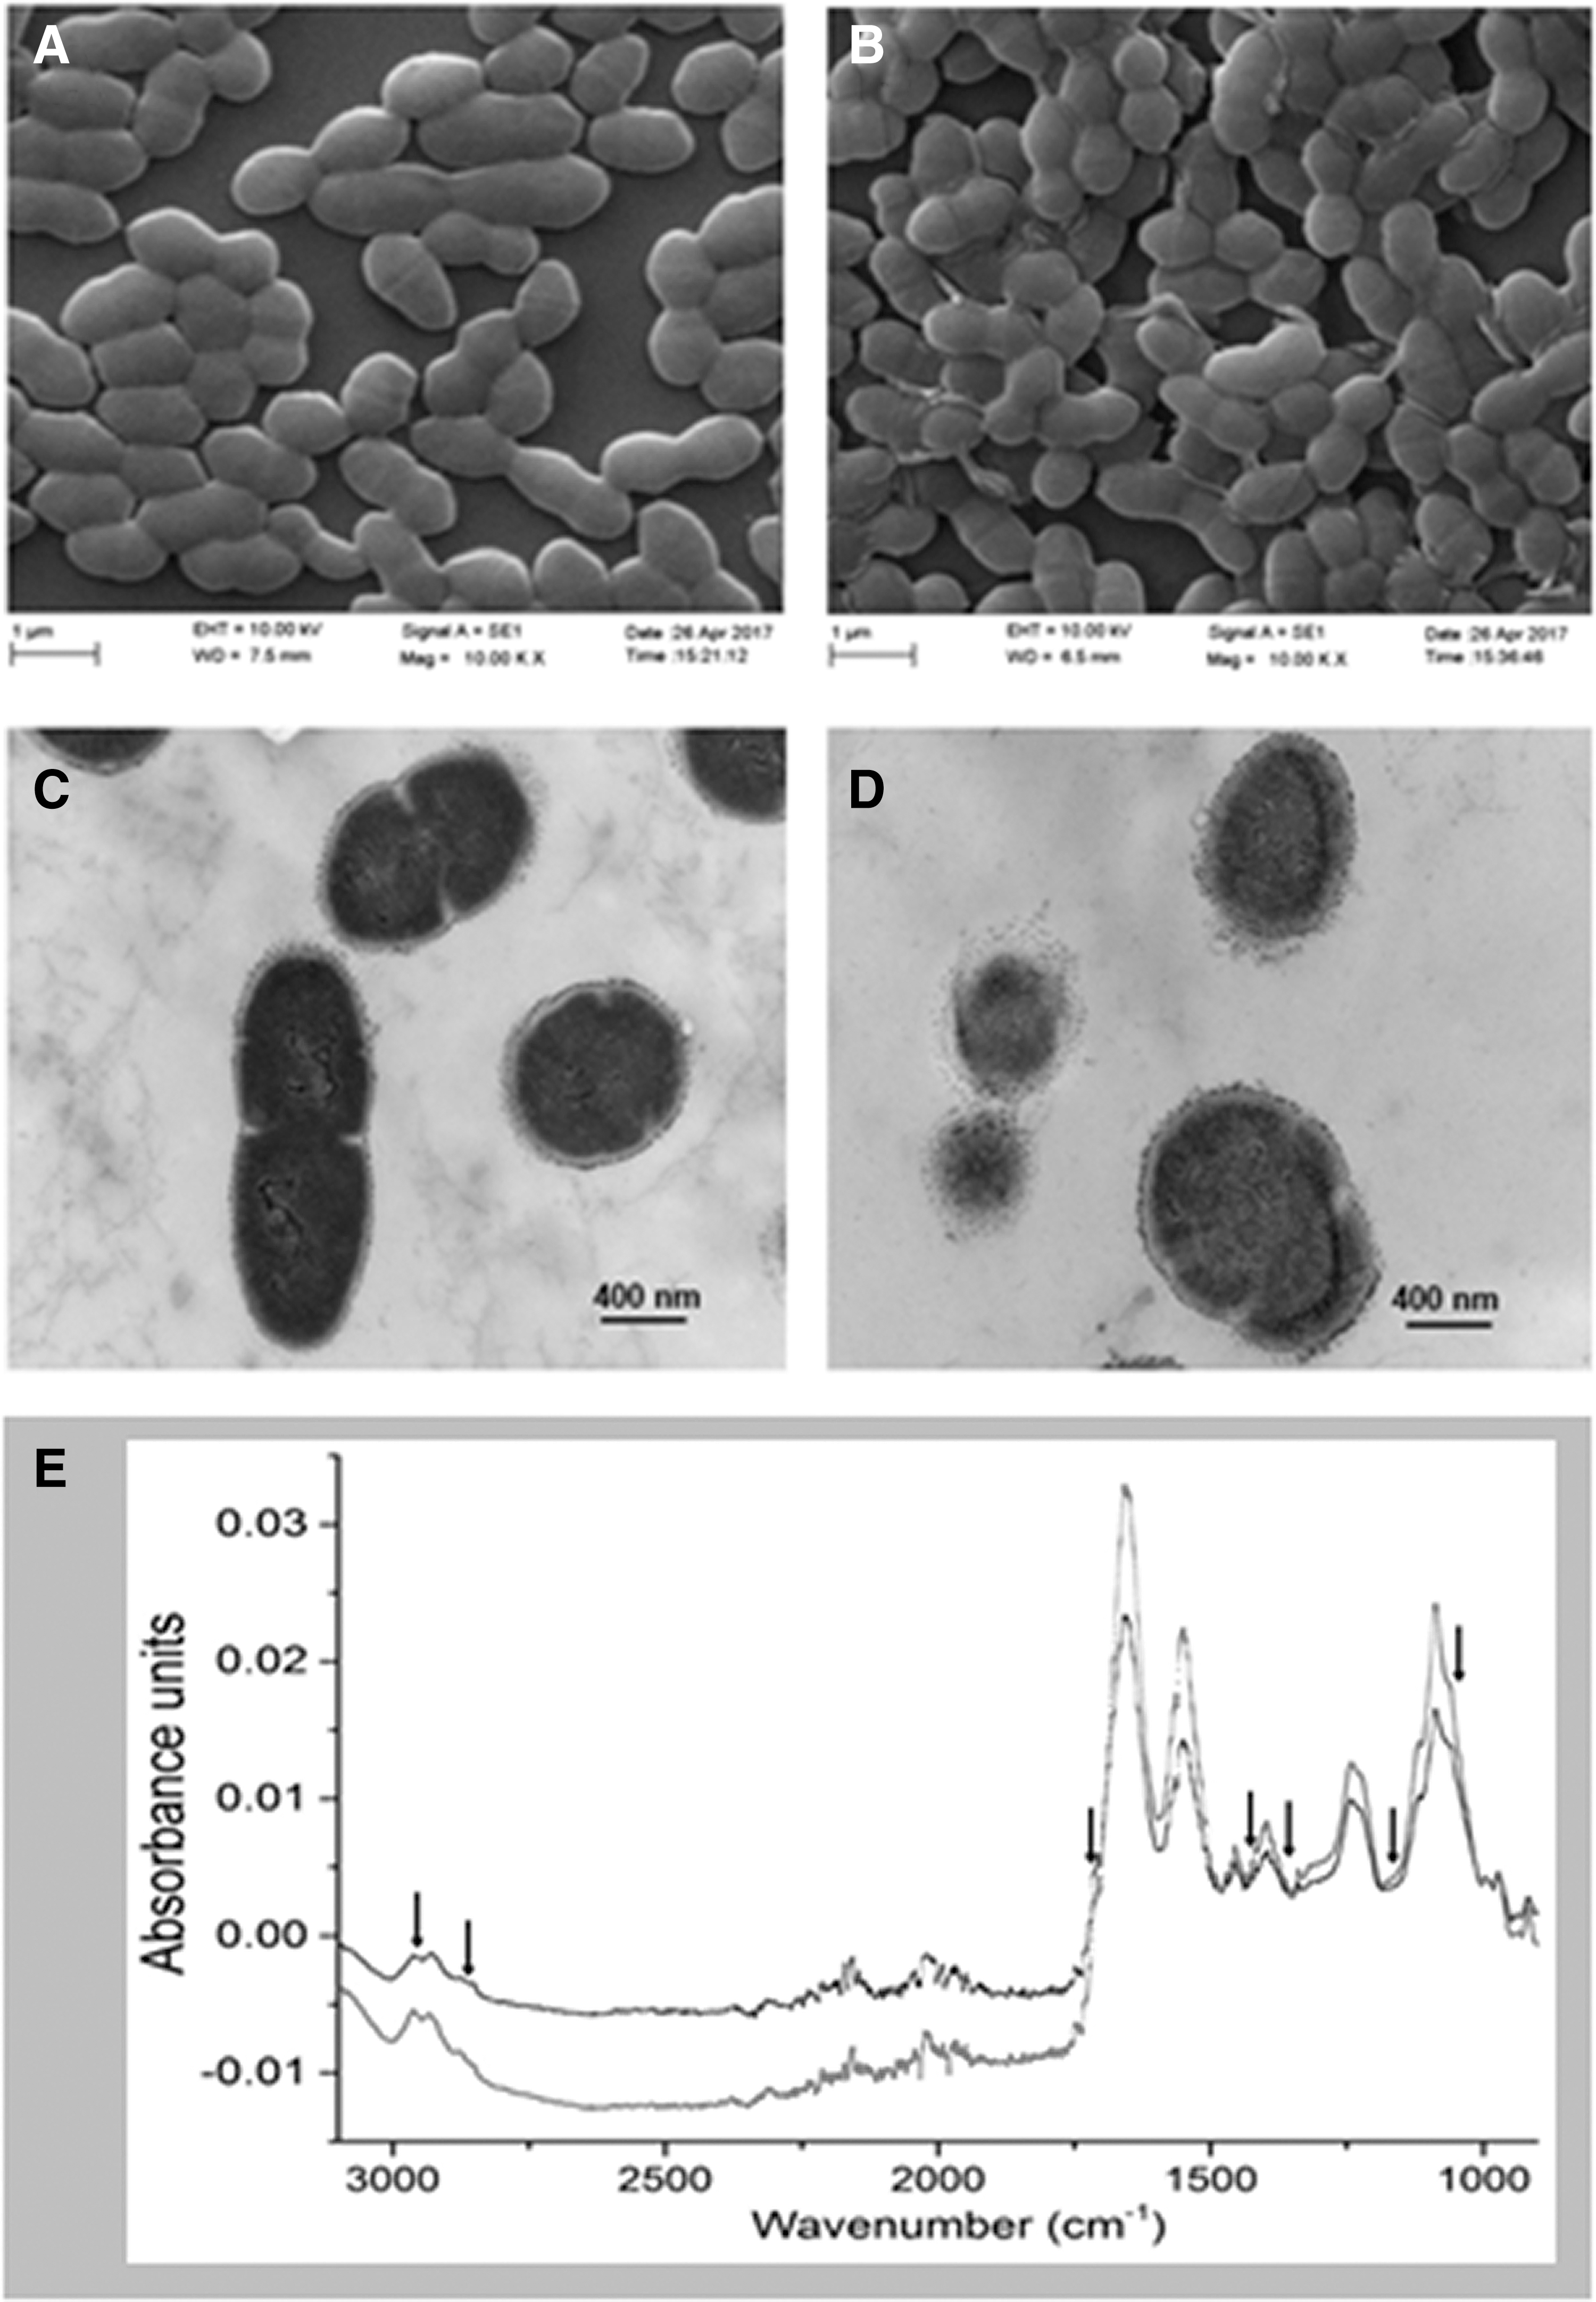
SEM and TEM were used to examine the changes in cell morphology and intracellular components after PLA treatment. The untreated E. faecalis displayed intact cell membrane and regular plump round-shaped morphology (Fig. 2A, C). After 1% PLA treatment, cell surfaces were damaged (Fig. 2B, D) and intracellular structures became disproportionate (Fig. 2D).
SEM
FT-IR analysis
FT-IR spectra for most bacteria can be divided into different distinguishable regions according to the previous articles (Tessema et al., 2009; Booyens and Thantsha, 2014; Nyarko and Donnelly, 2015). The FT-IR spectra collected for PLA-treated cells were visually different from those of intact cells (Fig. 2E). The band area corresponding to the main regions of proteins (1800–1500 cm−1) and polysaccharides (1200–900 cm−1) was decreased, whereas that corresponding to the regions of fatty acids (3000–2800 cm−1) was increased compared with control samples. Some peaks at the arrow positions were found to be shifted (Fig. 2E), which indicted that the membrane components of protein and polysaccharides were changed because of cell damages caused by PLA treatment.
Changes in E. faecalis cell membrane permeability
CLSM analysis
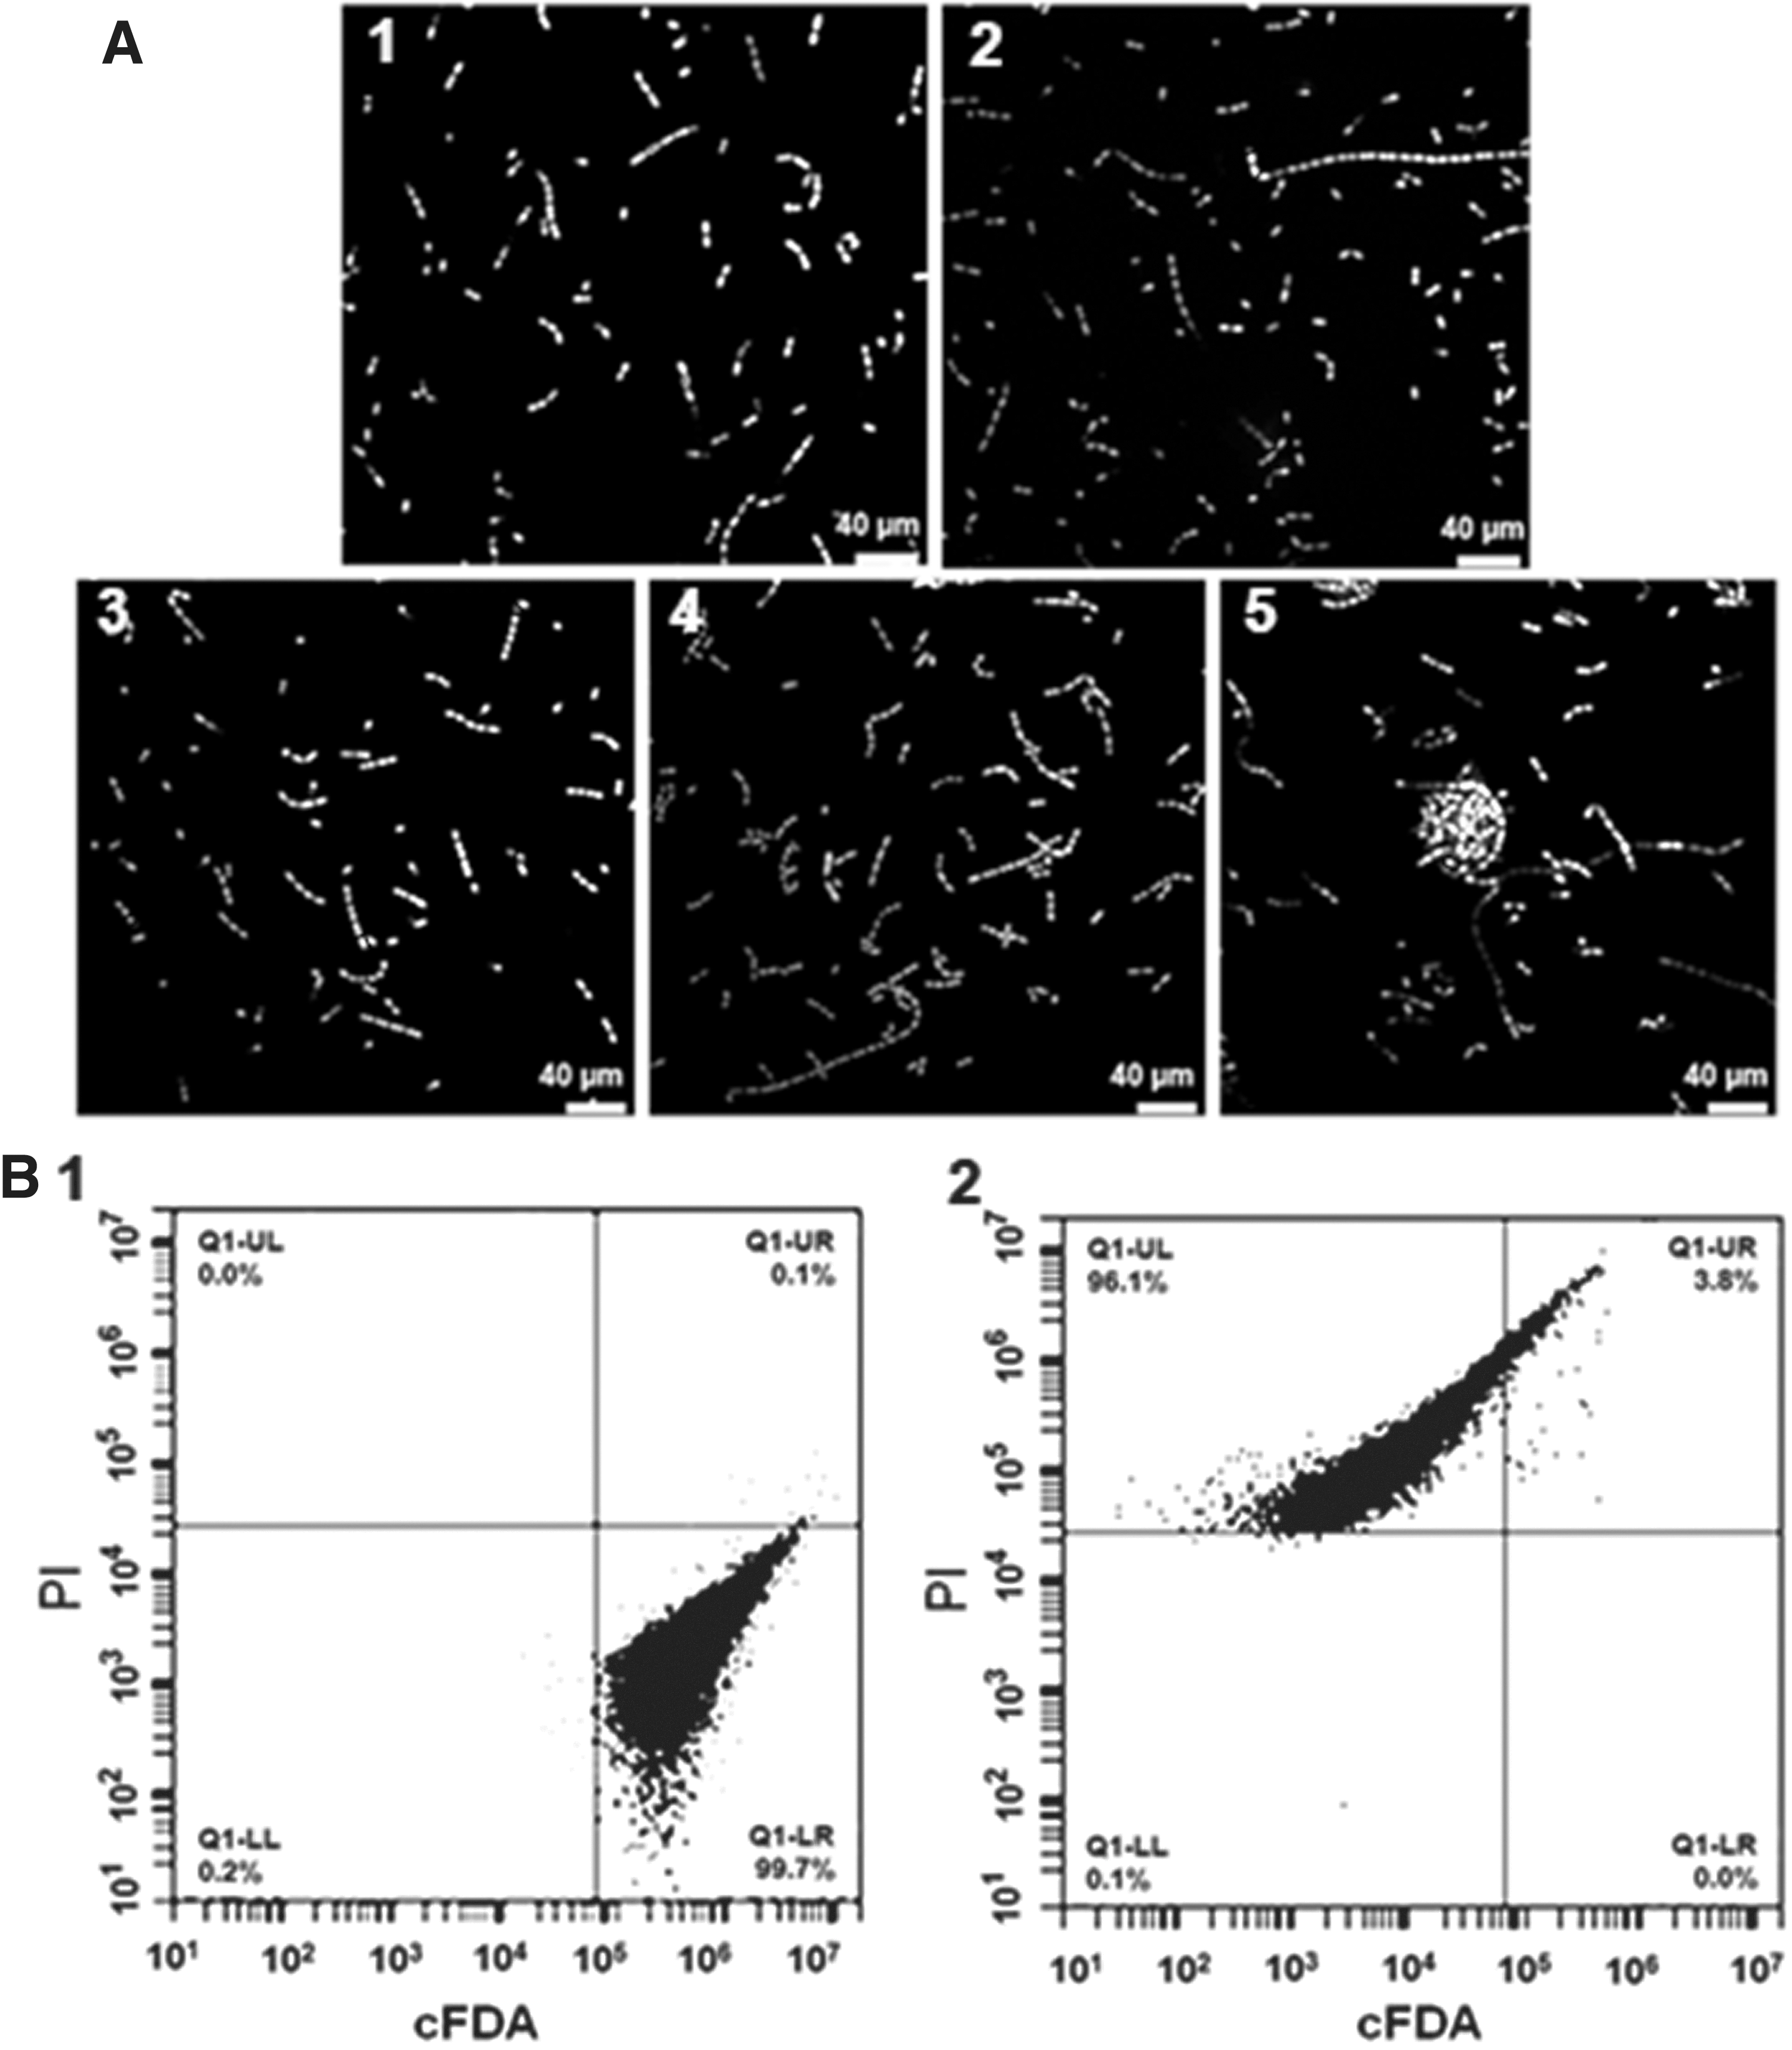
The changes in cell membrane permeability were observed using two fluorescent nucleic acid stains of cFDA and PI. Untreated E. faecalis were stained bright green (Fig. 3A1). The E. faecalis cells treated with 1.25 mg/mL PCA were stained dark green, which indicated that although cell membranes were slightly damaged, the cells still had cellular esterase activity (Fig. 3A2). By contrast, the E. faecalis cells treated with 2.5, 5, and 10 mg/mL PLA were mostly stained red (Fig. 3A3–A5). Most of the bacterial cells treated with 10 mg/mL PLA were seriously damaged and became attached to each other (Fig. 3A5).
CLSM
FCM analysis
The cell physiological status and integrity of E. faecalis cells treated with PLA were further studied by FCM analysis. Dual-parameter dot plots of E. faecalis cells stained with cFDA and PI are shown in Figure 3B. Results show that 99.7% of untreated E. faecalis cells were located in the Q1–LR quadrant (Fig. 3B1), which indicates that these cells had intact membranes and high esterase activity. The percentage values of sublethal and dead cells distributed in the Q1–UR and Q1–UL quadrants were 3.8% and 96.1% after treatment with 10 mg/mL PLA for 30 min, respectively, and no intact cells existed (Fig. 3B2). The results reveal that these PLA-treated E. faecalis cell membranes were almost completely damaged.
Changes in extracellular ATP
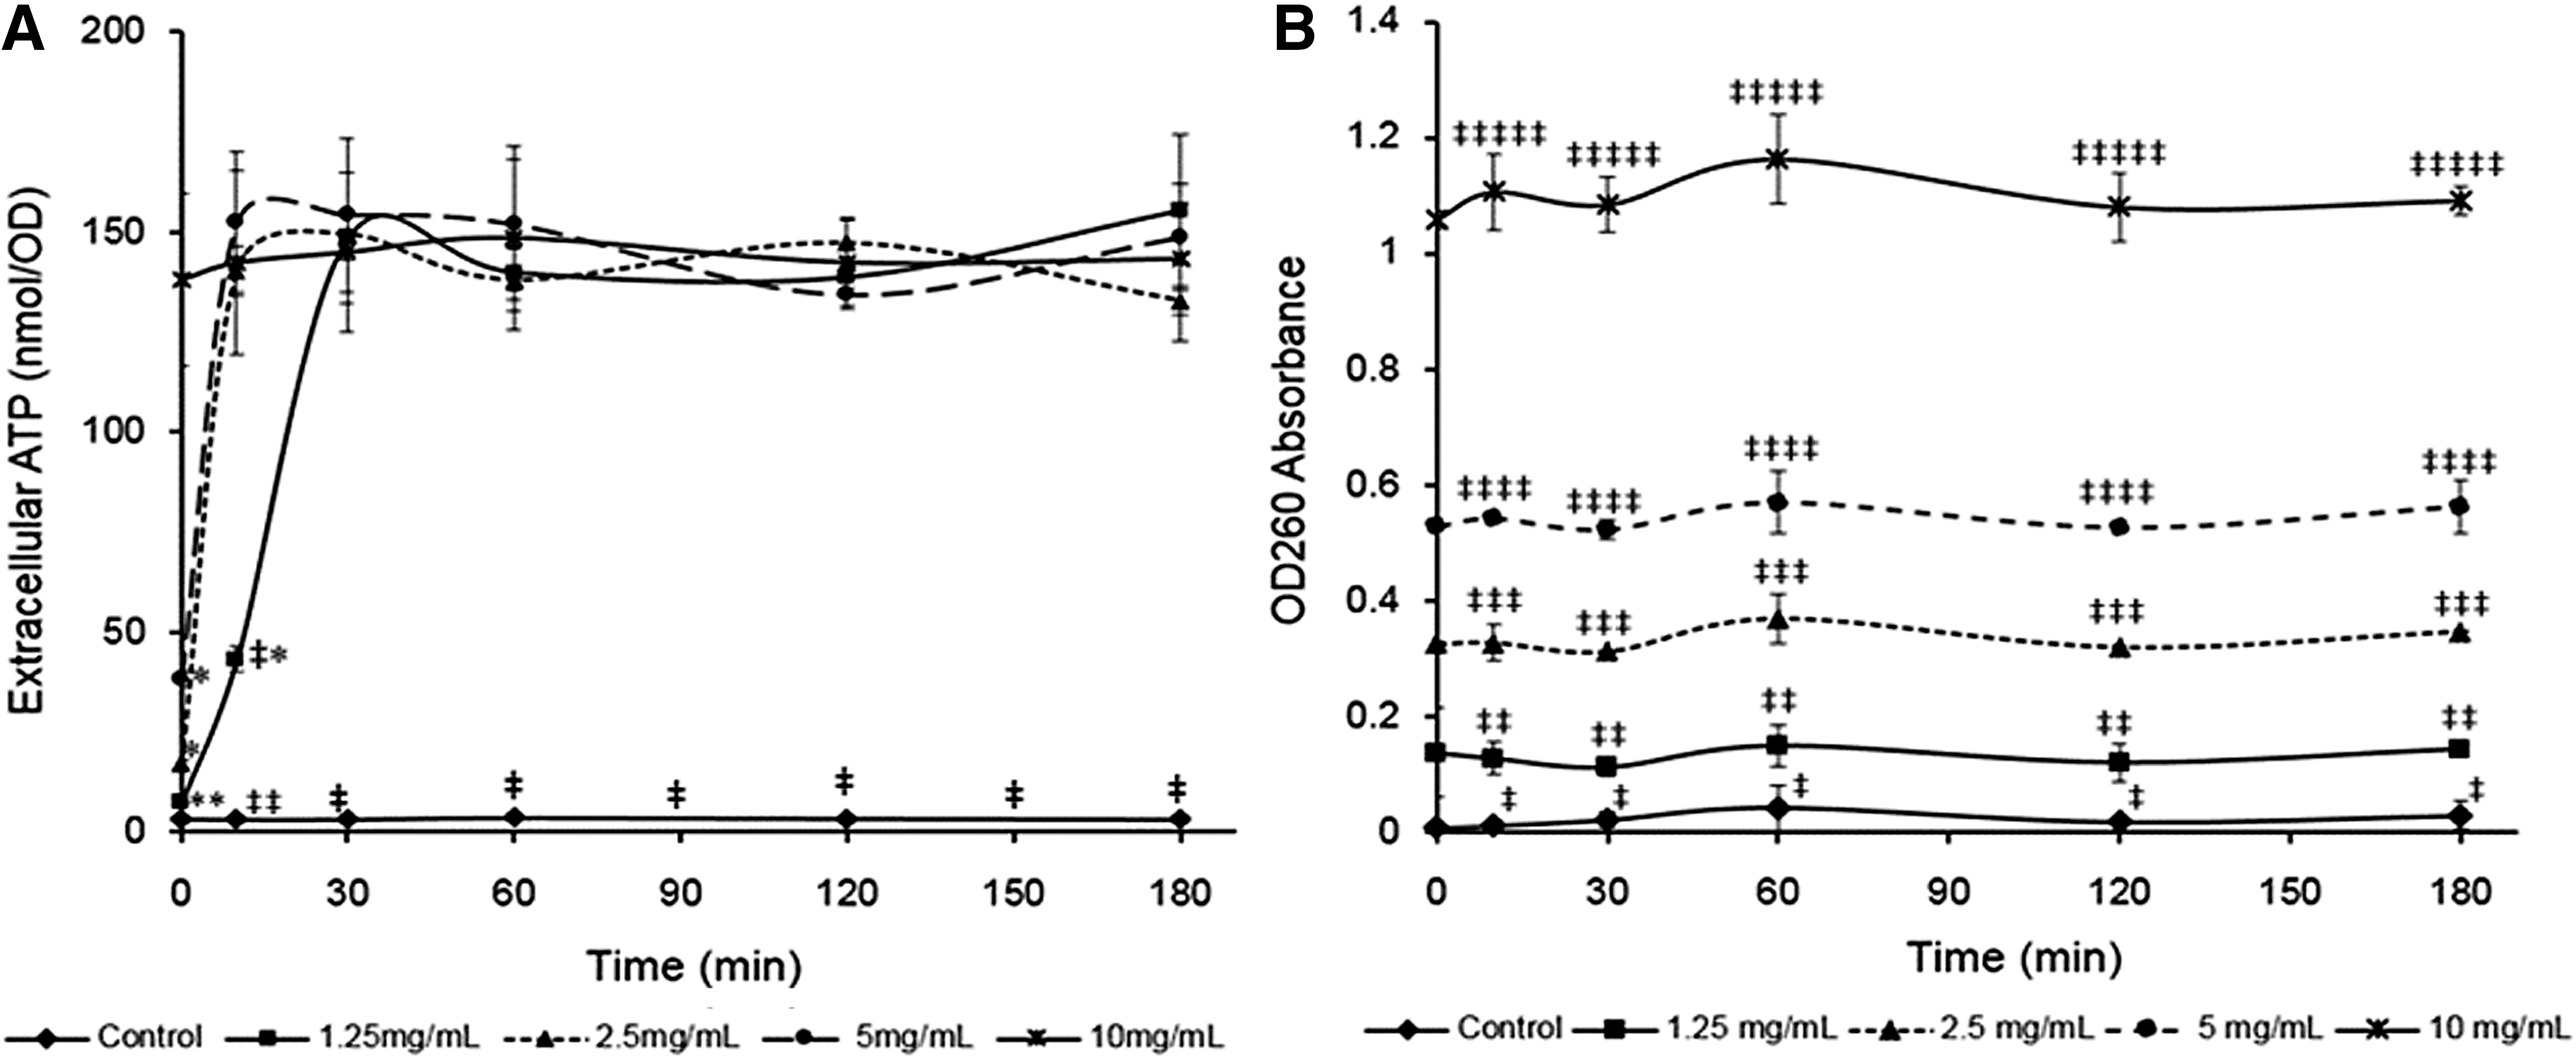
The increase in extracellular ATP levels can also represent cell injury and nonselective pore formation. The extracellular ATP level for control samples was maintained at ∼3 nmol/OD, but the initial extracellular ATP level for the samples treated with 10 mg/mL PLA was ∼140 nmol/OD, which was significantly higher than that of the control (p < 0.05; Fig. 4A). The initial extracellular ATP levels for the samples treated with 2.5 and 5 mg/mL PLA were ∼17 and ∼38 nmol/OD, respectively. These levels were both increased to ∼140 nmol/OD after 10 min of treatment. These results reveal that PLA can rapidly damage E. faecalis cell membrane integrity and consequently lead to leakage of intracellular ATP.
Changes in extracellular levels of ATP
Changes in UV-absorbing compounds
The serious damages in cell membrane can also lead to leakage of some high UV-absorbing molecules, including proteins and nucleic acids. All PLA treatments can induce the release of UV-absorbing compounds (Fig. 4B). The final OD260 value of 10 mg/mL PLA treatment was significantly higher than those of other PLA treatments (p < 0.05). This result indicates that the damage degrees of cell membrane became increasingly severe with increasing PLA concentrations. The OD260 values of each treatment were not significantly increased during the treatment time (p > 0.05), indicating that PLA treatments rapidly resulted in the leakage of high-molecular weight compounds.
Changes in membrane potential
The changes in membrane potential of E. faecalis cell were investigated using DiSC3(5), a membrane potential-sensitive probe (Huang and Yousef, 2014). As shown in Figure 5, the positive control of valinomycin (10 μmol/L) caused significant cell membrane depolarization (p < 0.05), whereas the negative control of nigericin (10 μmol/L) had a slight effect on cell membrane charge. E. faecalis cells displayed significant cell membrane depolarization after treatment with PLA at all concentrations (p < 0.05) compared with the control.

The membrane potential changes in E. faecalis cells treated with PLA at different concentrations. Different letters indicate significant difference for the same treatment time (p < 0.05). PLA, phenyllactic acid.
Discussion
Bacterial cell membranes can protect cells from the surroundings and are responsible for nutrients transportation. This study showed that the MIC of PLA E. faecalis was 5 mg/mL, whereas Ning et al. (2017) reported that the MICs of PLA for L. monocytogenes and E. coli were 1.25 and 2.5 mg/mL, respectively, which are lower than that for E. faecalis. Although cell membranes are the first target for organic acids to inactivate the bacteria, their damaged degrees are different. Wang et al. (2015) reported that although lactic acid (LA) led to the leakage of intracellular components, the general morphological structure of bacterial cells was still retained. However, Shi et al. (2016) reported that the lipoic acid-treated Cronobacter sakazakii cells showed severe morphological alterations. Ning et al. (2017) reported that PLA could damage the membrane integrity of L. monocytogenes, whereas it could not disrupt that of E. coli. Liu et al. (2018) reported that the damage and permeability of cell membrane of Enterobacter cloacae were observed after 1% PLA treatment. In this study, E. faecalis cell walls were disrupted and removed after PLA treatment. These differences in cell surface damage were due to the differences in target cell membrane and chemical structure of organic acids.
The results of CLSM and FCM analyses further showed that cell membranes were thoroughly damaged after treatment with 10 mg/mL PLA for 30 min, indicating that PLA had an effective antibacterial activity. Phenolic compounds caused the leakage of cell constituents (Johnston et al., 2003). These compounds may diffuse through the cytoplasmic membrane and increase membrane permeability, which involves cell compound leakage (Cuvelier et al., 1992). Phenolic compounds can target the cytoplasmic membrane through the accumulation of hydrophobic phenolic groups; thus, lipid solubility and the degree of steric hindrance of phenolic compounds might determine their antimicrobial activity (Ceylan and Fung, 2004). The antibacterial activities of many plant extracts and organic acid, such as vanillin, syringic acid, and emodin, were partly due to the phenolic compounds (Makwanaa et al., 2015; Li et al., 2016). Previous studies have shown that the antibacterial activity of PLA was more effective than that of LA because of this phenolic compound. Liu et al. (2017) reported that L. monocytogenes of ∼7 log CFU/mL was inactivated by 1% PLA within 1 min, whereas Wang et al. (2015) reported that L. monocytogenes of ∼7 log CFU/mL can only be inactivated by 1% LA up to 1 h.
PLA caused membrane hyperpolarization as a result of reduced membrane potential. The transmembrane electrical potential is important for the bacteria to generate ATP and transport nutrients into the cells. Cell membrane depolarization is a transition state that occurs before membrane permeabilization (Díaz et al., 2010), and it can affect the overall metabolic activity of bacteria and result in the inhibition of biosynthetic pathway (Bot and Prodan, 2009). It is easy for the antibacterial compounds to enter cell membranes when they are depolarized (Zhou et al., 2008; Sharma and Srivastava, 2014). The results in this study show that PLA rapidly causes depolarization of the cytoplasmic membrane and leads to the release of intracellular compounds.
In conclusion, PLA exhibited an effective antibacterial activity against E. faecalis in vitro. The underlying antibacterial mechanism of PLA on E. faecalis could be attributed to cell membrane damage and significant leakage of intracellular components. LA has been used as an antibacterial substance in food industry for decades. By contrast, PLA, a derivative organic acid of LA with phenolic group and can be produced by food-grade LA bacteria with high antimicrobial activity, may be considered a rational antibacterial substance in the future.
Footnotes
Acknowledgments
This study was funded by the National Natural Science Foundation of China (31871866), Primary Research & Development Plan of Jiangsu Province (BE2017392), the Innovation of Agricultural Science and Technology of Jiangsu Province (CX[17]3015), and China Agriculture Research System (CARS-41).
Disclosure Statement
No competing financial interests exist.