
Abstract
Approximately 20% of U.S. beef cattle receive prophylactic in-feed administration of chlortetracycline (CTC) to reduce bovine respiratory disease (BRD) incidence during the transition into feedlots. To determine the impact of prophylaxis on selected antimicrobial resistance genes (ARGs), 300 beef cattle were placed into 10 pens (30 head/pen). Five “CTC group” pens received in-feed CTC (10 mg/lb of body weight/d) from the fifth to ninth day after feedlot arrival, whereas the five “Control group” pens received no CTC. Fecal swabs and pen surface materials were collected for metagenomic DNA isolation on five sample occasions: arrival at the feedlot, 5 d posttreatment (dpt), and 27, 75, and 117 dpt. For each sample occasion, fecal samples and pen surface material samples were pooled by pen. Quantitative polymerase chain reaction was used to determine the abundances of 10 ARGs. Due to low detection percentages (%D) and quantification percentages (%Q), the abundances of five ARGs were not analyzed: aac(6′)-Ie-aph(2′′) (%D = 43%, %Q = 4%), bla CMY-2 (%D = 41%, %Q = 0%), bla CTX-M (%D = 0%, %Q = 0%), bla KPC-2 (%D = 21%, %Q = 16%), and mecA (%D = 4%, %Q = 0%). The %D and %Q for the ARGs aadA1, erm(B), tet(A), tet(B), and tet(M) were ≥98% and ≥90%, respectively. The abundances of aadA1, erm(B), tet(A), tet(B), and tet(M) resistance genes did not differ (p > 0.05) between the CTC and control groups at any sampling time for feces or pen surface material. Although only 10 ARGs were examined in this study, the results suggest that a single 5-d in-feed CTC prophylaxis of beef cattle to prevent BRD has a negligible impact on the abundances of ARGs.
Introduction
B
In-feed CTC at a dose of 10 mg per pound of body weight per day for no more than five continuous days is approved for the management of bovine respiratory disease (BRD). Cattle are susceptible to BRD during weaning and the transition into feedlots (Snowder et al., 2007; Apley, 2014). Previously, we reported the effects of 5-d in-feed CTC prophylaxis of beef cattle on fecal and pen surface material levels of third-generation cephalosporin-resistant (3GCr) Escherichia coli and tetracycline-resistant (TETr) E. coli (Agga et al., 2016). However, culture of E. coli only partially addresses AMR: most of the cattle fecal microbiome is unculturable, and numerous AMR genes (ARGs) are harbored on mobile genetic elements. During the previous study, samples of fecal swab and pen surface materials (feces, urine, and soil present on the pen surface) from five sample occasions (arrival, 5 d posttreatment [dpt], and 27, 75, and 117 dpt) were archived. The goal of this study was to provide further insights into the AMR impacts of in-feed CTC by isolating metagenomic DNA from the archived samples and using quantitative polymerase chain reaction (qPCR) to determine the levels of 10 ARGs representing four different classes of AMs important to human medicine: aminoglycosides, β-lactams, macrolides, and tetracyclines.
Methods
Experimental design
All procedures and protocols were performed in accordance with the experimental protocol reviewed and approved by the U.S. Meat Animal Research Center (USMARC) Institutional Animal Care and Use Committee (approval number 3040-42000-014-07) in accordance with all applicable guidelines and regulations. The detailed experimental design was reported previously (Agga et al., 2016). Briefly, 300 weaned calves (between 4 and 6 months old) were blocked by birth date, body weight, and sex upon arrival at the USMARC feedlot and then randomly assigned to two treatments (150 calves/treatment). Four days after arrival, five pens designated “CTC treatment” received CTC medicated feed (Aureomycin, CTC complex equivalent to 10 mg/lb of body weight/d of CTC; Zoetis, Kalamazoo, MI) for five consecutive days. The remaining pens were designated the “Control treatment” and received identical feed without CTC. Three empty pens separated the groups from each other and from nonstudy animals. Animals were monitored by cattle operations staff and received normal veterinary care as required. Cumulative morbidities were 38 and 2 animals in the Control and CTC groups, respectively. All morbid animals received therapeutic AM treatments and were removed from the experiment. Fecal and pen surface material samples were collected on five sample occasions: at feedlot arrival (“Arrival,” February 9, 2015), “5 dpt,” (February 23, 2015), “27 dpt,” (March 17, 2015), “75 dpt,” (May 4, 2015), and “117 dpt,” (June 15, 2015).
Feces were sampled directly from the rectum using a foam-tipped swab (VWR International, Buffalo Grove, IL). Swabs were placed into 15-mL conical tubes containing 5 mL of tryptic soy broth with phosphate buffer (TSB-P; 30 g of tryptic soy broth, 2.31 g of KH2PO4 and 12.54 g of K2HPO4 per liter; Becton Dickinson, Sparks, MD). Within 2 h of sampling, fecal swabs were homogenized by vortexing for 30 s, and a 0.5-mL aliquot was removed and stored at −20°C.
For pen surface materials, each pen was divided into similarly sized quadrants. In each quadrant, the pen surface was sampled at multiple locations by using a gloved hand to place handfuls of material from the pen surface (avoiding obvious fecal pats and without digging) into a sterile bag until ∼25 g was obtained. Thus, four samples per pen were collected from all pens, including three unoccupied pens used to separate the treatment groups from each other and from other non-study animals. Pen surface materials were also compared between the “Occupied Pens treatment” (defined as the five CTC treatment pens and the five Control treatment pens occupied by experimental cattle) and the “Empty Pens treatment” (defined as three pens unoccupied by any cattle). For each sample, within 2 h of sampling, 10 g of pen surface material was transferred to filter barrier bags, followed by the addition of 90 mL of TSB-P and homogenization by hand massage for 30 s. From each sample suspension, a 1-mL aliquot was removed and stored at −20°C.
Metagenomic DNA isolation
For each sample occasion, fecal swab samples were pooled by pen by combining 30 μL of each fecal sample in a 15-mL conical tube for each pen. Thus, a total of 50 fecal sample pools were obtained. For each sample occasion, pen surface material samples were pooled by pen by combining 250 μL of each sample in a 15-mL conical tube for each pen, resulting in a total of 65 pen surface material sample pools. DNA was isolated using the DNeasy PowerLyzer PowerSoil DNA Isolation Kit (Qiagen, Valencia, CA) according to the manufacturer's instructions with the following modifications: first, instead of adding 0.25 g of solid, 250 μL of resuspended sample was added to the bead lysing matrix tube. Second, cells were lysed by using FastPrep 96 (MP Biomedicals, Santa Ana, CA) at 1600 rpm for 180 s.
Quantitative polymerase chain reaction
qPCR was performed in a 20 μL reaction using 2.5 μM gene-specific primers (Table 1), 2 μL of template DNA, and 10 μL of Fast SYBR Green master mix (Thermo Fisher Scientific, Waltham, MA). Thermal cycling was performed on an ABI 7500 Fast Real-Time PCR system (Thermo Fisher Scientific) with the following conditions: 95°C for 20 s, followed by 40 cycles of 95°C for 3 s and 60°C for 30 s. For each ARG, standard curves were generated using DNA extracted from bacterial strains harboring the target genes (Table 2). Ten-fold serial dilutions of DNA from each bacterial strain were used as templates. For each standard, three replicate runs of each sample were performed. The efficiencies for each ARG are reported in Supplementary Table S1 (Supplementary Data are available online at
Oligonucleotide Primers Used for Quantitative Polymerase Chain Reaction
Sources of DNA for Quantitative Polymerase Chain Reaction Standard Curve Generation
ATCC, American Type Culture Collection; USMARC, U.S. Meat Animal Research Center.
For each sample and ARG, the 16S rRNA gene-normalized fold change relative to the reference sample occasion value (2−ΔΔCt) was calculated (Livak and Schmittgen, 2001). The 16S rRNA gene was used as the internal control gene, and the Arrival sample occasion was used as the reference. Specifically, ΔΔCt = ΔCt, Sample Occasion−ΔCt, Reference, where ΔCt, Sample Occasion = Ct, ARG − Ct, 16S rRNA gene and ΔCtReference = Σ ΔCt, Arrival÷n Arrival (for fecal samples, n Arrival = 10; for pen surface material samples, n Arrival = 13). In addition, absolute concentrations (in pg/g or ng/g) were calculated for each gene using standard curves calculated for each ARG.
Comparisons were evaluated by two-way analysis of variance (ANOVA) with Sidak correction for multiple comparisons using GraphPad Prism for Mac OS X version 6.0h (GraphPad Software, Inc., La Jolla, CA). Analyses were performed with treatment and sample occasion as factors and with sample occasion as a repeated measure. p-values <0.05 were considered statistically significant.
Results
Fecal swabs
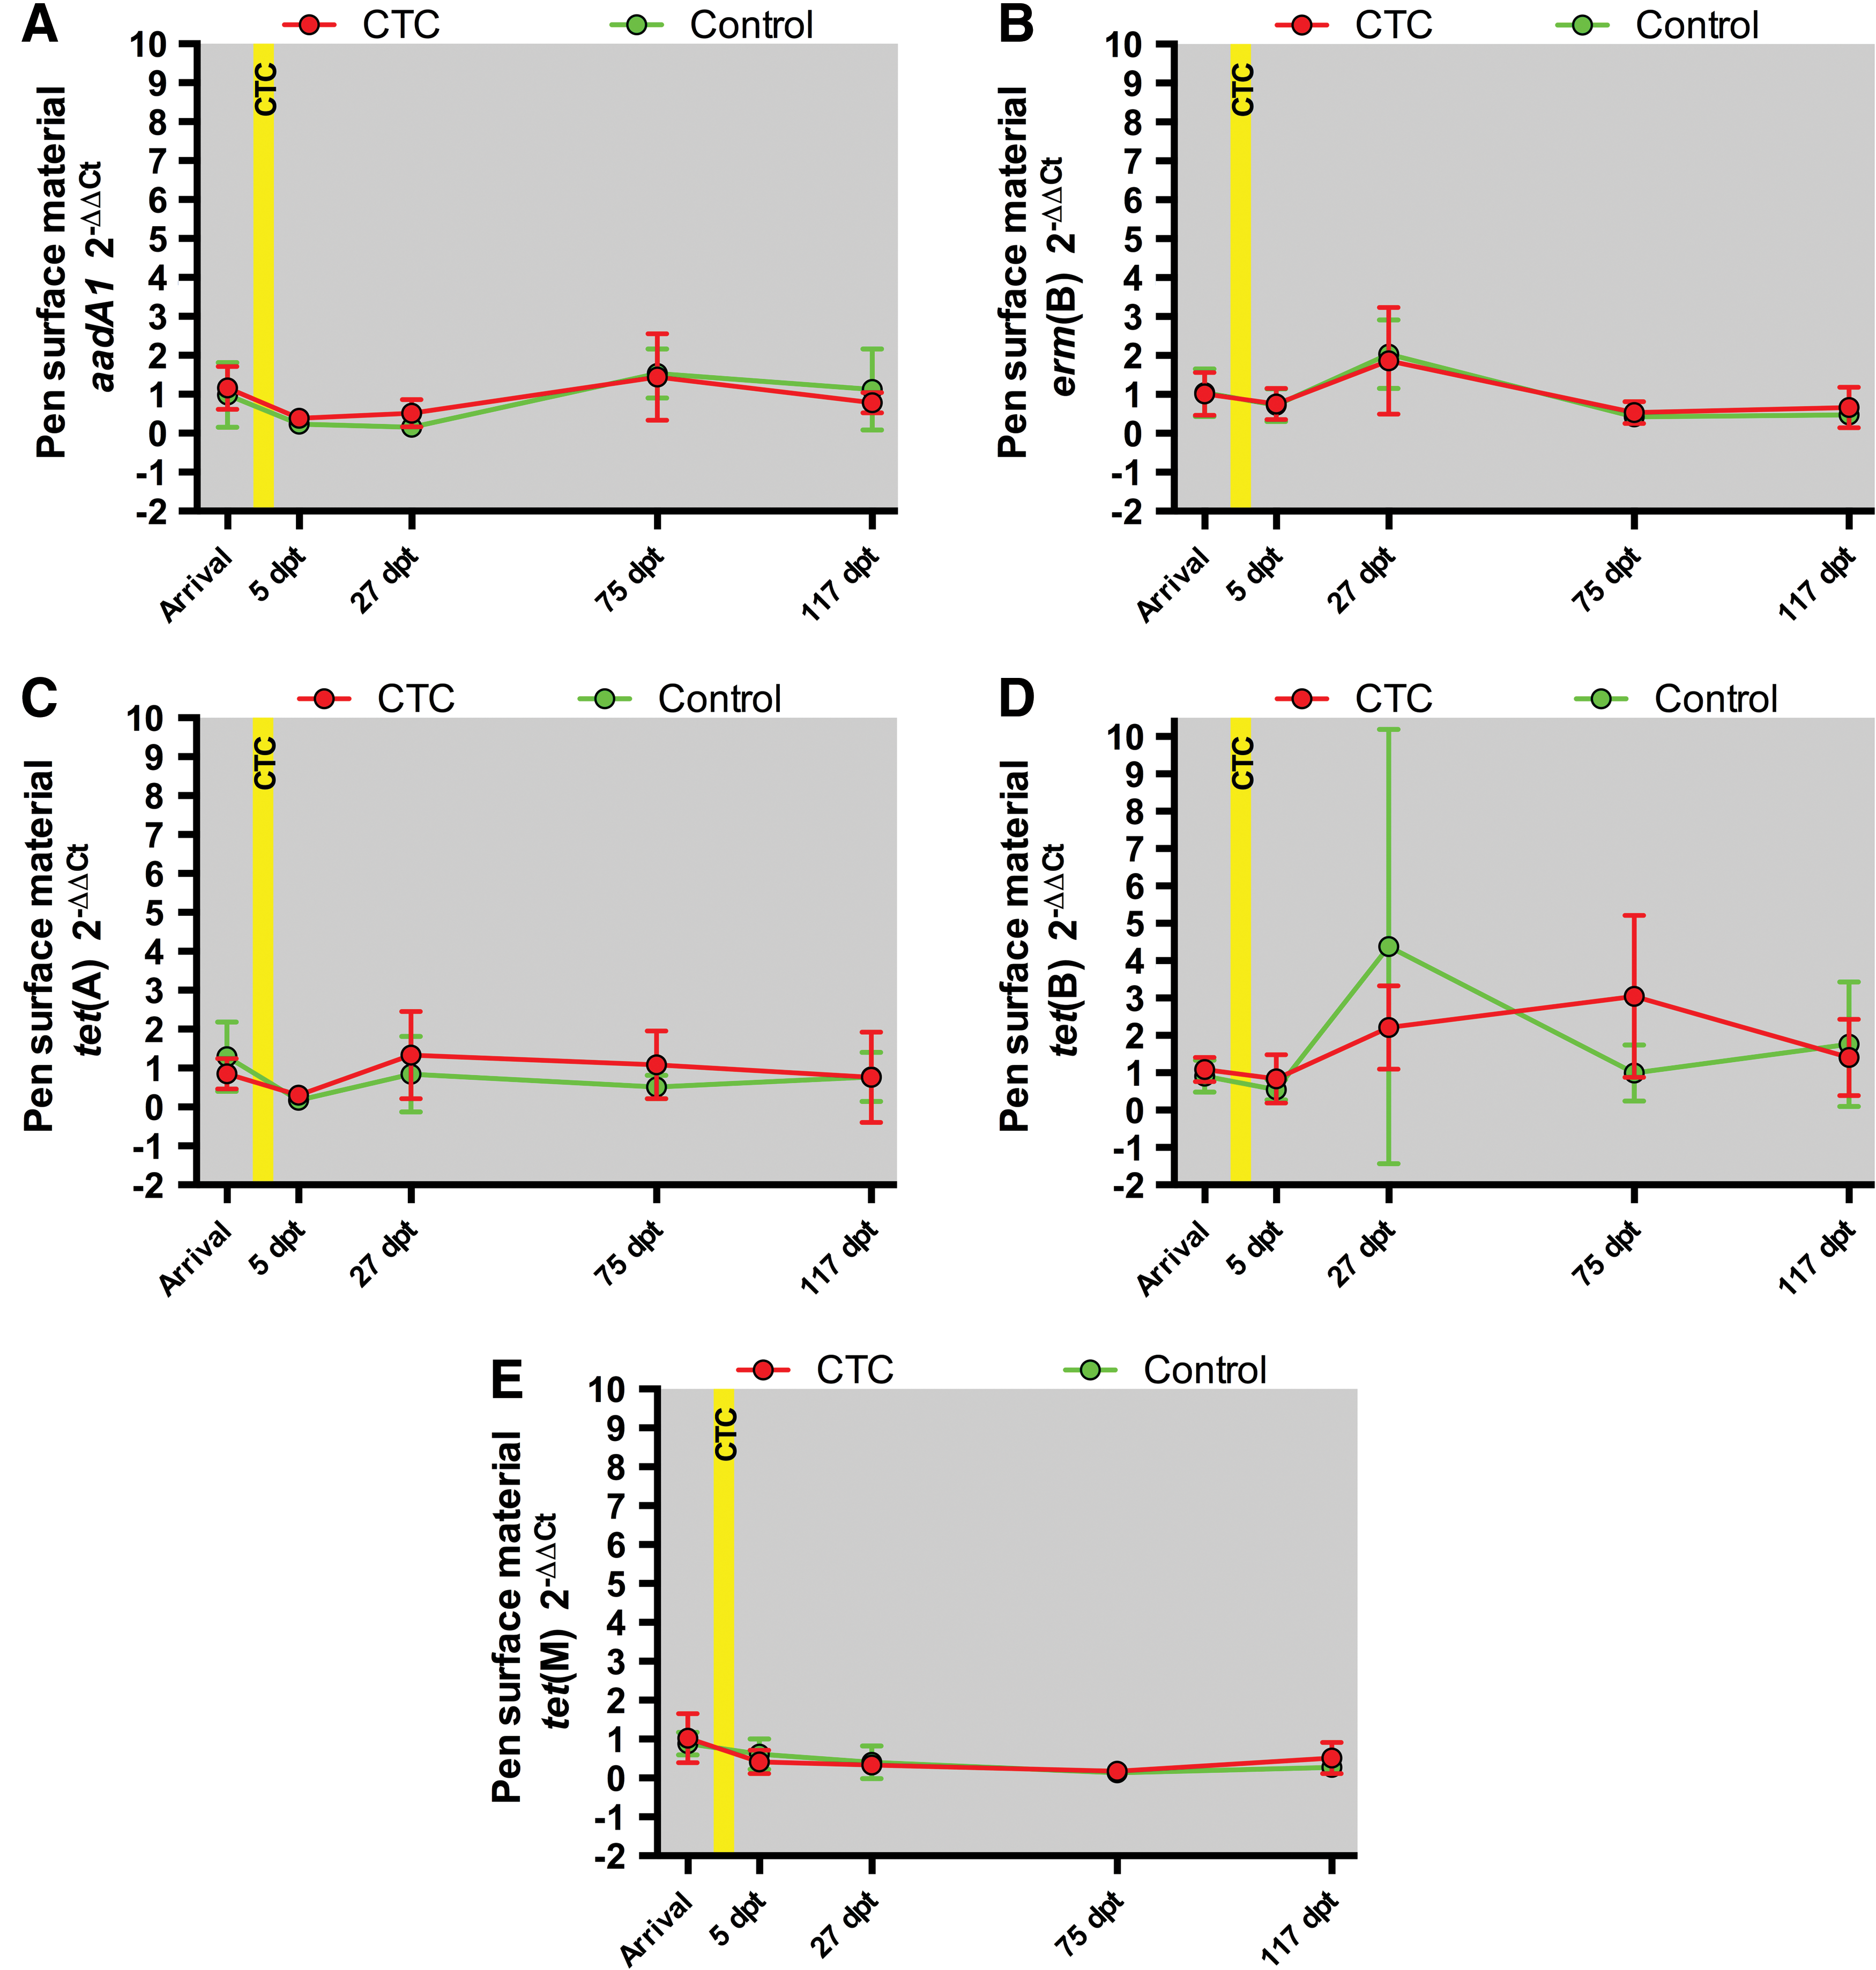
Abundances of the ARGs aac(6′)-Ie-aph(2′′)-Ia, bla CMY-2, bla CTX-M, bla KPC-2, and mecA were not analyzed since their levels were not quantified for all 50 fecal samples (Table 3). For the ARGs aadA1, erm(B), tet(A), tet(B), and tet(M), abundances (specifically, 2−ΔΔCt values, fold change in 16S rRNA gene-normalized abundances relative to the Arrival sample occasion) did not differ significantly between CTC and Control treatments for any sample occasion (Fig. 1). The abundance differences between groups (with p-values) for each ARG and sample occasion are provided in Supplementary Table S2. The abundances of erm(B), tet(A), tet(B), and tet(M) were significantly affected by sample occasion (Supplementary Table S3). In particular, erm(B), tet(A), tet(B), and tet(M) 117 dpt abundances were significantly higher (5.5-, 11.0-, 9.0-, and 51.0-fold higher, respectively) than their corresponding Arrival abundances (Supplementary Table S3).

Fecal swab 2−ΔΔCt values for the CTC (red circles and lines) and Control (green circles and lines) treatments. Each data point represents the mean of five samples for the indicated group and treatment occasion. The error bars indicate 95% confidence intervals. The yellow box indicates the period of in-feed CTC administration.
Detection and Quantification of 10 Antimicrobial Resistance Genes in Fecal and Pen Surface Material Samples
ARG, antimicrobial resistance gene.
Pen surface material
Analyses were not performed for aac(6′)-Ie-aph(2′′)-Ia, bla CMY-2, bla CTX-M, bla KPC-2, and mecA since they were not quantified in >70% of pen surface material samples (Table 3). For the ARGs aadA1, erm(B), tet(A), tet(B), and tet(M), abundances did not differ significantly (p > 0.05) between the CTC and Control treatments during any sample occasion (Fig. 2). The mean abundance differences between the CTC and Control treatments (with p-values) for each ARG and sample occasion are provided in Supplementary Table S4. For the ARGs erm(B), tet(A), tet(B), and tet(M), abundances did not differ significantly between the Occupied pens (the five CTC and five Control treatment pens combined) and Empty pens (three pens unoccupied throughout the study) for any sample occasion (Fig. 3). The mean abundance differences between the Occupied and Empty pens (with p-values) for each ARG and sample occasion are provided in Supplementary Table S5. The abundance of aadA1 was significantly different (p = 0.01) only at Arrival, but the magnitude of the mean difference was only 1.1-fold (Supplementary Table S5).
Pen surface material 2−ΔΔCt values for thee CTC (red circles and lines) and Control (green circles and lines) treatments. Each data point represents the mean of five samples for the indicated treatment and sample occasion. The error bars indicate 95% confidence intervals. The yellow box indicates the period of in-feed CTC administration.
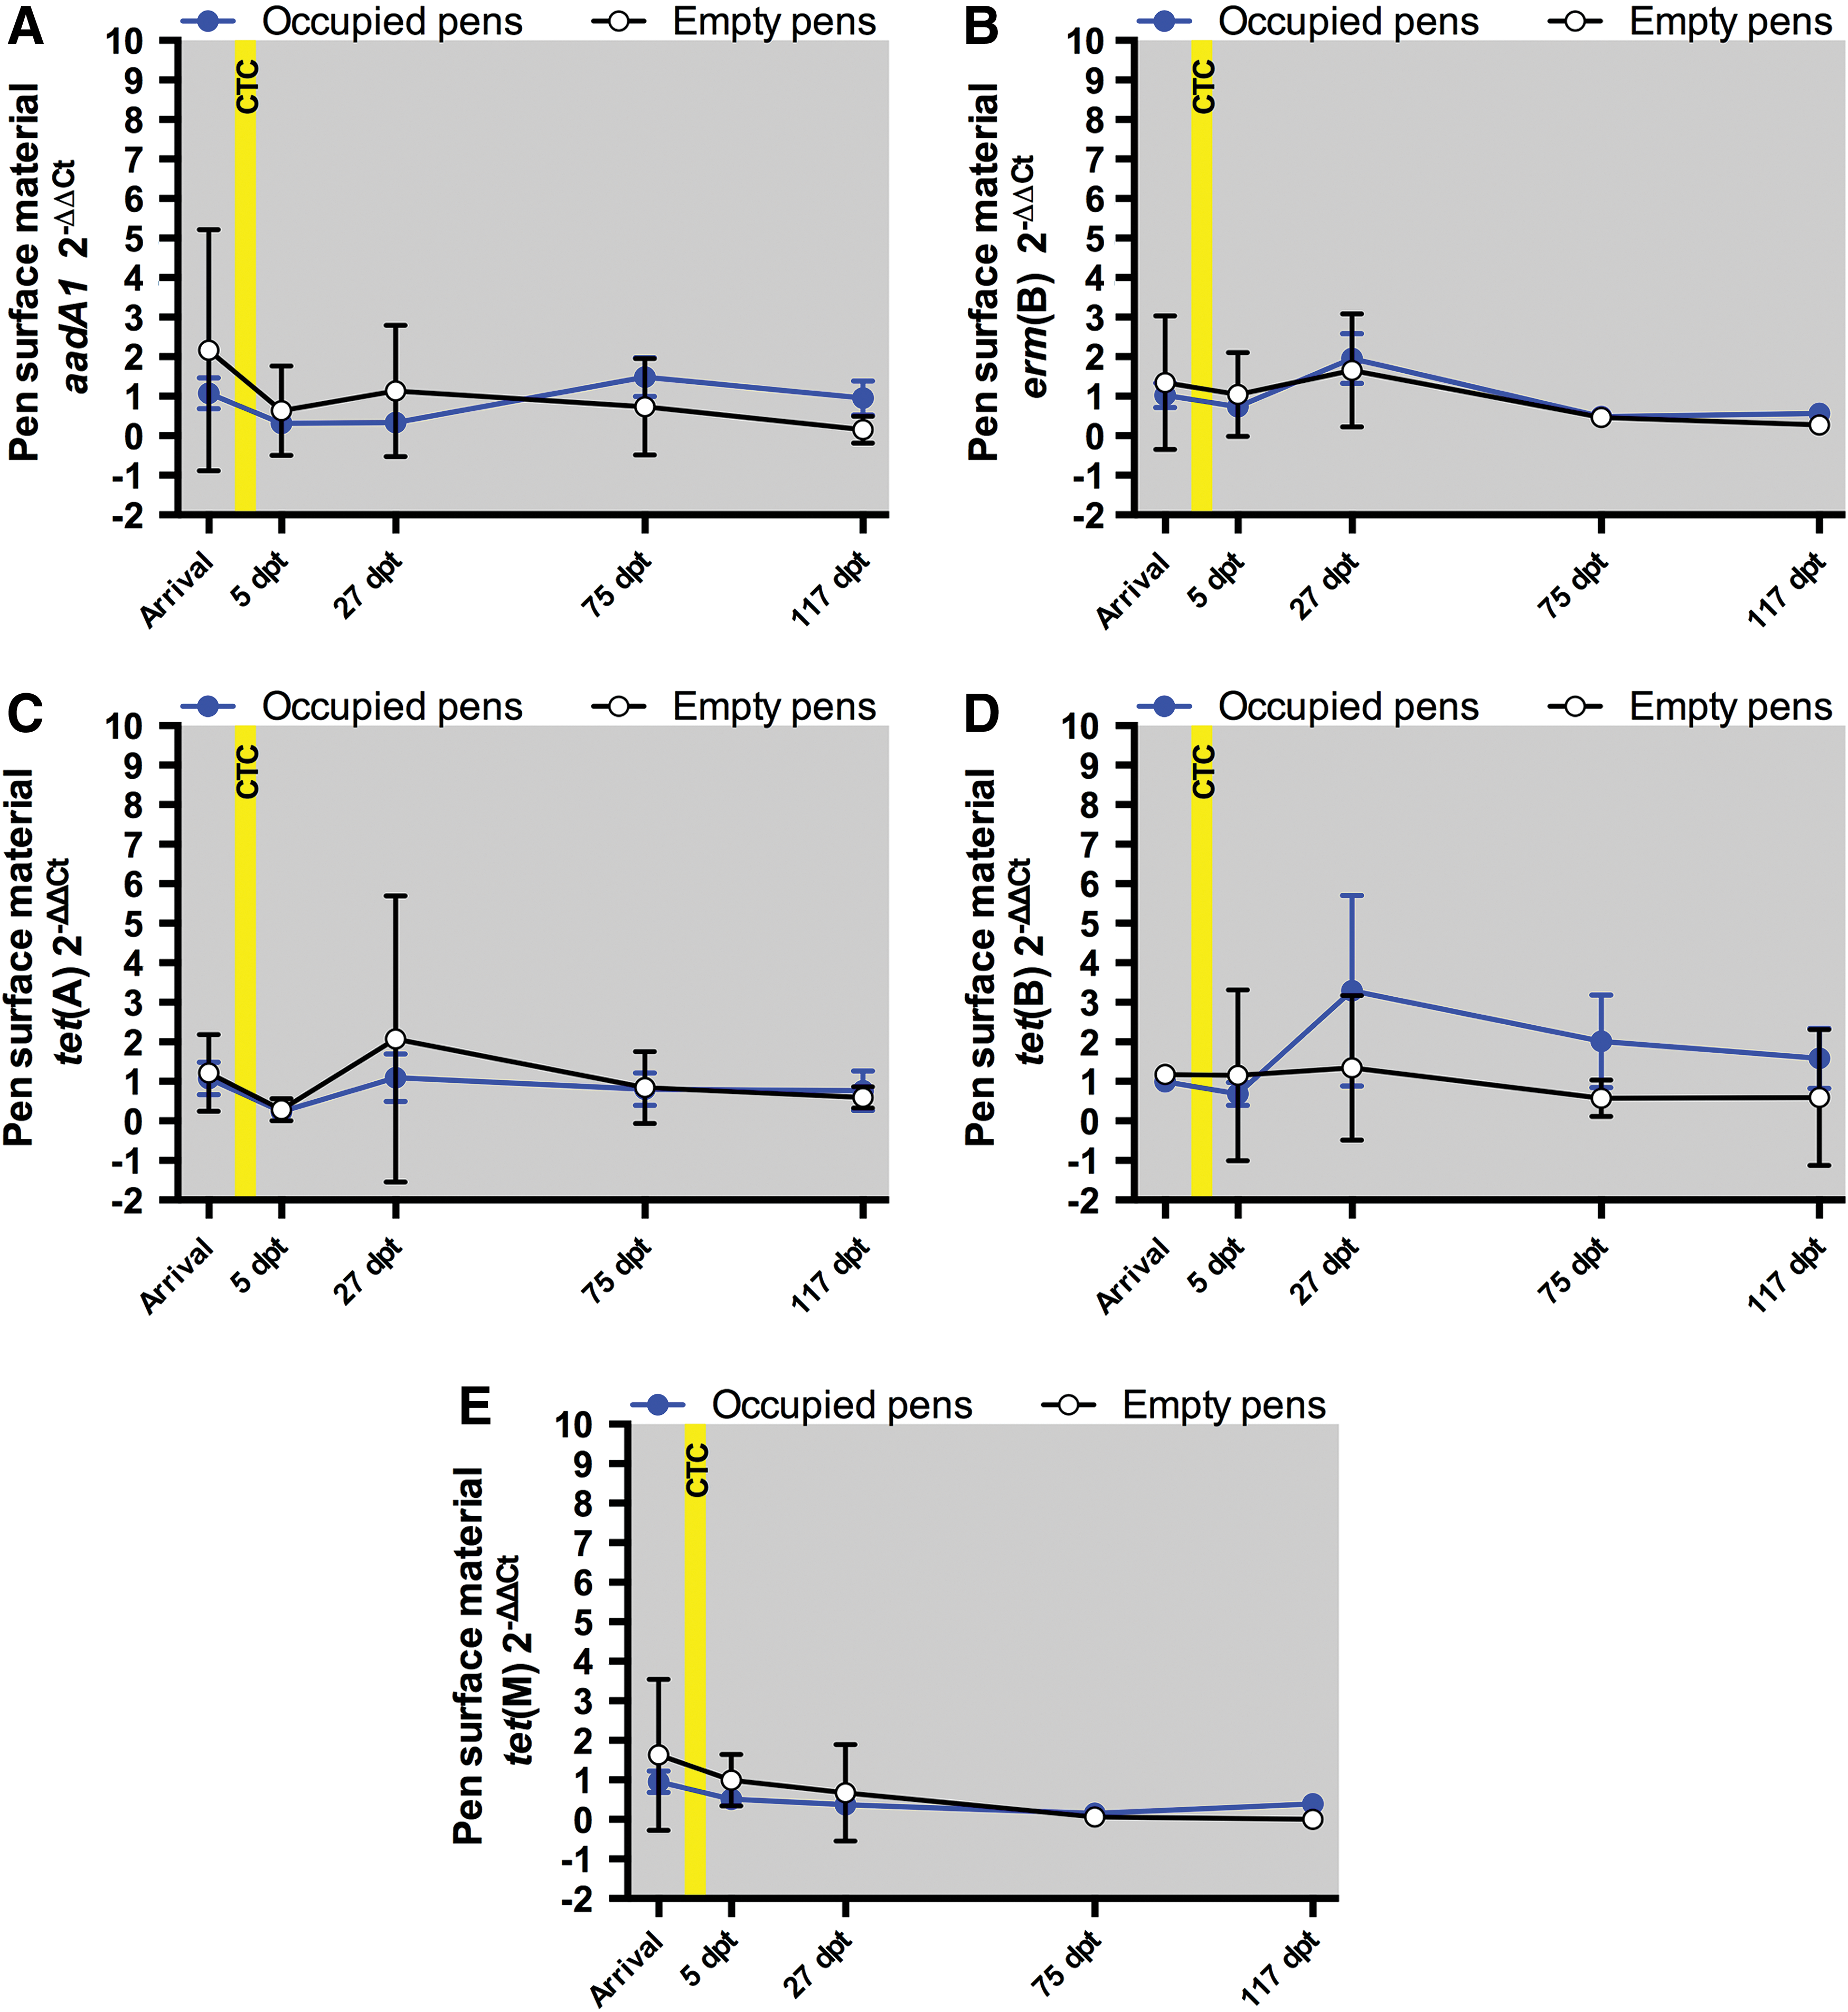
Pen surface material 2−ΔΔCt values for the Occupied pens (blue circles and lines) and Empty pens (white circles and black lines). Each Occupied pens data point represents the mean of 10 samples. Each Empty pens data point represents the mean of three samples. The error bars indicate 95% confidence intervals. The yellow box indicates the period of in-feed CTC administration.
For the Occupied pens, the pen surface material abundances of aadA1, erm(B), tet(A), tet(B), and tet(M) were significantly different (p < 0.05) for some sample period comparisons (Supplementary Table S6). For aadA1, erm(B), tet(A), and tet(M), these significantly different abundances were all ≤1.5-fold. For tet(B), the abundances in the Occupied pens were 2.3-fold (p = 0.04) higher at 27 dpt than at Arrival and 2.6-fold higher (p = 0.01) at 27 dpt than at 5 dpt (Supplementary Table S6). For the Empty Pens, the ARGs aadA1, erm(B), tet(A), tet(B), and tet(M) abundances did not differ by more than 2.0-fold between sample occasions (Supplementary Table S6).
Discussion
For both fecal swab (Fig. 1C–E) and pen surface material samples (Fig. 2C–E), the tet(A), tet(B), and tet(M) abundances (2−ΔΔCt values) did not differ between the CTC and Control treatments on any sample occasion. Previously, our laboratory reported that TETr E. coli concentrations in fecal swab and pen surface material samples were higher in the CTC than the Control treatment at 5 dpt, but did not differ between the CTC and Control treatments at 27, 75, and 117 dpt (Agga et al., 2016). Although tet(A) and tet(B) are the predominant tetracycline resistance (tet) genes in E. coli, these results are compatible since many other Gram-negative bacteria in the bovine fecal metagenome also harbor tet(A) and tet(B) (Bryan et al., 2004; Roberts, 2005). Taken together, both this study and our previous study (Agga et al., 2016) suggest that 5-d in-feed CTC prophylaxis of beef cattle has no long-term impacts and minimal short-term impacts on tetracycline resistance levels.
CTC use concerns extend beyond tetracycline resistance to “co-selection” for resistance to other classes of AMs since diverse mobile genetic elements have been demonstrated to harbor multiple ARGs, each conferring resistance to a different AM class (Durso and Cook, 2014). Specific concerns have been raised regarding CTC use and third-generation cephalosporin resistance since the bla CMY-2 and tet(A) genes are both contained on IncA/C plasmids found in several Gram-negative species (Call et al., 2010; Kanwar et al., 2013, 2014). In this study, bla CMY-2 was detected in only 44 of 115 samples, but could not be quantified in any sample (Table 1). There was no obvious difference in bla CMY-2 detection rates between groups (detected in 42%, 44%, and 27% of the Control, CTC, and Empty pen treatment samples, respectively). In our previous study, 3GCr E. coli levels did not differ between the CTC and the Control treatments (Agga et al., 2016). In addition, abundances of the aminoglycoside class ARG aadA1 (Figs. 1A and 2A) and the ARG erm(B) conferring resistance to macrolide, lincosamide, and streptogramin B AM classes (Figs. 1B and 2B) did not differ between the CTC and Control treatments. Together, these results suggest that 5-d in-feed CTC prophylaxis of beef cattle may not have a substantial impact on AMR levels by co-selection.
Fecal swab abundances of erm(B), tet(A), tet(B), and tet(M) were significantly (p ≤ 0.02) higher at 117 dpt compared to Arrival (Supplementary Table S3). We can only hypothesize causes of the generally increasing fecal abundances of erm(B), tet(A), tet(B), and tet(M) as the sample occasions progressed. One possibility is that the increased abundances were due to microbiome changes since climatic conditions and cattle feed changed over the course of the study. However, microbiome analysis was beyond the scope of this study. A second possibility is that the increased fecal abundances of erm(B), tet(A), tet(B), and tet(M) over time were due to the increased prevalence of these ARGs in the feedlot environment over time. Pen surface material 2−ΔΔCt abundances of erm(B), tet(A), tet(B), and tet(M) did not differ significantly between the Occupied and Empty pens (Fig. 3). However, 2−ΔΔCt abundances were normalized to 16S rRNA gene levels, which may have negated differences due to population increases that occurred over the course of the study. Indeed, when non-normalized absolute amounts of the ARGs were calculated, we found instances of significantly (p ≤ 0.04) higher pen surface material concentrations of aadA1, erm(B), tet(A), tet(B), and tet(M) in Occupied Pens (Fig. 4 and Supplementary Table S8). The study pens were scraped clean of manure before initiation of this study, and we theorize that manure deposition may have increased bacterial levels on the pen surface, with corresponding increases in AM-resistant bacteria and associated ARGs. Providing support for this theory, our previous study found that total E. coli concentrations, TETr E. coli concentrations, and 3GCr E. coli prevalence increased significantly over time in fecal swabs and pen surface materials from the Occupied pens (Agga et al., 2016).
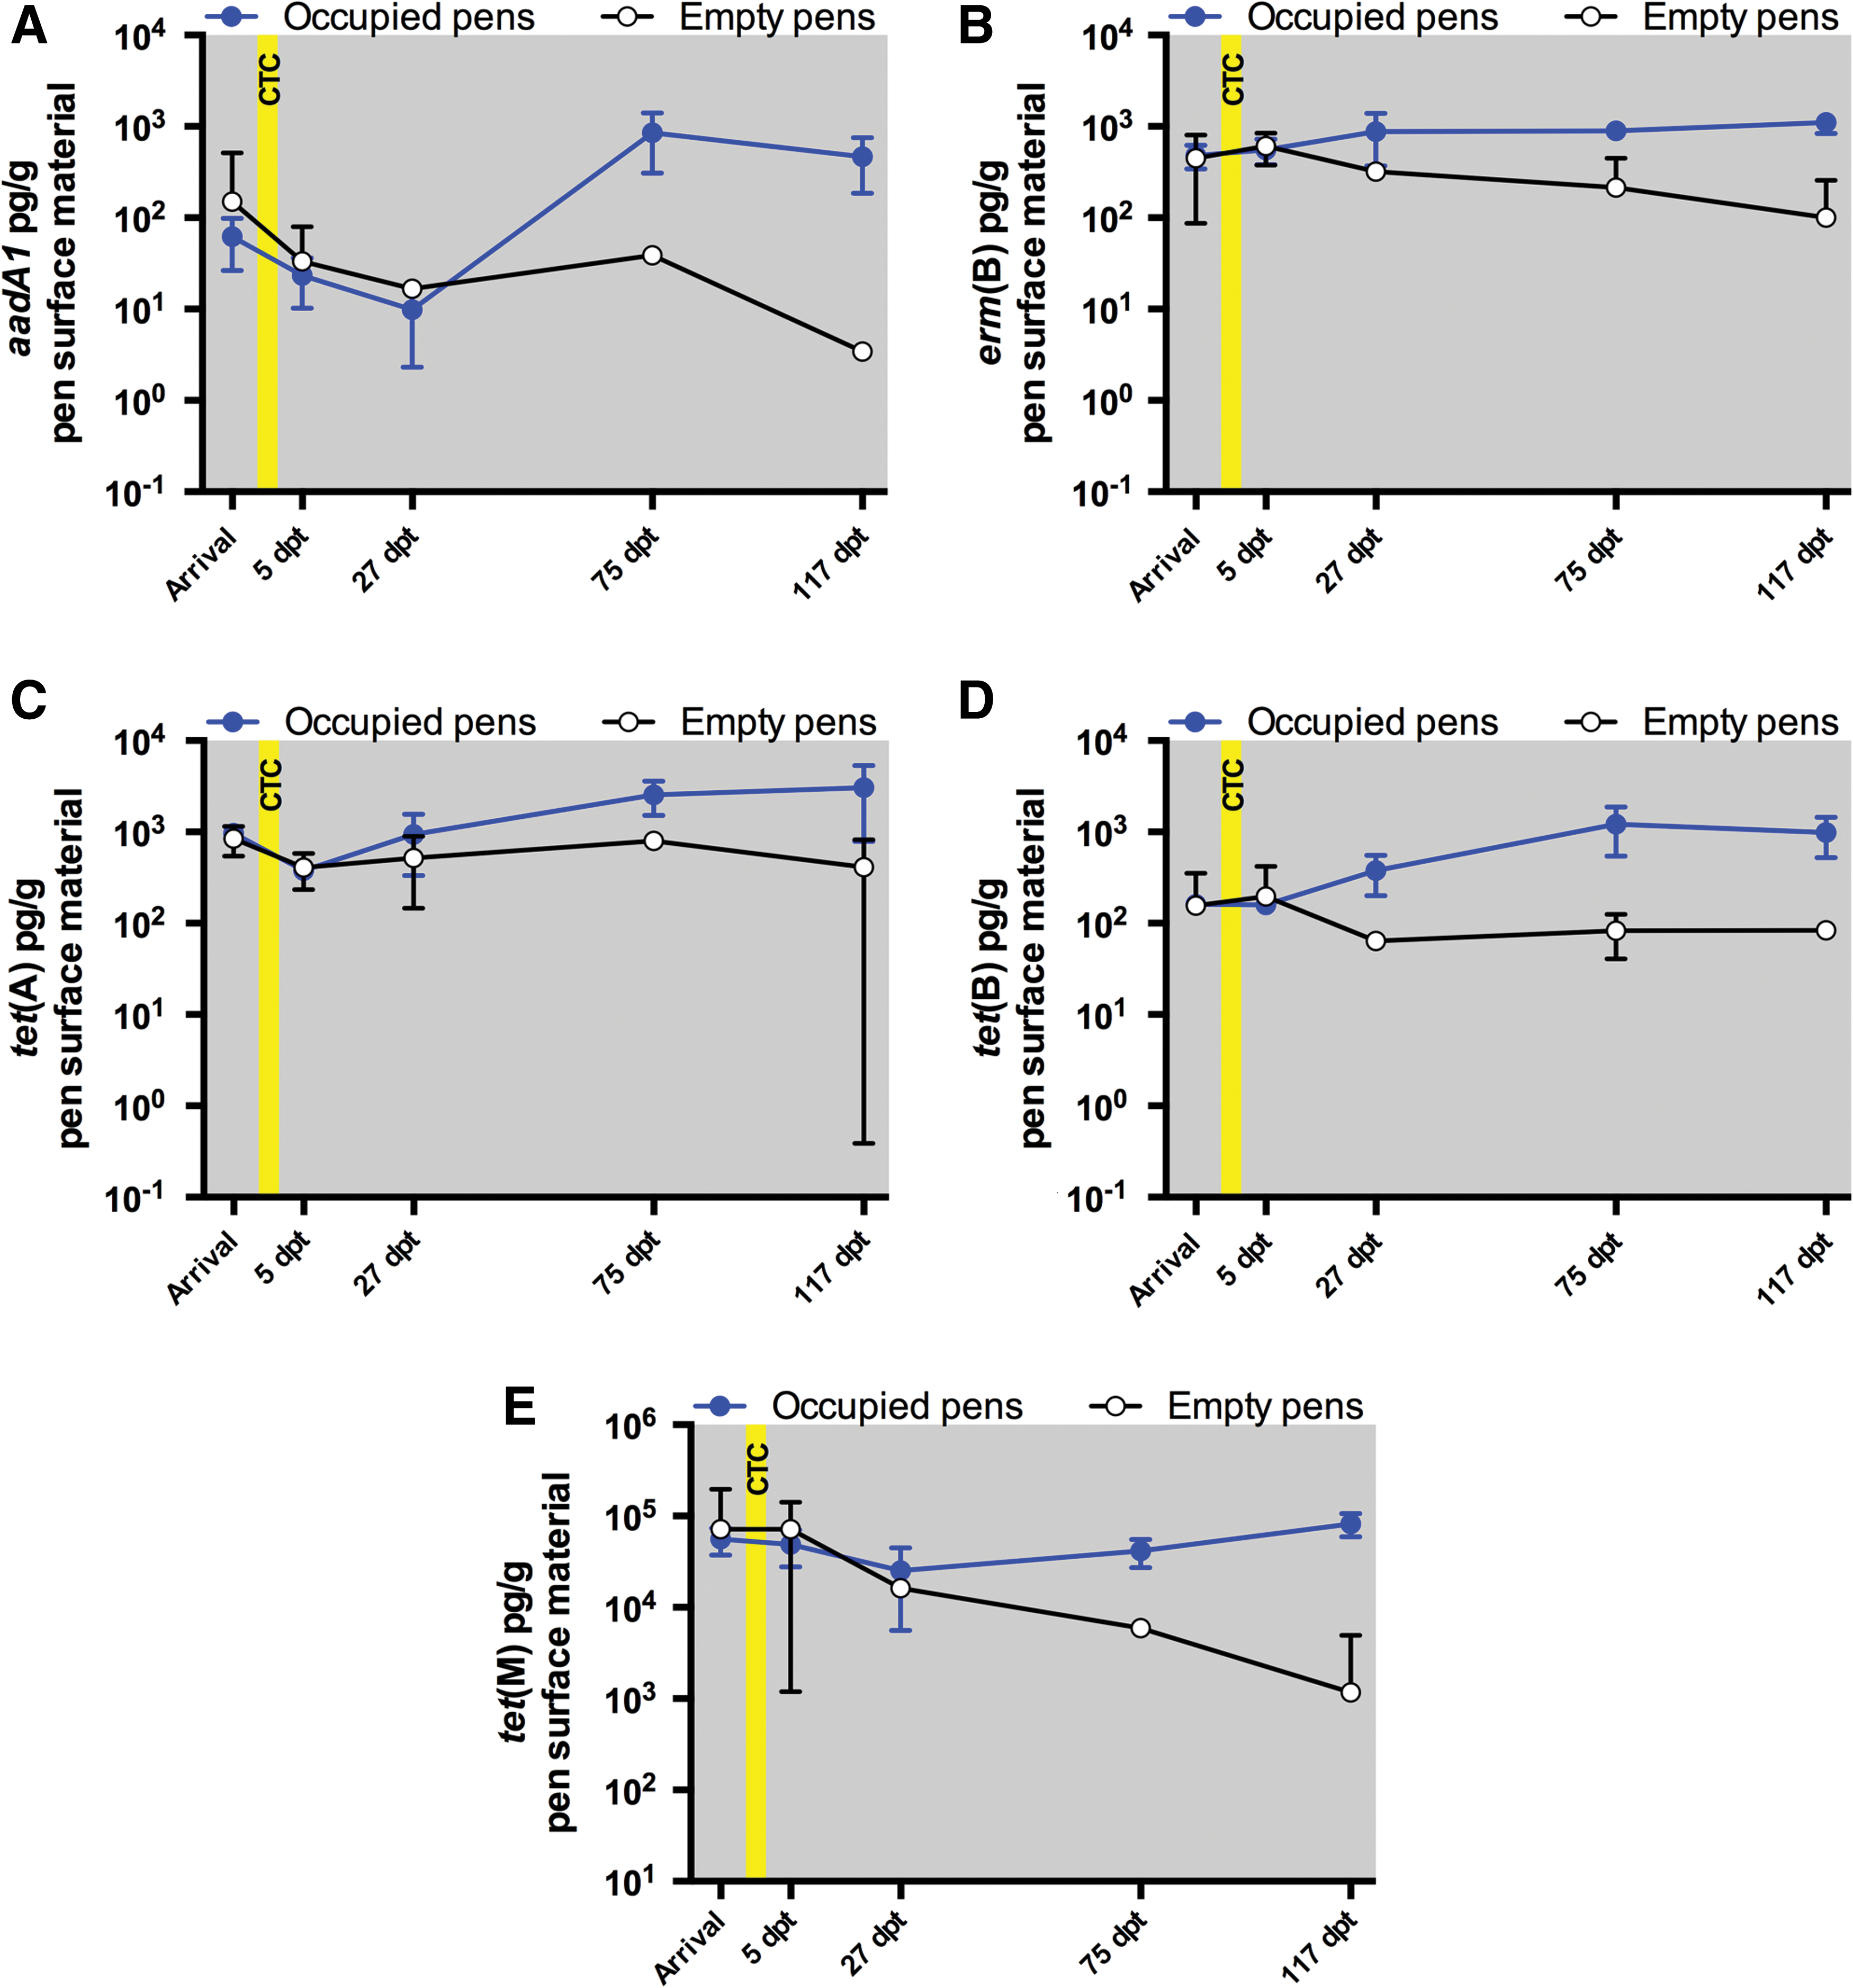
Pen surface material concentration values for the Occupied pens (blue circles and lines) and Empty pens (white circles and black lines). Each Occupied pens data point represents the mean of 10 samples. Each Empty pens data point represents the mean of three samples. The error bars indicate 95% confidence intervals. The yellow box indicates the period of in-feed CTC administration.
Taken together, this study and our previous study of TETr and 3GCr E. coli (Agga et al., 2016) indicate that single 5-d in-feed CTC prophylaxis of weaning calves during placement at cattle feeding operations has minimal to no effect on AMR levels, especially longterm (>27 dpt). However, we limit our conclusions to this specific CTC treatment. FDA-approve d in-feed beef cattle CTC regimens include continuous administration, although at different CTC doses, for control of anaplasmosis, BRD, and liver abscesses. Multiple 5-d in-feed CTC treatments are legal if separated by a day of no treatment. Kanwar et al. (2014) found that short-term (final samples were obtained 4 d after the last in-feed CTC administration) bla CMY-2, bla CTX-M, tet(A), and tet(B) levels increased when feedlot cattle were first administered a dose of a veterinary 3GC, ceftiofur, followed 4 d later by three 5-d in-feed CTC administrations, with each CTC administration separated by a day. Furthermore, our laboratory recently reported that at harvest, “conventional” beef cattle feces harbored higher levels of tet(A), tet(B), and tet(M) than feces from beef cattle “raised without antibiotics” (Vikram et al., 2017). Therefore, we note that ARG profiles will show variability depending upon the treatment regimen used.
Importantly, we previously reported that cattle in the Control treatment were 28 times more likely to become sick than cattle in the CTC group (Agga et al., 2016). All morbid animals received therapeutic treatment with AMs (fluoroquinolones, macrolides, or cephalosporins), classified by the World Health Organization as more important to human health than tetracycline (WHO, 2017). Therefore, the use of these clinically important AM classes due to increased animal illness could have more harmful effects on AMR than the use of single 5-d prophylactic CTC treatment to prevent infections. Alternative weaning strategies (e.g., fence-line weaning or two-step weaning) have been proposed to reduce the stress and disease susceptibility associated with calf placement at cattle feeding operations, but few operators have adopted alternative weaning strategies due to a lack of consistent health, feed efficiency, behavioral, and financial benefits (King et al., 2006; Enríquez et al., 2010; Thrift and Thrift, 2011; Bailey et al., 2016).
We acknowledge that this study examined only 10 of the thousands of known ARGs. Sensitive methods capable of assessing levels of all ARGs are lacking. However, the qPCR method used in this study was previously demonstrated to detect ARGs more frequently than metagenomic sequencing and a commercial qPCR array of ARGs (Vikram et al., 2017). The available evidence indicates that single 5-d in-feed CTC prophylaxis for the prevention of BRD likely has minimal short-term impact and no long-term impact on AMR levels shed by cattle at commercial feedlots.
Footnotes
Acknowledgments
We thank Julie Dyer and Frank Reno for technical support. We thank Jody Gallagher for administrative assistance.
Names are necessary to report factually on available data; however, the USDA neither guarantees nor warrants the standard of the product, and the use of the name by the USDA implies no approval of the product to the exclusion of others that may also be suitable. USDA is an equal opportunity provider and employer. This work was supported by the United States Department of Agriculture, Agricultural Research Service, National Program 108—Food Safety (Project No. 3040-42000-018). The funding agency had no role in study design, data collection, and interpretation, or the decision to submit the work for publication.
Authors' Contributions
E.M., G.E.A., T.M.A., and J.W.S. designed the research. E.M., A.V., G.E.A., T.M.A., and J.W.S. performed the experiments. E.M. and J.W.S. analyzed and interpreted the data. E.M. and J.W.S. wrote the article.
Disclosure Statement
No competing financial interests exist
References
Supplementary Material
Please find the following supplemental material available below.
For Open Access articles published under a Creative Commons License, all supplemental material carries the same license as the article it is associated with.
For non-Open Access articles published, all supplemental material carries a non-exclusive license, and permission requests for re-use of supplemental material or any part of supplemental material shall be sent directly to the copyright owner as specified in the copyright notice associated with the article.