




Abstract
Microbial food safety is a persistent and exacting global issue due to the multiplicity and complexity of foods and food production systems. Foodborne illnesses caused by foodborne bacterial pathogens frequently occur, thus endangering the safety and health of human beings. Factors such as pretreatments, that is, culturing, enrichment, amplification make the traditional routine identification and enumeration of large numbers of bacteria in a complex microbial consortium complex, expensive, and time-consuming. Therefore, the need for rapid point-of-use detection systems for foodborne bacterial pathogens with high sensitivity and specificity is crucial in food safety control. Hyperspectral imaging (HSI) as a powerful testing technology provides a rapid, nondestructive approach for pathogen detection. This article reviews some fundamental information about HSI, including instrumentation, data acquisition, image processing, and data analysis—the current application of HSI for the detection, classification, and discrimination of various foodborne pathogens. The merits and demerits of HSI for pathogen detection as well as current and future trends are discussed. Therefore, the purpose of this review is to provide a brief overview of HSI, and further lay emphasis on the emerging trend and importance of this technique for foodborne pathogen detection.
Introduction
Conventional methods used for foodborne bacterial pathogen detection in food are primarily based on agar plate culturing and standard physiological and biochemical identification. These laborious and tedious processes require much time, and can produce confusing outcomes due to remarkably similar morphological, physical, and chemical features of pathogenic bacteria (Arrigoni et al., 2017).
Furthermore, the sensitivity of conventional detection methods is low with false-negative results likely to occur due to viable but nonculturable pathogens (Law et al., 2015). Current rapid detection methods are highly sensitive and specific than conventional techniques, and thus overcome the limitations associated with traditional cell culture methods (Zhao et al., 2018). These novel methods are also suitable for in situ analysis and distinction of viable cells. The detection of foodborne pathogens in raw or processed foods is essential in preventing foodborne outbreaks and requires methods sensitive enough to detect low numbers of pathogens since the risk of a single pathogen causing disease is high.
Rapid detection methods for foodborne pathogens are usually categorized into immunological, nucleic acid, and biosensor-based methods (BBMs) (Pedrero et al., 2009).
Nucleic acid methods include polymerase chain reaction (PCR), multiplex PCR (mPCR), real-time or quantitative PCR (qPCR), nucleic acid sequence-based amplification, oligonucleotide DNA microarray, loop-mediated isothermal amplification. The processing time of nucleic acid amplification methods is shortened by replacing the culture enrichment technique with the amplification of specific nucleic acid sequences (Carlson et al., 2017). However, although nucleic acid methods can provide accurate results within 24 h, they are still limited to a laboratory setting due to their intensive nature of preparing samples and the high cost of thermal cyclers (Bavisetty et al., 2018).
Immunological methods (IMs) are primarily based on antibody–antigen interactions of foodborne pathogens, and include enzyme-linked immunosorbent assay, lateral flow immunoassay, immunomagnetic separation assay, and immunoblot technique. IMs exhibit high sensitivity and specificity due to the binding-strength-specific antibody to its antigen. However, a general demerit of this method is that only antigenicity is determined, and this may vary from actual toxicity (Rohde et al., 2017). The use of instruments with a high degree of complexity as well as complex sample preparation methodology also limits the use of IMs for point-of-use applications.
BBMs for pathogen detection include a wide range of analytical techniques and are subdivided into optical biosensors, electrochemical biosensors, and mass-based biosensors (Lv et al., 2018). BBMs usually consist of a bioreceptor (detecting target analyte) and a transducer (transforms biological interactions into quantifiable electrical signals). These techniques do not require pre-enrichment procedures like nucleic acid and IMs.
Conventional microbiology over the last decade is undergoing digitization with vibrational spectroscopy, spectral imaging, machine vision, and biosensors gaining prominence in the area of food safety and quality analysis (Puchkov, 2016). Their ability to provide nondestructive, fast, rapid, and online results makes them convenient and inexpensive to use (Gowen et al., 2015). The ability to retrieve visual data from microbial specimens for pathogen detection, as well as discriminating against them by employing their unique spectral signatures opens new ways for microbial studies.
Hyperspectral imaging (HSI) offers a combination of light spectroscopy and image analysis with a wide range of applications from remote sensing, forensic science, biomedical applications, and food safety and quality control (Liu et al., 2017). Spectral imaging collects data from three dimensions—two spatial (x, y) and one spectral (λ), resulting in an (x, y, λ) dataset, which is typically referred to as a datacube (Gao and Smith, 2014). Spectral imaging depending on the number of spectral bands, spectral resolution, and the continuousness of the collected spectrum is mainly divided into multispectral imaging and HSI (Gao and Smith, 2014).
The use of HSI in food safety control has increased tremendously with several applications ranging from food adulteration detection (Wu et al., 2013a; Huang et al., 2016; Forchetti and Poppi, 2017), authenticity (Kamruzzaman et al., 2012; Su et al., 2016), discrimination (Romaniello and Baiano, 2018; Vermeulen et al., 2018), firmness (Leiva-Valenzuela et al., 2013; Fan et al., 2015; Xie et al., 2018), bruises (Keresztes et al., 2017; Ye et al., 2018), texture (Reis et al., 2018), ripeness (Wei et al., 2014) and marbling (Huang et al., 2017; Velásquez et al., 2017), pH (Liu et al., 2014), TVBN (Cheng et al., 2017; Lee et al., 2018), and over several food categories such as fish products (Skjelvareid et al., 2017), meat products (Khulal et al., 2016), and plant products (Zhou et al., 2018).
The purpose of this review is to provide insights into the application of HSI as a rapid, online, and nondestructive tool for the detection, characterization, and discrimination of foodborne bacterial pathogens of public health significance. It is our utmost desire that this review will guide and spur on researchers in food microbiology to apply HSI for pathogen detection.
HSI Instrumentation
HSI is a spectroscopic method, combining digital imaging with conventional spectroscopy (Vejarano et al., 2017). Initially, HSI was designed as a remote sensing tool for planetary science, astronomy, and environmental monitoring. It was successfully applied in the early 90 s for the conservation of cultural heritage and arts (Pan et al., 2017). More recently, HSI technology has been deployed across many fields of study such as agriculture, food, medicine, and the pharmaceutical industry because it is inexpensive and provides rapid online assessment for product and process control validation.
Light sources
The HSI instrument as shown in Figure 1 consists mainly of a light source that generates light to provide illumination for the target; typical light sources include light emitting diodes, halogen lamps, tunable light sources, and lasers.

Schematic view of hyperspectral imaging system by Li et al. (2016).
Wavelength dispersion devices
Wavelength dispersion devices are essential for the HSI systems using broadband illuminating light sources. Their primary function is to disperse broadband light into different wavelengths. Typical devices include liquid crystal tunable, acousto-optical tunable filters (AOTFs), filter wheels, Fourier-transform imaging spectrometers, imaging spectrographs, and single-shot imagers.
Area detectors
Two types of solid-state area detectors are charge-coupled device (CCD) and complementary metal-oxide-semiconductor (CMOS) cameras. Their primary function is to quantify the light intensities acquired by converting incident photons into electrons. CCD and CMOS consist of photodiodes manufactured from light-sensitive materials to change radiation energy into an electrical signal.
Data Acquisition Technologies
Push broom and whisk broom scanners are the two main branches of spectral imagers with the ability to read images over time with snapshot HSI employing a starring array for producing instant images.
Three-dimensional hyperspectral image cubes (x, y, λ) are usually acquired using line scanning, point scanning, area scanning, and the single-shot method as shown in Figure 2, with scanning directions illustrated by arrows and gray areas representing data acquired each time. The details are described by Wu et al. (2013c).
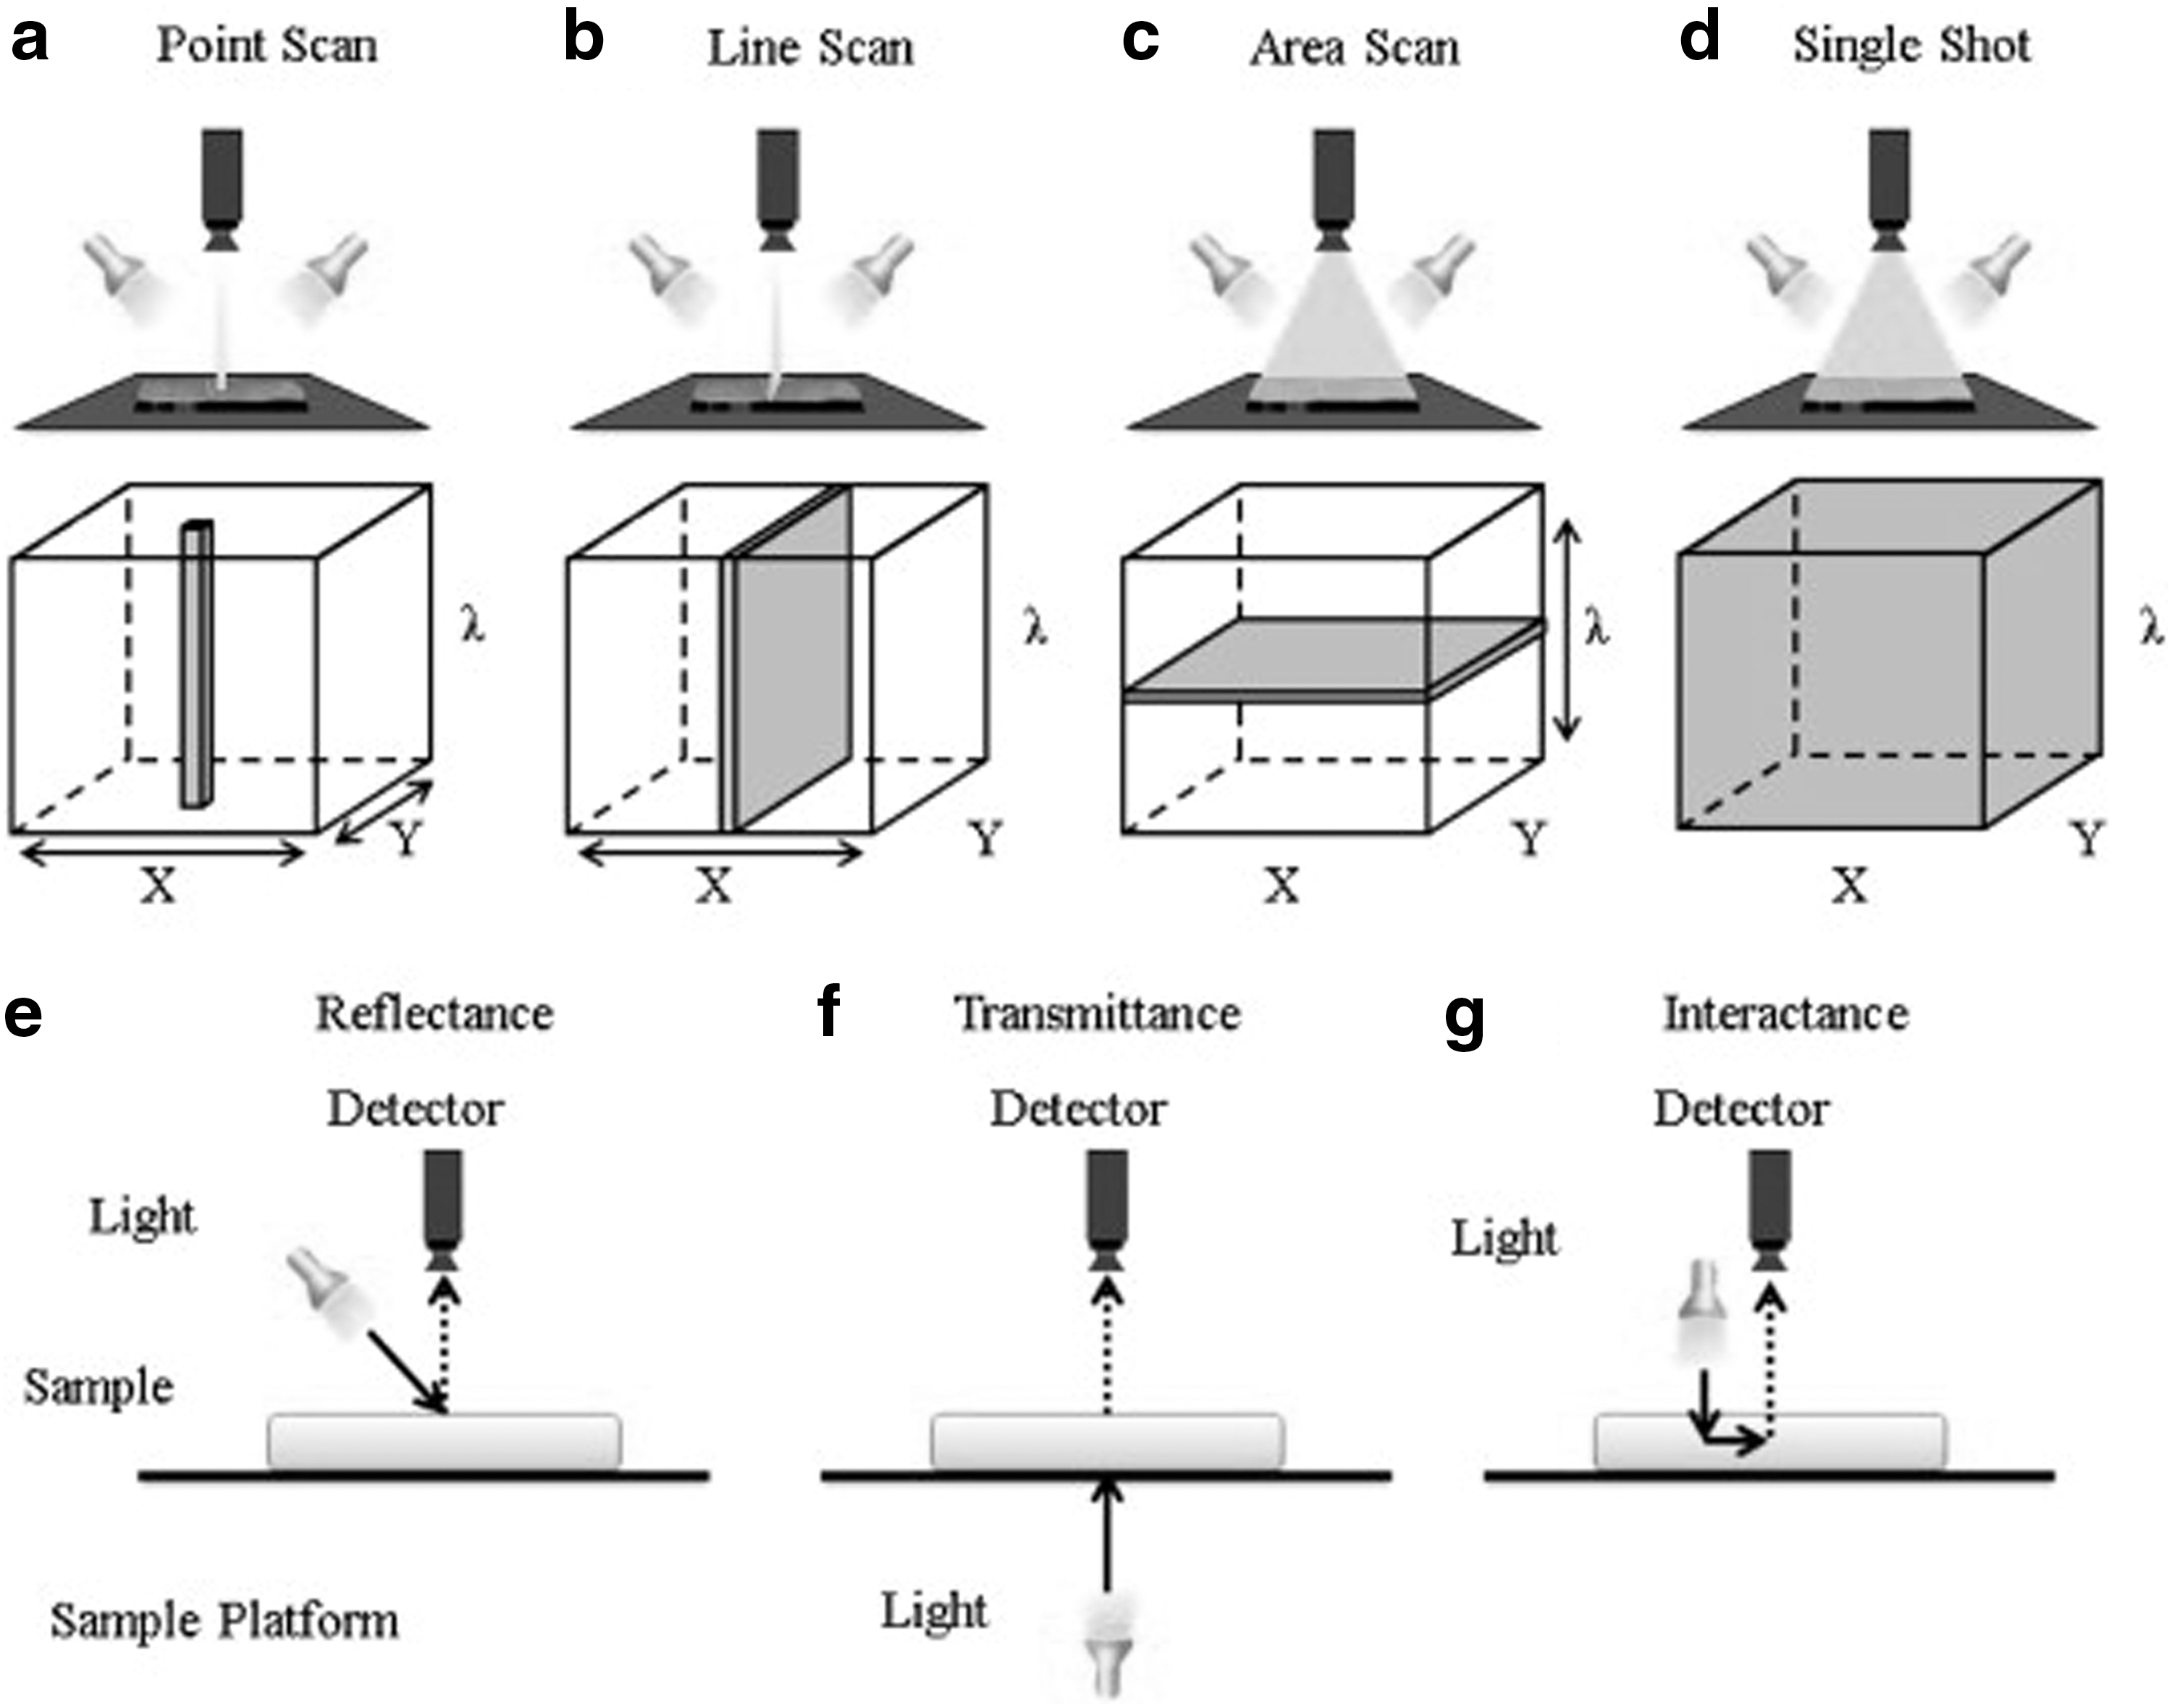
Hyperspectral image acquisition approaches and image sensing modes (labels
The decision to select a particular acquisition technique to employ is influenced by the specific application, viewing that each technique has context-dependent advantages and disadvantages. Line (push broom) and point (whisk broom) scanning are both spatial scanning techniques. Line scanning allows for scanning materials moving on a conveyor belt. A major drawback for line scanners is that the images are analyzed per line.
Most HSI applications in the food industry follow the line scanning acquisition technique (Ma et al., 2019).
Although the single-shot technique is the fastest and acquires all spectral and spatial information with just one exposure, it is limited in its application in the food industry due to its inability to meet the exact resolution needed (Nicolaï et al., 2007). Area scanning, on the contrary, has the advantage of being fast when using selected wavelengths with the ability to pick and choose spectral bands; however, spectral smearing can arise as a result of movements within the scene, thus, invalidating spectral correlation and detection.
Image Processing Methods
Commercially available software tools such as Environment Visualizing Images (ENVI) software (Research Systems, Inc., Boulder, CO), Unscrambler (CAMO PROCESS AS, Oslo, Norway), and MATLAB (The Math-Works, Inc., Natick, MA) are usually used for HSI processing. Image processing typically involves reflectance calibration, image enhancement, spectral preprocessing, image segmentation, object measurement, multivariate analysis, optimal wavelength selection, model evaluation and visualization (Wu and Sun, 2013b).
Chemometrics for Hyperspectral Image Processing
The prediction accuracy of the HSI detection method is determined by the association between the quality characteristics and its hyperspectral data. This relationship is established using chemometric algorithms. Overall, there are several algorithms (Fig. 3) used for model establishment for a particular study, with different algorithms predicting the same attribute and achieving varying degrees of detection accuracies due to variations in preprocessing methods and number of samples used. Similar morphological expressions occurring within a species due to microbial biodiversity pose another challenge (Wang et al., 2018). To surmount these challenges, algorithms designed for optimal and informative pathogen wavelength selection across the complete wavelength range such as invasive weed optimization (IWO), genetic algorithm, competitive adaptive reweighted sampling (CARS), and successive projections algorithm have been employed with great success (Feng et al., 2018b).
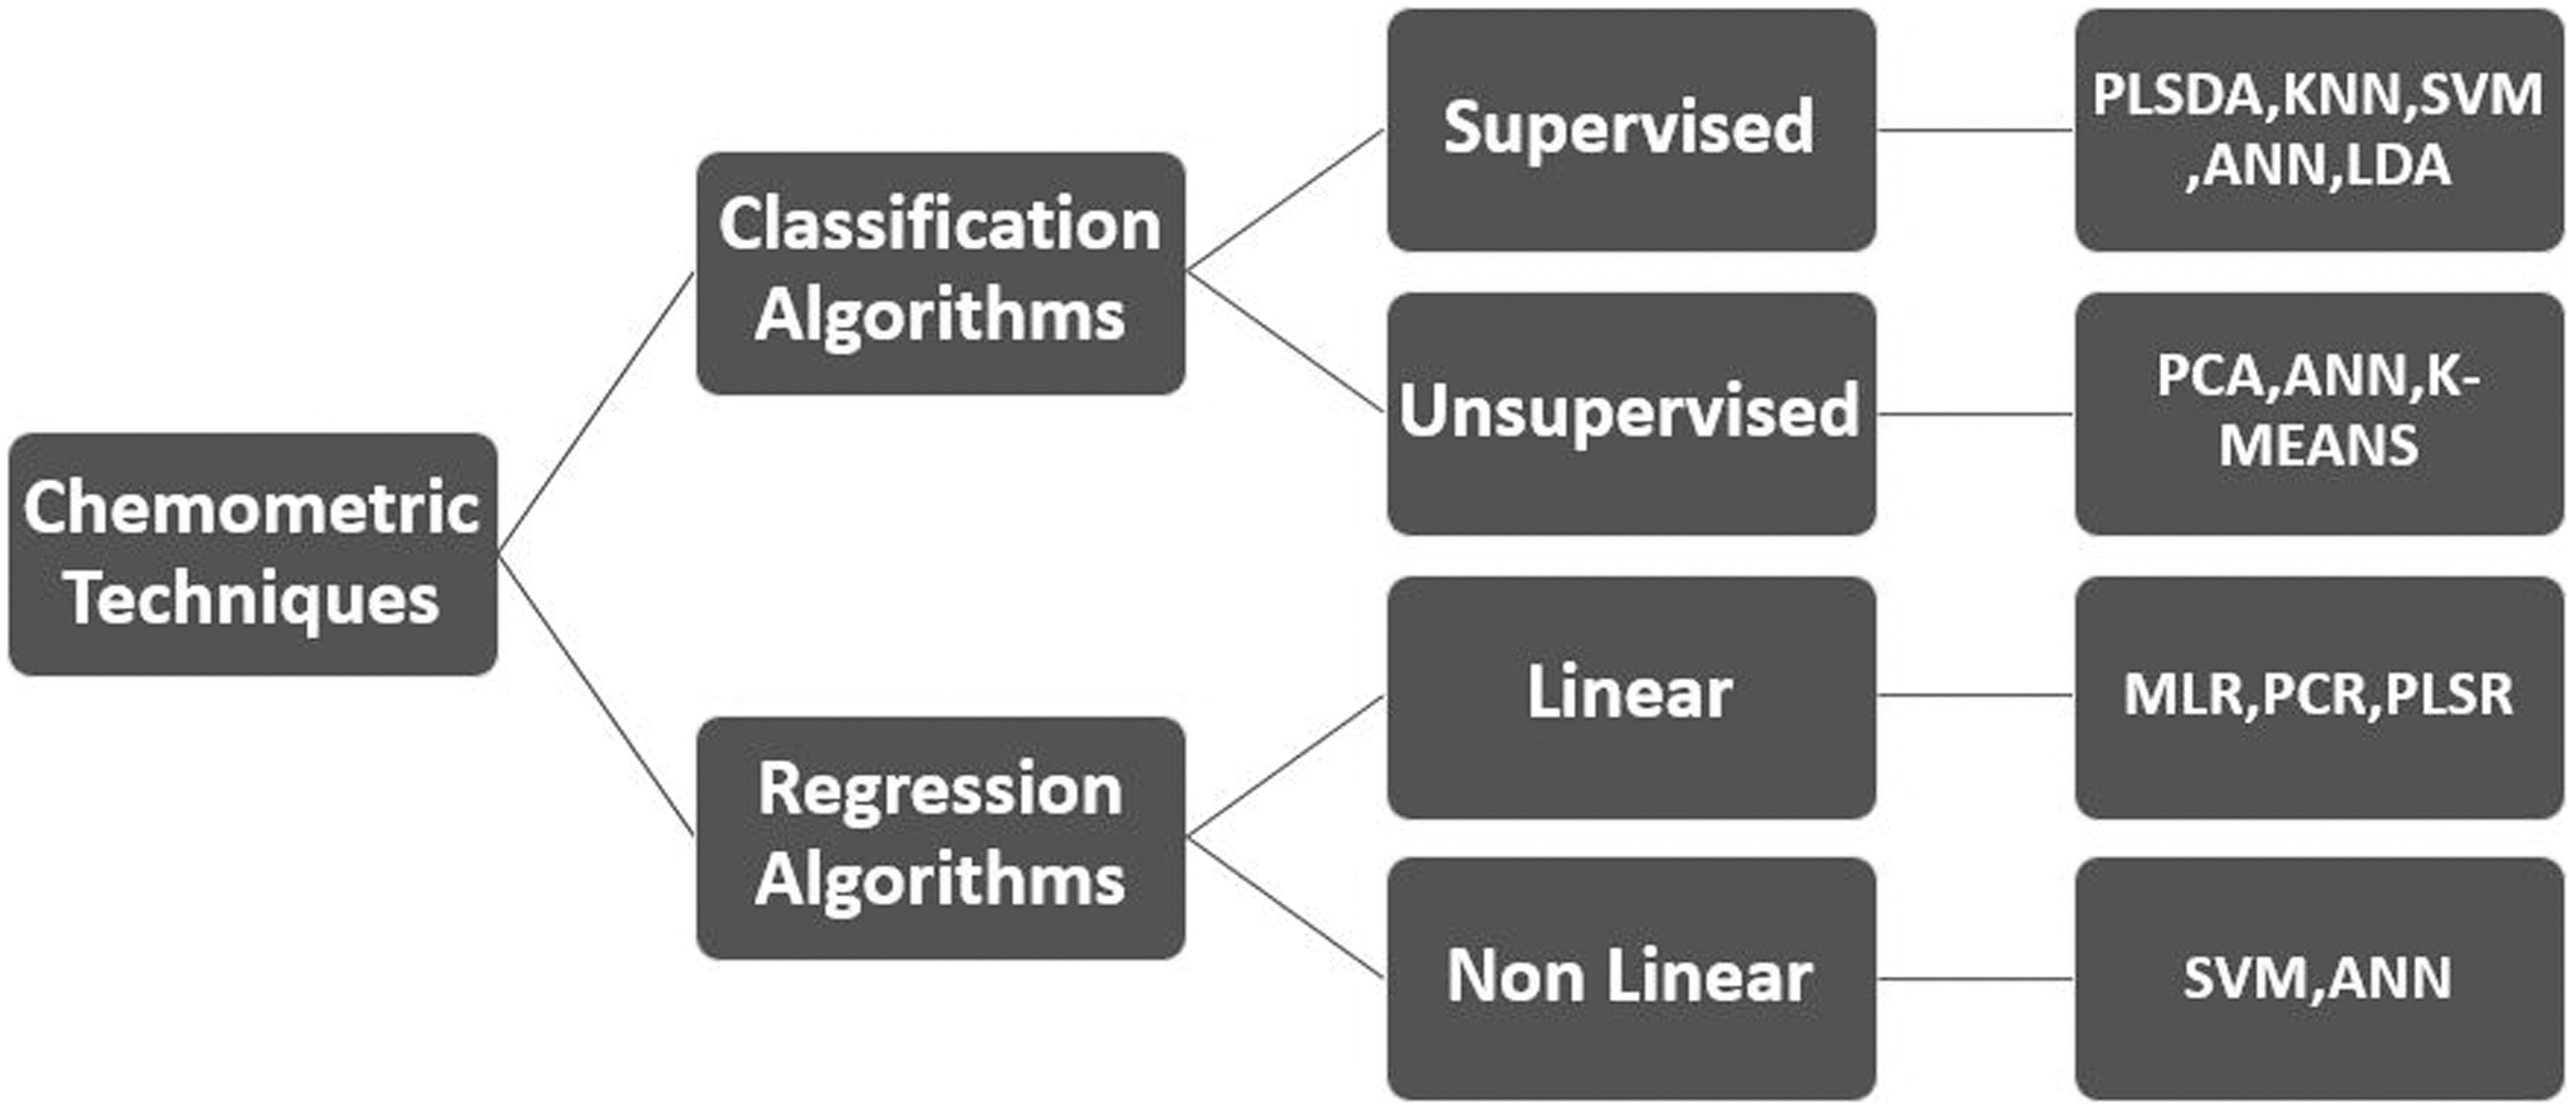
Classification of chemometric modeling algorithms in hyperspectral data analysis adopted from Pan et al. (2016).
Recent Applications of HSI in Food Microbiology
Fundamental studies in which HSI is used to study microorganisms of public health concern have been performed extensively. HSI applies chemical imaging for microbial characterization as well as gaining information on the biochemical processes relevant to the microorganism (Gowen et al., 2015). The detection of spoilage and pathogenic (main discussion) microorganisms has been performed using HSI with various chemometric tools. HSI has been applied in the detection of spoilage microorganisms by measuring total viable counts (Huang et al., 2013; Khoshnoudi-Nia et al., 2018), and in the detection of foodborne parasites (Coelho et al., 2013) and fungal infections (Karuppiah et al., 2016; Pieczywek et al., 2018; Siedliska et al., 2018).
Food pathogen detection and identification
Microbial identification and characterization are critical in food safety and biosecurity, and in the clinical environment for monitoring and foodborne disease surveillance and prevention. Bacterial identification of a species usually involves sample acquisition/preparation, microbe detection, and microbe identification. HSI delivers a reagent-free pathogen identification technique that provides an enhanced, low-cost method for monitoring microbial species in a variety of situations.
The application of HSI for pathogen detection has been made on various sample matrixes, including bacteria grown on agar plates, bacteria present on food surfaces or biofilms (attached to food contact surfaces such as aluminum or stainless steel plates). A detailed detection and classification of foodborne pathogens are shown in Table 1.
Recent Studies on Food Pathogen Detection by Hyperspectral Imaging from 2010 to 2018
ANN, artificial neural network; CARS, competitive adaptive reweighted sampling; GA, genetic algorithm; HSI, hyperspectral imaging; IWO, invasive weed optimization; kNN, k-nearest neighbor; LDA, linear discriminant analysis; MD, mahalanobis distance; MLR, multilinear regression; PCA, principal component analysis; PLSR, partial least-squares regression; PLS-DA, partial least-squares discriminant analysis; QDA, quadratic discriminant analysis; SVM, support vector machine; SPA, successive projections algorithm; VNIR, visible near-infrared spectroscopy.
A rapid method based on HSI was deployed by Siripatrawan et al. (2011) for the detection of Escherichia coli in packaged fresh spinach. Savitzky–Golay was used in pretreating the reflectance data with principal component analysis (PCA) and artificial neural network (ANN) used for preprocessing. Results from the study showed a strong correlation between hyperspectral data and the number of E. coli cells.
Salmonella enterica serovar Typhimurium ATCC 536 and E. coli O157: H7 strain 3704 biofilms on stainless steel food contact surfaces were investigated with fluorescence imaging by Jun et al. (2009). PCA was performed, and principal component (PC2) image showed the most distinct morphological differences between E. coli and Salmonella biofilms. The emitted fluorescence was mainly in the blue wavelength region range of 480 nm. In a similar study by Jun et al. (2010), macroscale fluorescence imaging was employed to successfully detect E. coli O157: H7 and Salmonella biofilms on five food contact material surfaces with an overall detection rate of 95%. E. coli O157: H7 and Salmonella emitted fluorescence mainly in the blue to green wavelengths regions at a maximum emission range of 480 nm.
Tao et al. (2012) investigated the use of hyperspectral scattering technique in determining E. coli contamination. A multilinear regression (MLR) model built using parameters developed from a Lorentzian distribution function showed an RCV of 0.841 and 0.877 for the “a&b&c” (a - = asymptotic value, b = peak value, and c = full-width at b/2) parameters used to build the model. In a similar study, Tao and Peng (2014) reported a rapid determination of E. coli contamination in pork meat using the Gompertz function together with HSI technique. Gompertz parameter outperformed other individual parameters with validation results (RCV) of 0.939 for E. coli contamination.
Cheng et al. (2015) achieved successful quantification and visualization of E. coli (4.11–10.02 log10 CFU/g,) in grass carp fish flesh. Partial least-squares regression (PLSR) model (full wavelength) and a much simplified MLR model (six wavelengths) revealed a residual predictive deviation (RPD) of 5.47 and 5.22 with R 2 p = 0.880 and 0.870, respectively. The MLR models were successfully used for visualizing the E. coli loads on the carp fish flesh.
Yoon et al. (2010) achieved 97–99% detection accuracy for Campylobacter colonies on agar media by HSI. The application of band ratio algorithm was vital in the detection of the colonies by removing 426 and 458 nm spectral bands from continuum-removed spectra.
Identification of Staphylococcus species through hyperspectral microscope imaging with partial least-squares discriminant analysis (PLS-DA) and support vector machine (SVM) models was studied by Seo et al. (2016). Results from the study showed classification accuracies and kappa coefficients of 97.8%, 0.97 and 89.8%, 0.87 for SVM and PLS-DA, respectively.
The effectiveness of AOTF-based hyperspectral microscope imaging system in the characterization of foodborne pathogen spectra was analyzed by Park et al. (2012a) using Salmonella Enteritidis and E. coli biofilms. The intensity of spectral images at 546 and 800 nm distinguished E. coli and S. Enteritidis, respectively. The study suggested the selection of ground truth region-of-interest pixels for spectrally pure fingerprints when classifying unknown pathogens. The use of multiple exposures and neutral-density filters for image acquisition for intensity comparison accuracy was also proposed.
Lasch et al. (2018) proposed a new method based on FT-IR HSI and ANN analysis for foodborne pathogen detection. This method shortens the cultivation step of bacteria under standardized settings with subsequent transfer of the microcolony imprints onto IR transparent CaF2 windows using a replica technique.
Eady et al. (2018b) conducted a comparative study for Salmonella detection by HSI and real-time PCR (RT-PCR). Quadratic discriminant analysis (QDA) yielded an improved classification accuracy (81.8–98.5%) with sensitivity and specificity results of 1 and 0.963, respectively. Results proved the potential of hyperspectral microscopic imaging (HMI) as an initial microbial confirmation tool than RT-PCR.
Shi et al. (2019) employed a noise-free microbial colony counting method to successfully count colonies of Bacillus subtilis plated on agar using hyperspectral image features for calibration. Cho et al. (2017) successfully demonstrated the potential of hyperspectral fluorescence imaging in characterizing E. coli (2.6 × 10⁴ to 2.6 × 10⁸ CFU/mL) biofilm formations on the surface of baby spinach leaf. Ultraviolet (UV-A) excitation detected E. coli biofilm formations in their early stages and differentiated them successfully from the control samples.
A classification model was developed by Seo et al. (2013) for the detection of Salmonella from poultry carcass rinses by visible near-infrared spectroscopy (VNIR)-HSI. Five machine learning algorithms; SVM. k-nearest neighbor (kNN), Mahalanobis distance (MD), QDA, and linear discriminant analysis (LDA) were used for calibration and validation. Average classification accuracy for calibration set of all 10 models was 98% and 99% BGS agar plates and XLT4 agar plates respectively, while for the validation set the classification accuracy was 83.73% and 94.45% with and without PCA for all 10 models. QDA (98.65%) was the best classification model without PCA.
Foodborne pathogen detection based on reconstructing a hyperspectral image using RGB color was presented by Yoon et al. (2014). PCA and kNNs models resulted in a classification accuracy of 92% and 99% using original hyperspectral images. HSI deploying a color camera was applied for the detection of Shiga toxin–producing E. coli (STEC) serogroups grown on rainbow agar by Yoon et al. (2015). Color images from a digital single-lens reflex (DSLR) color camera together with hyperspectral images were used for this study. PLSR was more effective than polynomial multivariate least-squares regression with a classification accuracy of 90% measured from a group of independent sets.
Park et al. (2012b) employed an AOTF-based HMI together with SVM and sparse kernel-based ensemble learning algorithms for the detection of Non-O157: H7 STEC strains, achieving a 92% detection accuracy for STEC serotype O45.
Characterization and differentiation of foodborne pathogens
Serotyping of bacterial foodborne pathogens allows for determining species and subspecies. This distinct variation within species of bacteria is classified based on their unique cell surface antigens. This is crucial in diseased surveillance since it allows for the epidemiologic classification of organisms to the subspecies level.
Hyperspectral microscope with an AOTF together with SVM and support vector machine regression (SVMR) models was successfully employed to classify Salmonella serotype Typhimurium, Salmonella serotype Heidelberg, Salmonella serotype Enteritidis, Salmonella serotype Infantis, and Salmonella serotype Kentucky from poultry carcass rinses by Eady and Park (2015). SVM model showed a classification accuracy of 100%, with SVMR showing R 2 cv calibration and validation values >0.922 and a smaller RMSEV 0.001(20 bands) and 0.002 (12 bands).
In a comparative study conducted by Eady and Park (2015), HMI using tungsten halogen and metal halide as lightning sources was employed for the detection of five Salmonella serotypes from chicken. PC-LDA achieved classification accuracies of 100% for both lightning sources as well as an RMSECV of 0.014 and an R 2 > 0.948 using principal components regression models.
In a more recent study, individual foodborne bacteria were successfully classified by Eady and Park (2018a) from a mixture of bacteria cultures (Staphylococcus aureus, Salmonella Typhimurium, Listeria innocua, and E. coli). k-means divisive cluster analysis was employed for unsupervised classification with a classification accuracy of 91.92% and 100% (700 bacteria cells), with >97% accuracy generated when six of seven hyperspectral microscope image sets were utilized.
Kammies et al. (2016) applied NIR-HSI together with PCA and PLS-DA models to differentiate foodborne bacteria (E. coli, S. aureus, Salmonella Enteritidis, and S. epidermidis) grown on agar plates. Lipid content, protein structures, and teichoic acid content were the primary sources of variation and differentiation of the images analyzed. The study showed the possibility of using this technique for successful differentiation of Gram-positive and negative bacteria, discriminating between pathogenic and nonpathogenic bacteria as well as bacteria with similar color characteristics.
A classification model based on VNIR-HSI was developed to differentiate E. coli (STEC) serogroups O26, O45, O103, O111, O121, and O145 on mixed (Yoon et al., 2013b) and pure (Yoon et al., 2013a) culture plates. The results showed overall detection accuracy of 95% and 97% at the pixel and colony level, respectively, for mixed cultures, while a 95.06% classification accuracy was achieved using PCA–kNN algorithm for pure culture analysis.
E. coli (STEC) serogroups (O26, O45, O103, O111, O121, and O145) regarded as adulterants in raw beef by the U.S. Department of Agriculture Food Safety Inspection Service (USDA-FSIS) were successfully detected and classified on rainbow agar O157 by Windham et al. (2013) using VNIR-HSI. The overall classification accuracy was 98% with specificity and sensitivity of 98% and 78% to 100%, respectively, due to lower false-positive (1.2%) and false-negative (22%, 7%, and 8%) rates.
Nine morphological features were investigated for foodborne bacteria classification by Seo et al. (2017). Perimeter, equivalent circular diameter, extent, eccentricity, solidity, orientation, maximum and minimum axial length unique features were calculated at a wavelength of 570 nm with 89 wavelengths based on peak scattering intensity selected for SVM classification. Gram-negative and Gram-positive bacteria were successfully classified with 82.9% accuracy and a kappa coefficient score of 0.65. A lower score for decision tree algorithm (80.0%) and SVM (72.5%) algorithm classification of Salmonella Typhimurium, S. aureus, E. coli, Enterococcus faecalis, and Enterobacter cloacae suggested a limitation on the use of morphological features alone for pathogen classification.
Eady et al. (2018c) indicated that spectral normalcy from single-cell regions of interest was essential for comparing bacterial cell images for HSI. Feng et al. (2018b) applied IWO for classifying E. coli, Listeria monocytogens, Listeria seeligeri, and S. aureus on agar plates. IWO-SVM model showed an overall classification accuracy of 100.0% (calibration) and 97.0% (prediction) for full-wavelength classification with a simplified model based on CARS wavelength feature selection, yielding an overall classification accuracy of 97.2% (calibration) and 96.0% (prediction). IWO was a valuable tool for improving calibration models.
Future trends and challenges
HSI is a comparatively new technology in foodborne pathogen detection. It has been successfully used as a principal source of information for the identification of several bacterial species and colonies, although in limited experimental laboratory settings. HSI is much suited for statistical analysis and automation, thus providing an objective assessment of bacterial species than conventional microbial techniques. It must be noted that HSI as an advanced tool cannot replace trained microbiologists or conventional microbial techniques but rather assist them in providing a more rapid, noninvasive online detection of foodborne pathogens (Feng et al., 2018a).
HSI generates large amounts of data slowing down data processing speed. Future research into identifying optimal wavelengths would enhance better performance and make HSI more suitable as an online detection tool. A significant limitation of HSI for pathogen detection is its inability to quantify low concentrations of microorganisms with most studies using higher than 102 CFU/g microbial densities for assessment. Advanced studies into establishing unique spectral signatures for various foodborne pathogens to allow for discrimination between pathogens and their strains would further enhance the applicability of this technology (He et al., 2015).
The optimization of existing models as well as developing fit-for-use HSI models for pathogen classification that fuses spatial and spectral data, without running the risk of losing valued information would be a game changer for HSI. Low penetration depth hinders HSI from extracting spectral information from food samples, especially in meat, therefore detecting specific spectral bands associated with the chemical signatures within the regions of interest with or developing technologies that aid in providing spectral penetration depth for HSI to overcome this challenge (Xiong et al., 2014). Upcoming research on HSI could center on topics relating to increasing the resolution and sensitivity of cameras, enhancements in data processing methods, as well as increasing detection accuracy. Also, further studies are required for automating quantitative assessment of target bacteria with background microflora.
HSI delivers a reagent-free pathogen identification technique at a low-cost method for monitoring microbial species in a variety of situations. The application of HSI as a high-throughput pathogen-screening technology for online monitoring and inspection of food manufacturing operations as well as for multipathogen and multisample product screening is foreseeable in the near future. This will increase efficiency and decrease the cost of screening by testing a product for multiple pathogens as opposed to single analyte detection at a time from conventional methods (Kamruzamman et al., 2015).
The commercial application of HIS for routine use is however limited and not available at present for food monitoring. Nonetheless, technological advancements such as algorithms for informative wavelength selection and miniaturization of equipment will move HSI closer to commercialization and routine use.
Conclusion
The application of HSI as a rapid, online, and nondestructive application tool for pathogen detection provides superior results by combining the merits of traditional spectroscopy and computer vision. In this review, the applications of HSI in pathogen detection of various food matrixes are summarized. Research opportunities for the improvement of HSI for pathogen detection are envisaged to enable valued applications in the food industry.
Footnotes
Acknowledgment
This work was supported by the National Key Research and Development Program of China (No. 2017YFD0400100).
Disclosure Statement
No competing financial interests exist.