
Abstract
Fecal bacteria, which reside in the gastrointestinal tract of cattle, can contaminate beef carcasses during processing. In beef cattle slaughter plants, the presence and concentrations of generic Escherichia coli, coliforms, Enterobacteriaceae (EB), and total aerobic bacteria are monitored as indicator organisms of fecal and environmental contamination. The objectives of this study were as follows: (1) to determine the concentrations of generic E. coli, coliforms, EB, and aerobic bacteria on beef carcasses at different processing points in Midwestern commercial beef slaughter plants during the summer, spring, and fall seasons; and (2) to estimate bacterial transfer on carcasses during the hide removal and evisceration processes. Hide and carcass surface sample swabs were collected from slaughtered cattle at four large commercial processing plants. At each plant visit (3 visits to each of the 4 plants) and during 3 seasons, 20 samples were collected at 5 points: hide-on (hide of animal near exsanguination pit), hide-off carcass, pre-evisceration carcass, postevisceration carcass, and postintervention carcass, for a total of 3600 samples. Bacterial concentrations were determined using 3M™ Petrifilm™ plates. Associations between season and processing plant with concentrations of E. coli, coliforms, EB, and total aerobic bacteria, overall, between hide-on and hide-off, and between pre- and post-evisceration, were evaluated using multilevel mixed-effects linear regression models. Bacterial concentrations on beef carcasses significantly decreased throughout processing. Moreover, hide removal was an important source of carcass contamination, given bacterial concentrations detected on hide-off carcass samples were the highest, and bearing in mind that carcass muscle surfaces should be sterile. Results from this study indicate that the interventions applied by the processing plants were effective, as they probably contributed to the significant reduction of bacterial concentrations of carcasses.
Introduction
The assessment of enteric contamination and overall production hygiene in meat processing plants is carried out using indicator organisms as a surrogate measure for Shiga toxin–producing Escherichia coli (STEC), as well as other foodborne pathogens (Arthur et al., 2004; Ghafir et al., 2008; EFSA, 2012; Wang et al., 2013; Barco et al., 2015), given the numbers of pathogens are usually too low to be detected (Brown, 2000; Jay, 2000). Because contamination is mostly of fecal origin and indicator organisms are generally present in higher numbers in the slaughterline, their detection is an effective tool for hygiene validation (Arthur et al., 2004; Ghafir et al., 2008; EFSA, 2012; Wang et al., 2013; Barco et al., 2015).
Contamination of beef carcasses originates either by exposure of the gut contents of the slaughtered animal, or from hides, reported to be the major source of bacterial contamination of carcasses during processing (Barkocy-Gallagher et al., 2001, 2003; Bosilevac et al., 2005; Arthur et al., 2007; Barco et al., 2015). Traditional indicator organisms, usually E. coli and Enterobacteriaceae (EB), can be quantified after the implementation of specific interventions aimed at decreasing bacterial load (Castillo et al., 1998; Dormedy et al., 2000; Busta et al., 2003; Gill and Badoni, 2004). Thus, it is possible to evaluate the efficacy of postharvest interventions applied throughout the processing line, as well as efficiently estimate hide-to-carcass transfer of bacterial contamination by monitoring the levels of coliforms and EB counts as well as of aerobic plate counts (APC) (Brichta-Harhay et al., 2008; Wang et al., 2013). Therefore, in this study we proposed the following: (1) to quantify the concentrations of generic E. coli, coliforms, EB, and aerobic plate bacteria on beef carcass surface samples at different processing points throughout slaughter in four commercial processing plants and in different seasons; and (2) to estimate the bacterial transfer that occurs during the hide removal and evisceration processes.
Materials and Methods
Study population and sample collection
Plant eligibility criteria included the following: (1) medium to large (>500 employees) commercial meat slaughter facilities, (2) located in Midwest United States, where most cattle are fed, and (3) willingness to host a team of at least six individuals needed to collect samples at different processing points.
Hide-on and carcass surface samples were collected from beef cattle carcasses at four large commercial cattle processing plants in the Midwest region of the United States (in the states of Texas, Nebraska, and Kansas). Each plant was visited three times during summer (June and July 2015), fall (October and November 2015), and spring months (March and April 2016). At each plant visit, 20 hide and carcass surface samples were collected at each of the following sampling points throughout processing: hide-on, hide-off, pre-evisceration, postevisceration, and just before entry of carcass into the cooler.
Hide-on samples were collected from hide surfaces after cattle were exsanguinated and before entering the hide wash cabinet (if applicable). Hide-off samples were collected from the carcass surface immediately after hide removal. To determine bacterial transfer due to the hide removal process, hide-on and hide-off samples were collected from opposite sides (right or left) of the same carcass. Pre-evisceration carcass surface samples were collected immediately before the evisceration process, and postevisceration samples were collected immediately after evisceration. To determine transfer during the evisceration process, pre- and postevisceration samples were collected from the same carcass, but from opposite sides (right or left), with no carcass washes or interventions (except for the evisceration process itself) being applied between sampling points. Postintervention samples were collected after all in-plant interventions were applied (and from carcasses not sampled in prior sampling points) and immediately before the carcasses entered the cooler (hot box). Hide-off, pre-evisceration, postevisceration, and postintervention samples are referred to as carcass samples (as opposed to hide samples) throughout this article.
The sampling area consisted of a 30 cm wide × 91 cm long (∼2730 cm2) surface, from brisket to umbilicus and from midline to elbow. Samples were collected using Speci-sponges® (Nasco, Fort Atkinson, WI) soaked in 35 mL of Butterfield's buffer (Hardy Diagnostics, Santa Maria, CA) with 0.1% Tween 20 (Fisher Scientific, Pittsburg, PA). Ten two-direction strokes (five strokes per sponge side), up and down or side to side, were applied during sampling. After randomly selecting the first carcass, every 10th carcass was tagged, until reaching 20 carcasses in each sampling point.
Sponges, inside labeled Whirl-Pak® bags (Nasco), were placed in a cooler with ice packs immediately after collection and transported to the Kansas State University (KSU) College of Veterinary Medicine (CVM) Pre-Harvest Food Safety Laboratory and processed within 24 h.
E. coli, coliforms, EB, and aerobic bacterial concentrations
Sponges were squeezed in the Whirl-Pak to remove the buffer-Tween mix solution. Ten milliliters of the sample was transferred to a glass test tube and vortexed. Samples were serially diluted to obtain dilutions of up to 10−6 for hide-on samples and up to 10−5 for all carcass samples (hide-off, pre-evisceration, postevisceration, and postintervention). One milliliter aliquots of the diluted samples were plated in duplicate on 3M™ Petrifilm™ plates: E. coli/coliform (EC; Cat. No. 6404; 3M Microbiology, St. Paul, MN), EB (Cat. No. 6420; 3M Microbiology), and aerobic bacterial plates (APC; Cat. No. 6400; 3M Microbiology). Different dilutions of each sample were plated on each plate type depending on the expected concentration of each bacterium. For hide-on samples, dilutions of 10−1, 10−2, and 10−3 were plated on EC plates, dilutions of 10−2, 10−3, and 10−4 were plated on EB plates, and dilutions of 10−3, 10−4, 10−5, and 10−6 were plated on APC plates. For carcass samples, dilutions of 100, 10−1, and 10−2 were plated on EC and EB plates and dilutions of 100, 10−1, 10−2, 10−3, 10−4, and 10−5 were plated on APC plates.
Plates were incubated at 37°C for 24 h (EC and EB plates) or 48 h (APC plates) before enumeration. The EC and APC plates were enumerated using the 3M Petrifilm Plate Reader (Cat. No. 6499; 3M Microbiology). Enumeration of the EC was based on counting the blue colonies with gas production and red colonies with gas production for E. coli and non-E. coli coliforms, respectively, whereas enumeration of aerobic bacteria on APC plates consisted of counting all red colonies. The EB plates were enumerated manually by counting red colonies with a yellow halo or associated with gas production. The 3M Petrifilm plates were considered enumerable if there was at least one colony of the targeted organisms per plate. The countable ranges of the 3M Petrifilm plates were 15–150 colonies, 15–100 colonies, and 25–250 colonies for EC, EB, and APC plates, respectively.
Counts were recorded and averaged between the two replicates available as per each dilution. Calculation of colony-forming units (CFUs) per mL across dilutions followed USDA MLG 3.02 guidelines (United States Department of Agriculture, Food Safety and Inspection Service, 2015). To determine the final counts of CFUs per 100 cm2, the following formula was used:
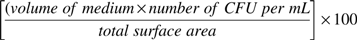
where the volume of the Butterfield's buffer medium was 35 mL, the number of CFU/mL was calculated as described above, and the total surface area was 2730 cm2. The detection limit of the 3M Petrifilm was 0.11 log10 CFU/100 cm2.
Statistical analyses
Statistical analyses were conducted using Stata 12 (StataCorp LP, College Station, TX). A sample was considered enumerable if at least one colony was observed on the 3M Petrifilm. The percent of enumerable samples was calculated as the number of enumerable samples divided by the number of total samples collected per sampling point, per season, and per processing plant. A test of equality of proportions using a chi-square test was used to compare the proportion of enumerable samples between sample types, within bacteria, across seasons or across plants.
E. coli, coliforms, EB, and APC concentrations of enumerable plates were log transformed (log10 CFU/100 cm2) and summarized (number and percent of enumerable samples) overall, per study season, and per processing plant. Associations between season and processing plant with the concentration of E. coli, coliforms, EB, and APC were evaluated using multilevel mixed-effects linear regression models (xtmixed procedure in Stata) with a Gaussian family, identity link, and restricted maximum likelihood estimation. Dependent variables consisted of (1) concentration of E. coli, (2) concentration of coliforms, (3) concentration of EB, and (4) concentration of APC, all log transformed (in log10 CFU/100 cm2); independent variables tested included sampling point (hide-on, hide-off, pre-evisceration, postevisceration, and postintervention), season (summer, fall, and spring), and processing plant (plants 1–4). Independent models were run for each bacterial outcome (E. coli, coliforms, EB, and APC). Model building consisted of the evaluation of unconditional associations of each of the independent variables with each of the outcomes, followed by inclusion of two-way interaction terms between sampling point and plant, and sampling point and season, followed by removal of nonsignificant variables (p > 0.05), in a backward manner, in a multivariable main-effects model. Depending on the independent variables tested in the final model, season, processing plant, or week of sampling was included as random intercepts in all models to account for the clustering of samples collected within plants and week of sampling, and of plants sampled within season.
Likewise, associations between hide-on and hide-off, and between pre- and postevisceration samples for concentrations of E. coli, coliforms, EB, and APC were evaluated using multilevel mixed-effects linear regression models with a Gaussian family, identity link, and restricted maximum likelihood estimation. Outcomes consisted of E. coli, coliforms, EB, and APC concentrations of hide-off carcass samples, whereas independent variables consisted of E. coli, coliforms, EB, and APC concentrations of hide-on samples, respectively, and season (summer, spring, or fall), as it was considered an a priori confounder of this association. Week of sampling and plant were included in the model as random intercepts. The linearity assumption between each bacterial concentration of hide-on samples and concentration of hide-off samples was evaluated using a locally weighted regression plot. Transformations (e.g., categorization) of the continuous independent variables were attempted if the linearity assumption was not met. Two-way interactions between season and hide-on or pre-evisceration bacterial concentrations were evaluated, in respective models, and kept in the model if statistically significant (p < 0.05).
Model-adjusted mean concentrations and their 95% confidence intervals were computed; due to multiple comparisons, a Bonferroni adjustment was conducted to prevent inflation of type I error. Graphical evaluation of the normality assumption of the best linear unbiased predictors (BLUPs) at the plant, season, and sampling week levels, as well as evaluation of the normality and homoscedasticity assumptions at the sample level, was conducted.
Results
Study population and sample collection
The plants included in the study processed between 340 and 490 cattle per hour. Some of the interventions applied at these plants included soap foam after stunning, hide-on carcass wash with quaternary ammonium, lactic acid (2%) sprayed on carcass after hide removal, pre-evisceration wash cabinet (82°C water), lactic acid sprayed on chuck/neck/foreshank area postevisceration, steam pasteurization and electrical stimulation at different points, lactic acid spray cabinets, and buffered paracetic acid spray in hot box, among others. Three of the plants applied a bacteriophage spray to cattle in lairage pens starting in March or April. Harvested cattle consisted of English crossbreeds, older than 12 months of age.
A total of 3600 samples were collected across processing points, plants, and seasons.
E. coli concentration
Cumulative E. coli concentrations of enumerable samples differed significantly by sampling site (p < 0.01) (Table 1) and a decrease in concentrations was observed throughout processing; hide-on surface samples had the greatest concentration of E. coli compared with all other sample types. E. coli concentrations of hide-off carcass samples were lower than the E. coli concentrations of hide-on samples, and pre-evisceration E. coli concentrations were lower than concentrations of hide-off samples. Postevisceration and postintervention carcass samples had the lowest E. coli concentrations, and only a very few postintervention samples were enumerable (n = 8/720) for E. coli.
Number of Enumerable Samples and Model-Adjusted Mean Concentrations of Escherichia coli and Coliform Bacteria by Sample Type as Determined by Using 3M Petrifilm Plates
Multilevel mixed-effects linear regression models included a fixed effect for sample type and random effects for plant, season, and week of sampling.
Indicate significant differences (p < 0.05) between sample-type proportions within bacteria (from test of equality of proportions using a chi-square test).
Indicate significant differences (p < 0.05) between sample-type means within bacteria (from multilevel mixed-effects linear regression models).
CFU, colony-forming unit; CI, confidence interval.
Within hide-on samples, E. coli concentrations did not significantly differ among seasons (p = 0.21) (Table 2). For hide-off and pre-evisceration samples, concentrations did differ significantly by season (p < 0.01). E. coli concentrations were greater during spring, followed by summer and then fall. E. coli concentrations in postevisceration carcasses significantly differed by season, and the greatest concentrations were found during fall (p = 0.01), with lower concentrations during spring and also summer. There were no significant differences (p = 0.42) between E. coli concentrations of enumerable samples collected during spring, summer, and fall from postintervention carcass samples (Table 2). The concentrations of E. coli differed significantly (p < 0.01) between plants for hide-on, hide-off, and postintervention samples, but were not significantly different for pre- and postevisceration samples (p = 0.07 and 0.57, respectively). Model-adjusted mean E. coli concentrations by sample type and plant are displayed in Table 3.
Number of Enumerable Samples and Model-Adjusted * Mean Concentrations of Escherichia coli by Season and Sample Type as Determined by Using 3M Petrifilm Plates
Indicate significant differences (p < 0.05) between sample-type proportions within each column (from test of equality of proportions using a chi-square test).
Indicate significant differences (p < 0.05) between seasonal means within each column (within sample type; from multilevel mixed-effects linear regression model).
Multilevel mixed-effects linear regression models included fixed effects for sample type, season, and a two-way interaction term between sample type and season, and random effects for plant and week of sampling.
Number of Enumerable Samples and Model-Adjusted * Mean Concentrations of Escherichia coli by Plant and Sample Type as Determined by Using 3M Petrifilm Plates
Indicate significant differences (p < 0.05) between sample-type proportions within each column (from test of equality of proportions using a chi-square test).
Indicate significant differences (p < 0.05) between plant means within each column (within sample type).
Multilevel mixed-effects linear regression models included fixed effects for sample type, plant, and a two-way interaction term between sample type and plant, and random effects for season and week of sampling.
E. coli concentrations of hide-on samples were significantly associated with the E. coli concentrations of hide-off carcass samples; however, this association (p = 0.01) was dependent on season (as depicted by a significant interaction term between E. coli concentration of hide-on samples and season) (Supplementary Table S1). There was no significant association (p = 0.86) between E. coli concentration of pre-evisceration samples and E. coli concentration of postevisceration samples.
Coliform concentration
Overall, coliform concentrations varied significantly by sampling site (p < 0.01) (Table 1). Hide-on samples had the greatest concentrations, compared with all other sample types, followed by hide-off carcass samples. Pre-evisceration and postevisceration coliform concentrations were significantly lower than hide-off sample concentrations (Table 1). A low number of postintervention carcass samples were enumerable for coliforms (n = 48), and these samples had the lowest concentrations among all sample types.
For hide-on enumerable samples, coliform concentrations did not differ significantly between seasons (p = 0.45) (Table 4). Coliform concentrations of hide-off and pre-evisceration samples significantly differed by season (p < 0.01), with greater concentrations being observed during spring and fall, compared with summer. Coliform concentrations for postevisceration samples also varied by season (p < 0.01), with greater concentrations during spring and fall, compared with summer. There were no significant differences (p = 0.15) in coliform concentrations among seasons for postintervention samples.
Number of Enumerable Samples and Model-Adjusted * Mean Concentrations of Coliforms by Season and Sample Type as Determined by Using 3M Petrifilm Plates
Indicate significant differences (p < 0.05) between sample-type proportions within each column (from test of equality of proportions using a chi-square test).
Indicate significant differences (p < 0.05) between seasonal means within each column (within sample type).
Multilevel mixed-effects linear regression models included fixed effects for sample type, season, and a two-way interaction term between sample type and season, and random effects for plant and week of sampling.
The concentrations of coliforms were significantly different between plants for hide-on (p < 0.01), hide-off (p < 0.01), pre-evisceration (p < 0.01), and postintervention (p < 0.01) samples, but were not significantly different for postevisceration samples (p = 0.44). Model-adjusted mean coliform concentrations by sample type and plant are displayed in Table 5.
Number of Enumerable Samples and Model-Adjusted * Mean Concentrations of Coliforms by Plant and Sample Type as Determined by Using 3M Petrifilm Plates
Indicate significant differences (p < 0.05) between sample-type proportions within each column (from test of equality of proportions using a chi-square test).
Indicate significant differences (p < 0.05) between plant means within each column (within sample type).
Multilevel mixed-effects linear regression models included fixed effects for sample type, plant, and a two-way interaction term between sample type and plant, and random effects for season and week of sampling.
Coliform concentrations of hide-on samples were significantly associated with coliform concentrations of hide-off samples. However, this association significantly depended on the season (p < 0.01). Similarly, coliform concentrations of pre-evisceration samples were significantly associated (p = 0.01) with coliform concentrations of postevisceration samples and this association significantly depended on the season (Supplementary Table S2).
EB concentration
EB concentration varied significantly by sampling site (p < 0.01) (Table 6). The greatest concentrations of EB were on hide-on samples (compared with all other sample types) and concentration decreased after hide removal. Few postintervention carcasses were enumerable for EB (n = 13) during all seasons. Concentrations of EB for hide-on samples varied significantly by season (p = 0.01) (Table 7), with the greatest concentrations of EB observed on samples collected in spring months, followed by summer and then fall, with the least concentration. Concentrations of EB for hide-off and pre-evisceration (p < 0.01) samples also differed by season (p < 0.01), being the greatest during spring, compared with summer and then fall. Concentrations of EB for postevisceration carcasses varied by season (p < 0.01), with the greatest observed during spring, followed by fall and then summer. No postintervention samples were enumerable for EB during summer. EB concentrations varied by season (p = 0.04) in fall and spring (being greater in fall).
Number of Enumerable Samples and Model-Adjusted * Mean Concentrations of Enterobacteriaceae and Aerobic Plate Counts by Sample Type as Determined by Using 3M Petrifilm Plates
Indicate significant differences (p < 0.05) between sample-type proportions within bacteria (from test of equality of proportions using a chi-square test).
Indicate significant differences (p < 0.05) between sample-type means within bacteria.
Multilevel mixed-effects linear regression models included a fixed effects for sample type and random effects for plant, season, and week of sampling.
APC, aerobic plate counts.
Number of Enumerable Samples and Model-Adjusted * Mean Concentrations of Enterobacteriaceae by Season and Sample Type as Determined by Using 3M Petrifilm Plates
Indicate significant differences (p < 0.05) between sample-type proportions within each column (from test of equality of proportions using a chi-square test).
Indicate significant differences (p < 0.05) between seasonal means within each column (within sample type).
Multilevel mixed-effects linear regression models included fixed effects for sample type, season, and a two-way interaction term between sample type and season, and random effects for plant and week of sampling.
The concentrations of EB were significantly different between plants for hide-on, hide-off, and pre-evisceration samples (p < 0.01), but were not significantly different for postevisceration and postintervention samples (p = 0.40 and 0.17, respectively). Model-adjusted mean coliform concentrations by sample type and plant are displayed in Table 8.
Number of Enumerable Samples and Model-Adjusted * Mean Concentrations of Enterobacteriaceae by Plant and Sample Type as Determined by Using 3M Petrifilm Plates
Indicate significant differences (p < 0.05) between sample-type proportions within each column (from test of equality of proportions using a chi-square test).
Indicate significant differences (p < 0.05) between plant means within each column (within sample type).
Multilevel mixed-effects linear regression models included fixed effects for sample type, plant, and a two-way interaction term between sample type and plant, and random effects for season and week of sampling.
EB concentrations of hide-on samples were significantly associated (p = 0.04) with EB concentrations of hide-off samples, but this association depended on the season. Similarly, EB concentrations of pre-evisceration samples were significantly associated (p = 0.02) with EB concentrations of postevisceration samples, and this association was also dependent on the season (Supplementary Table S3).
Aerobic plate counts
APC of enumerable samples varied significantly by sampling site (p < 0.01) and were greater on hides, compared with all other sample types, decreasing through the processing line (Table 6). APC concentrations for hide-on samples varied by season (p < 0.01) (Table 9) and were the lowest in summer and the highest in fall. For hide-off, pre-evisceration, and postevisceration APC, concentrations significantly differed by season, being greater in summer and also fall, compared with spring (p < 0.01). APC concentrations for postintervention samples varied by season (p < 0.01) and were higher during fall, followed by summer and then spring. The APC concentrations significantly differed (p < 0.01) between plants for all sample types. APC model-adjusted means by sample type and plant are displayed in Table 10.
Number of Enumerable Samples and Model-Adjusted * Mean Concentrations of Aerobic Plate Counts by Season and Sample Type as Determined by Using 3M Petrifilm Plates
Indicate significant differences (p < 0.05) between sample-type proportions within each column (from test of equality of proportions using a chi-square test).
Indicate significant differences (p < 0.05) between seasonal means within each column (within sample type).
Multilevel mixed-effects linear regression models included fixed effects for sample type, season, and a two-way interaction term between sample type and season, and random effects for plant and week of sampling.
Number of Enumerable Samples and Model-Adjusted * Mean Concentrations of Aerobic Plate Counts by Plant and Sample Type as Determined by Using 3M Petrifilm Plates
Indicate significant differences (p < 0.05) between sample-type proportions within each column (from test of equality of proportions using a chi-square test).
Indicate significant differences (p < 0.05) between plant means within each column (within sample type).
Multilevel mixed-effects linear regression models included fixed effects for sample type, plant, and a two-way interaction term between sample type and plant, and random effects for season and week of sampling.
Aerobic plate bacterial concentrations of hide-on samples and season were significantly associated (p < 0.01) with APC concentrations of hide-off samples. APC of pre-evisceration carcasses were significantly associated (p < 0.01) with APC concentrations of postevisceration carcasses, and this association was significantly dependent on the season (Supplementary Table S4).
Discussion
The enumeration of indicator organisms in this study indicated that the presence and potential transfer of bacterial contamination in carcasses decreased along the carcass processing line. The application of multiple in-plant antimicrobial interventions (e.g., bacteriophages, high-pressure cold water hide washes, hot water washes, steam vacuuming, and acid washes) throughout processing may explain the reduction of bacterial load from hides to carcasses. The location and extent at which these interventions were used varied by processing plant and season. The reduction in bacterial contamination resulting from the application of intervention processes along the slaughterline is supported by the literature, as previous authors have described a decrease in indicator bacterial counts after the sequential application of specific antimicrobial treatments (Arthur et al., 2002; Barkocy-Gallagher et al., 2003; Nou et al., 2003; Wheeler et al., 2014; Barco et al., 2015). Whether individual or combined interventions are responsible for the significant decrease of indicator organisms' concentrations at these plants is not known. Nonetheless, there were still enumerable bacteria, yet within acceptable levels (United States Department of Agriculture, Food Safety and Inspection Service, 1996, 2019), at the postevisceration and postintervention processing points. According to Pennington (2010), persistent detection of E. coli at postevisceration has been explained by ineffective interventions, inconsistent hygiene standards, employee-related factors, and varied carcass handling processes that take place in the slaughterhouse.
Overall, for most processing points where concentrations significantly differed by season, spring months were those in which loads of fecal-origin bacteria (E. coli, coliforms, and EB) were the highest (except for EB postintervention and E. coli postevisceration, whose concentrations peaked in fall). In previous studies, foodborne bacteria, such as E. coli O157:H7, peaked on hides in spring through fall (although prevalence in the spring did not differ significantly from that in the summer, falling slightly in the fall) (Barkocy-Gallagher et al., 2003), did not differ by season (Brichta-Harhay et al., 2008) or was higher in winter months (Schneider et al., 2018). Further establishing associations between indicator organisms with STEC bacteria, and how those may depend on season, can help sort out this epidemiological driver. Our findings indicate that the application of additional intervention measures could be implemented in processing plants during the spring season when climatic characteristics (e.g., temperature and humidity) turn favorable for these bacteria to thrive. Other potential strategies are implementing prehide interventions or controlling bacterial load in live cattle by focusing on preharvest interventions, as previous literature indicates that there is a correlation between fecal/hide prevalence of foodborne pathogens and carcass contamination (Elder et al., 2000). Preharvest interventions aim to reduce fecal shedding of pathogens, in turn leading to a decrease in the pathogen load on hides (Wheeler et al., 2014). These strategies are usually linked to best practices and prevention measures in husbandry, which include clean feed and water and adequate biosecurity measures (Wheeler et al., 2014). Other preharvest interventions studied include the use of sodium chlorate added to feed or water, probiotics, vaccines, or bacteriophages (Sargeant et al., 2007; Wheeler et al., 2014). Although the preharvest application of bacteriophages on hides has been deemed a promising food safety technology, its application to cattle in lairage at beef plants did not significantly reduce E. coli O157:H7 on hides or carcasses during processing, according to one study (Arthur et al., 2017).
Aerobic plate concentrations, which are linked to environmental contamination, were higher in summer and fall at all sampling points, which may be the result of lapses in hygiene practices during handling of carcasses, and of high temperatures in the processing area. Unfortunately, sampling of contact surfaces and equipment or recording of temperatures was not performed.
E. coli and coliforms at the hide-on and postintervention points were the only concentrations not significantly associated with season. For hide-on samples, factors other than season (e.g., husbandry or slaughterhouse practices) may be associated with a consistently high bacterial load. Bacterial load at hide-on, hide-off, and post-intervention (except for EB) sampling points significantly differed by plant. Only postevisceration concentration did not significantly vary between plants (except for APC concentrations, for which all processing points [sample types] were associated with plant). These results are aligned with previous literature affirming that slaughterhouse characteristics (slaughterhouse throughput, plant design, surveillance system in place, and intervention strategies applied) have an influence on bacterial load of beef carcasses (Barco et al., 2015). In fact, different interventions were applied in the processing plants included in this study, which may explain different plants being associated with different bacterial loads on carcasses.
We found evidence of a potential bacterial transfer occurring during the hide removal process in the plants included in this study, given E. coli, coliform, EB, and APC concentrations of hide-on samples were significantly associated with E. coli, coliform, EB, and APC concentrations of hide-off samples from matched beef carcasses, and taking into account that muscle surfaces of carcasses are considered sterile (Rivera-Betancourt et al., 2004). Similarly, coliform, EB, and APC concentrations of pre-evisceration samples were significantly associated with coliform, EB, and APC concentrations of postevisceration samples (i.e., for all indicator organisms, except E. coli), which also points to bacterial transfer occurring during the evisceration process (resulting from exposure to the gut contents of the slaughtered animal). However, the potential bacterial transfer for most of these organisms varied by season.
Reducing the occurrence and estimating the risk associated with STEC along the beef chain require complete and reliable enumeration data. Limiting factors for obtaining such data include the large sample size needed to detect these bacteria on carcass samples, especially in later stages after application of interventions, and high cost of testing. Surrogate organisms provide reliable proxy data on the distribution of feco-orally transmitted organisms, such as STEC (Arthur et al., 2004; Wang et al., 2013). The concentration and distribution of indicator organisms obtained through several points of the beef chain and across different seasons and processing plants from this study provide a comprehensive microbiological foundation for risk modeling of STEC and other foodborne pathogens.
Conclusion
Because indicator bacteria are a surrogate measure for fecal contamination, low counts of E. coli, coliforms, EB, and APC are indicative of good manufacturing and overall hygiene practices. Whereas there was an evident decrease in indicator bacterial counts along the slaughterline in the processing plants included in this study, the presence of enumerable bacteria in postintervention samples reveals the opportunity for further improvement, including implementing interventions at earlier stages, such as preharvest, to reduce the bacterial load cattle bring during harvest.
It has been shown that hide-to-carcass bacterial transfer occurs, and hence, special emphasis should be placed on reducing bacterial contamination of hides and carcasses after the evisceration process. Overall, this study contributes to our understanding regarding contamination levels at different carcass processing points in commercial operations, the transfer of fecally originated contamination from animal hides to preintervention carcasses, and further, from pre- to postevisceration carcasses. This information is critical to understand potential risks of bacteria of fecal origin, including foodborne pathogens, and to reduce these risks in final beef products.
Footnotes
Acknowledgments
This research was supported by the Agriculture and Food Research Initiative STEC CAP Grant No. 2012-68003-30155 from the USDA-NIFA and the CVM at KSU. We thank the STEC CAP interns (Hannah Seger, Justin Ludwig, Christine Bartley, and Carlee Wollard), veterinary research scholar (VRSP) students (John Brandsma and Austin Pauly), student workers (Antoinette Lona, Alison Cioffi, and Amanda Katherns), graduate students (Aurelio Cabezas), Dr. Christy Hanthorn, and laboratory technicians (Xiaorong Shi, Neil Wallace, and Leigh Ann Feuerbacher) for their help with sample collection, processing, and/or testing. We also thank Drs. John Luchansky and Randall Phebus for providing EB and APC Petrifilm plates, our collaborators and their students at West Texas A&M University for assisting with sample collection, and the processing plants for allowing us to collect samples at their facilities.
Disclosure Statement
No conflict of interest, financial or other, exists.
Supplementary Material
Supplementary Table S1
Supplementary Table S2
Supplementary Table S3
Supplementary Table S4
References
Supplementary Material
Please find the following supplemental material available below.
For Open Access articles published under a Creative Commons License, all supplemental material carries the same license as the article it is associated with.
For non-Open Access articles published, all supplemental material carries a non-exclusive license, and permission requests for re-use of supplemental material or any part of supplemental material shall be sent directly to the copyright owner as specified in the copyright notice associated with the article.