
Abstract
Produce is recognized as a source of Salmonella-related foodborne outbreaks in the United States. Identifying produce as a source of foodborne outbreaks is challenging given short product shelf lives and durations of many produce-associated outbreaks. Investigators consider produce a plausible source when illnesses occur over a short time period and disproportionately affect middle-aged or female individuals. We reviewed characteristics of past Salmonella produce outbreaks and their consistency with principles used by epidemiologists when generating hypotheses about an outbreak source. We queried the Foodborne Disease Outbreak Surveillance System for multistate, produce-associated Salmonella outbreaks reported to the Centers for Disease Control and Prevention from 2009 to 2015. All produce-associated outbreaks were classified as fruit outbreaks or vegetable outbreaks using an established classification scheme. We then compared fruit and vegetable outbreaks by characteristics of size, gender, age, age groups, geographic spread, duration, and velocity measures using Wilcoxon rank-sum tests. Epidemic curves were created to display visual representations of outbreak duration and velocity. We identified 14 fruit outbreaks and 24 vegetable outbreaks. The median number of illnesses for all produce-associated outbreaks was 30 and a high median percentage of illnesses were in females (61.9%). Median age was 34 years, with a median of 53.2% of illnesses affecting the 18–59 age group. For all outbreaks, median duration was 77 d and median time to the 50th percentile of illnesses was 32.5 d. Fruit and vegetable outbreaks differed only in the age groups affected. We used outbreak data to verify common indicators of produce-associated Salmonella outbreaks. Outbreaks affected females and middle-aged individuals more commonly, while fruit and vegetable outbreaks impacted different age groups. Although median outbreak duration was less than 12 weeks for both fruit and vegetable outbreaks, there was considerable variation, decreasing its utility as an indicator of produce as a source of the outbreak.
Introduction
Fruit and vegetable consumption is an important component of a healthy lifestyle and is recommended for prevention of chronic diseases (U.S. Department of Agriculture, 2015). However, many fruits and vegetables are consumed raw and are increasingly recognized as a source of foodborne outbreaks in the United States (Lynch et al., 2009). Salmonella is an important cause of these outbreaks (Callejón et al., 2015). Yet, identifying produce as a source of foodborne outbreaks remains challenging. Many produce items have short shelf lives, resulting in shorter outbreaks that provide investigators less time for interviews of ill people to identify common foods consumed and for identification of suspected products for testing. Furthermore, substantial variability exists in the ease with which produce eaten at restaurants or purchased at retail locations can be traced back to its ultimate farm source (Levinson, 2010; Bhatt et al., 2012).
The majority of multistate foodborne outbreaks in the United States are detected through PulseNet, the National Molecular Subtyping Network for Foodborne Disease Surveillance (CDC, 2018b). When a multistate cluster of illnesses is identified, investigators use a number of pieces of information to generate plausible hypotheses about the source vehicle. These include the demographic characteristics of ill people in the outbreak, the geographic distribution of illnesses, the speed and duration over which illnesses occur (i.e., the shape of the epidemic curve), the pathogen species and past associated outbreak vehicles, and food history information obtained by state and local jurisdictions from standard enteric illness interviews. Investigators often consider produce as a plausible hypothesis when the majority of illnesses occur over a relatively short time period (within 1–2 months) and ill people are disproportionately middle-aged and female. Although these characteristics are often used as rules of thumb to guide hypothesis generation, no previous studies have validated their use.
To better understand the characteristics of produce-associated Salmonella outbreaks, we reviewed data from multistate outbreaks reported to the Centers for Disease Control and Prevention (CDC) that were attributed to produce. Understanding characteristics of past produce-associated outbreaks may help refine tools used to generate hypotheses about potential outbreak sources and facilitate earlier identification of produce as a source of Salmonella outbreaks in the future.
Materials and Methods
Data sources
A foodborne disease outbreak is defined as two or more similar illnesses resulting from consumption of a common food (Council of State and Territorial Epidemiologists, 2011). CDC's PulseNet has used pulsed-field gel electrophoresis (PFGE) to identify outbreaks where Salmonella serotype PFGE patterns are isolated more frequently than expected (CDC, 2018b). Once investigated, federal, state, and local agencies submit data on all foodborne disease outbreaks to CDC's Foodborne Disease Outbreak Surveillance System (FDOSS) (CDC, 2018a). Outbreaks reported to FDOSS are attributed to foods based on the results of an epidemiological investigation or one or more of the following additional pieces of evidence: microbiological evidence of the pathogen in the suspect food, traceback investigation that identifies a common source of contamination, findings from an environmental assessment, or other data. FDOSS then categorized outbreak vehicles according to the Interagency Food Safety Analytics Collaboration Project (IFSAC) guidelines (Richardson et al., 2017). The major food category was used to identify produce outbreaks and specific food subtype was used to assign each produce item to a fruit or vegetable category.
During multistate outbreak investigations, PulseNet is used to identify illnesses that are part of an outbreak. In these investigations, officials in state and local health departments have provided additional epidemiologic information on ill people included in the investigation to CDC's Outbreak Response and Prevention Branch (ORPB). These data are maintained in line lists of ill people associated with an investigation.
Inclusion criteria
We included Salmonella outbreaks in the analysis that were identified by CDC's PulseNet, investigated during the period 2009–2015, and were multistate outbreaks (contaminated food item caused illnesses in two or more states). These years were selected because complete data on outbreak line lists were available for analysis. We excluded outbreaks that were linked to shelf-stable produce-derived foods or products, including ground pepper, moringa leaf powder, and sprout seeds (all other outbreaks linked to sprouts were included). We also excluded outbreaks where the contaminated food item was sold frozen or otherwise shelf stable.
Analysis of age, gender, duration, and geographic spread
We requested data from FDOSS and ORPB for Salmonella outbreaks meeting the inclusion criteria, including line lists of cases, case demographic characteristics, case-patient specimen Salmonella isolation dates, case-patient states of residence, investigation start dates, and whether the outbreak-associated produce item was recalled. Outbreaks were analyzed together and also stratified by fruit versus vegetable source. To analyze differences between fruit and vegetable outbreaks, we used Wilcoxon rank-sum tests. We assessed age and gender for outbreak-associated case-patients, duration and geographic spread for each outbreak, and whether a product recall occurred. To identify aggregate median case-patient age, we calculated median ages for each outbreak, creating a distribution of medians. We then calculated a median of median ages. Age data were also categorized into groups (<5, 5–17, 18–59, and >59 years). We then compared age group percent distributions for fruit and vegetable outbreaks with the U.S. Census Bureau on U.S. population age distribution for 2012 (U.S. Census Bureau, 2018b). We chose 2012 because it is the midpoint year of our analysis. To assess geographic spread, we assigned a case location based on the reported state of patient residence and summarized the number of states involved per outbreak. In-depth geospatial mapping of multistate foodborne outbreaks is described elsewhere and was not conducted in this analysis (Chen et al., 2017).
Outbreak velocity
We calculated median values for velocity metrics for Salmonella outbreaks with 25 or more illnesses, including outbreak duration (time from first isolation date to last isolation date); time to 25 illnesses; time to nth percentile of illnesses per outbreak (25th, 50th, and 75th percentiles); average illness onsets per day; outbreak peak number of illnesses; time to peak illnesses defined as the day with the highest number of illnesses identified (limited to outbreaks that had a day with four or more illnesses); and median time from the day of peak illnesses to the last outbreak illness. We used outbreaks of 25 or more illnesses to adequately ascertain characteristics of outbreak epidemic curves. A minimum of four illnesses was chosen for calculation of outbreak peak illnesses because lower thresholds resulted in multiple peaks. Outbreaks with peaks lower than four illnesses per day were not included in the analysis of time to the day of peak illnesses or time from the day of peak illnesses to the day of last outbreak illness.
Of note, we based all dates on reported case Salmonella isolation dates, which represent when a culture specimen was collected. This differs from the illness onset date, which is considered to be an average of 3 d before the isolation date. However, the actual period can vary in length among cases because of other factors such as when individuals visit a health care provider.
Epidemic curves
We plotted epidemic curves for Salmonella outbreaks of 25 or more illnesses included in this analysis. Outbreaks were standardized to the first isolation date as day zero. Each subsequent illness was plotted as the number of days following the isolation date for the first illness in the outbreak. We then grouped outbreaks by category (fruit or vegetable) and displayed them by outbreak vehicle. Data were obtained from FDOSS and from ORPB on February 8, 2017. We performed all analyses using RStudio, version 3.4 (RStudio).
Results
Recalls, age, gender, duration, and geographic spread of outbreaks
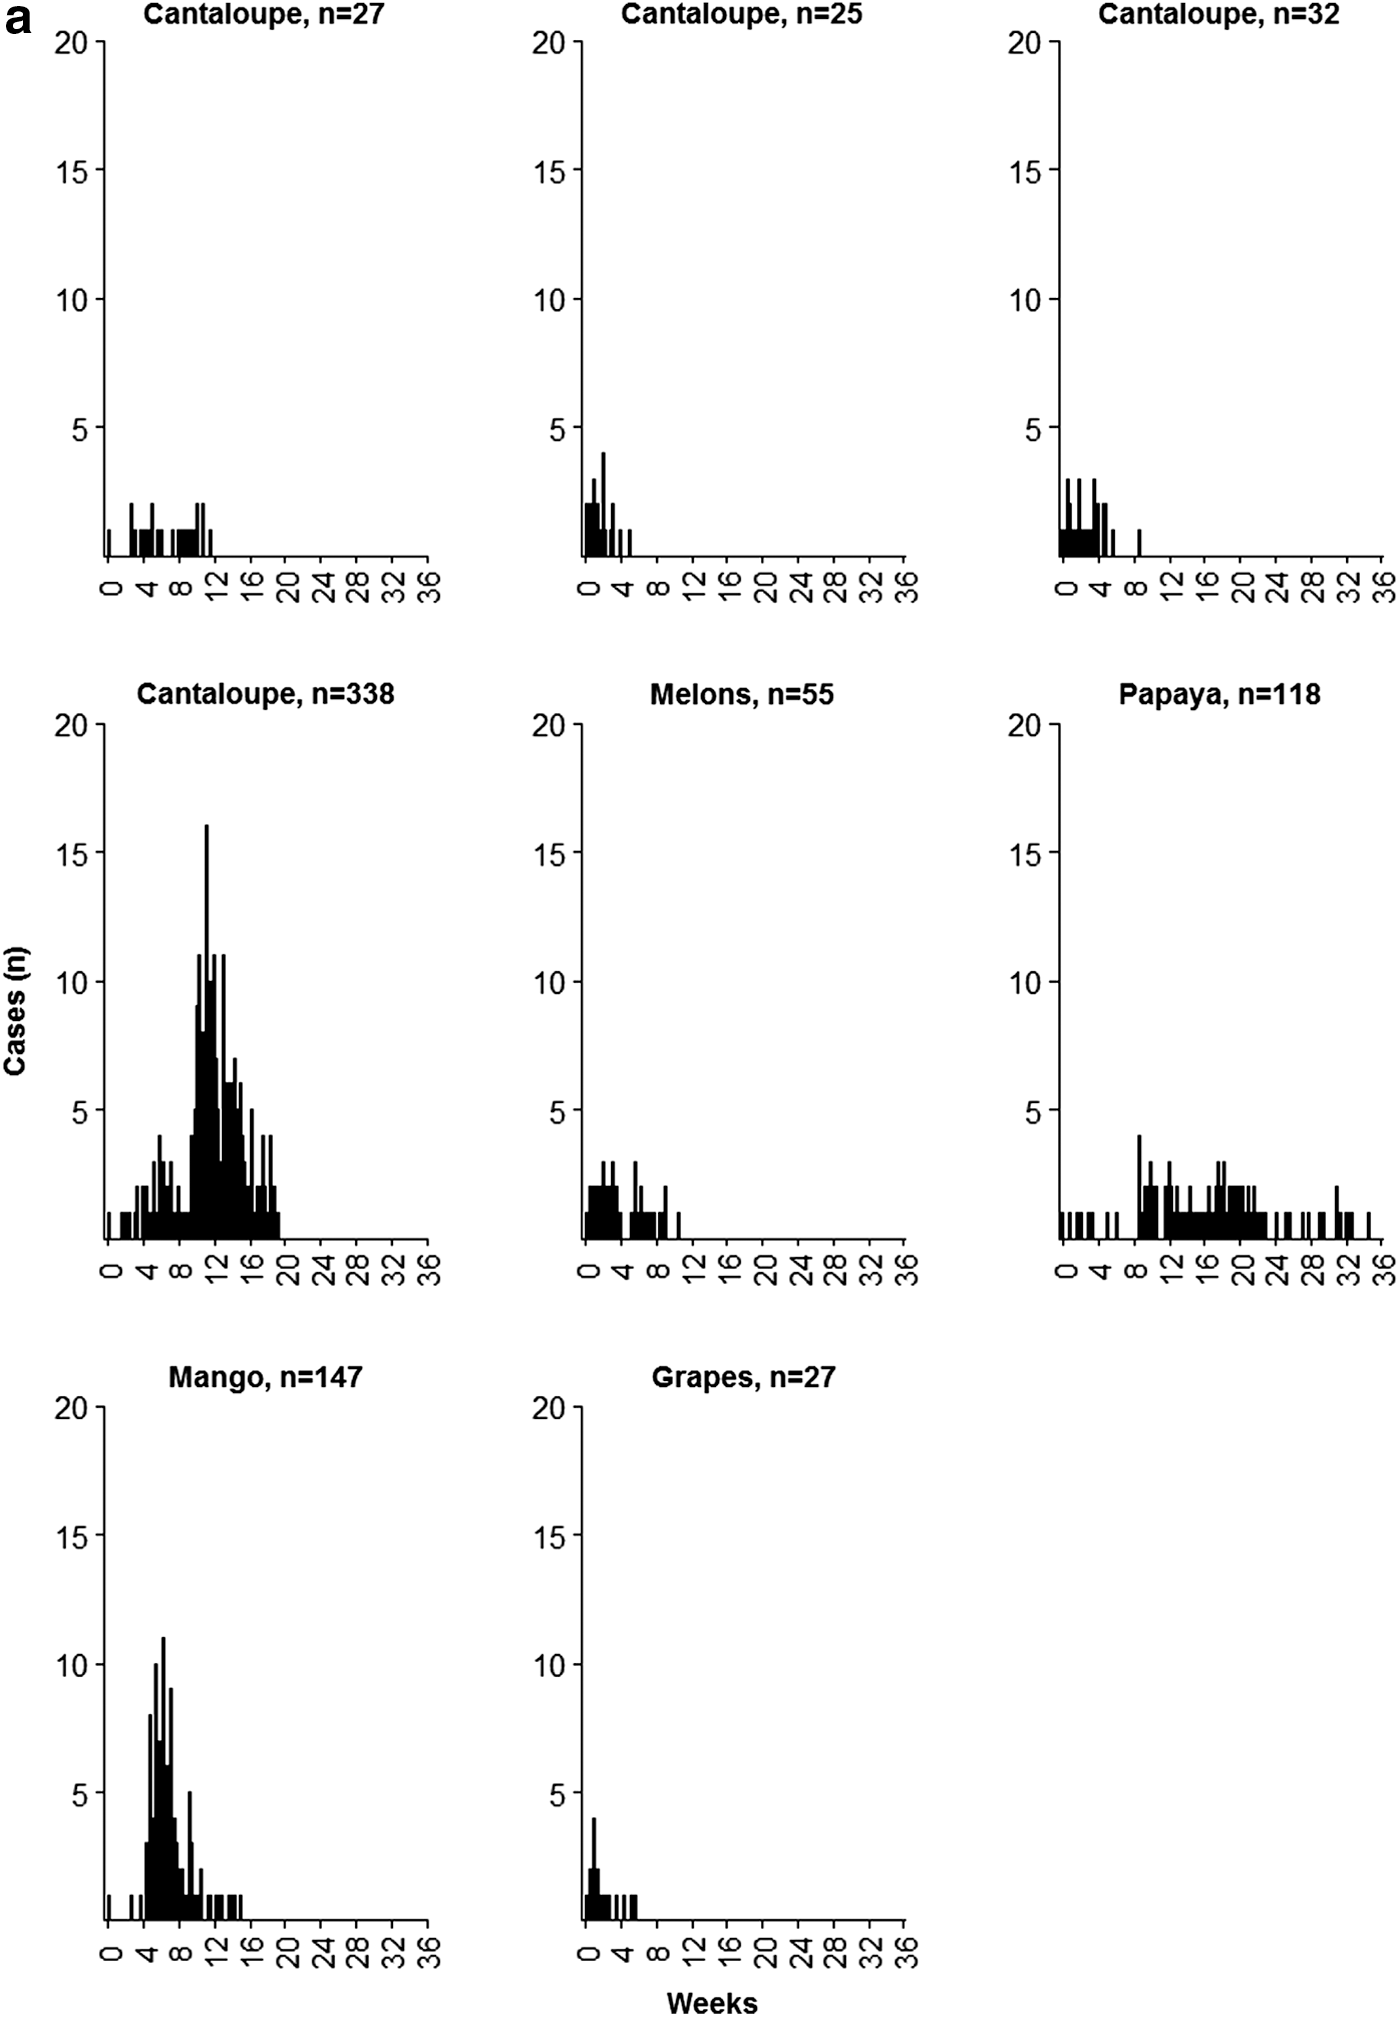
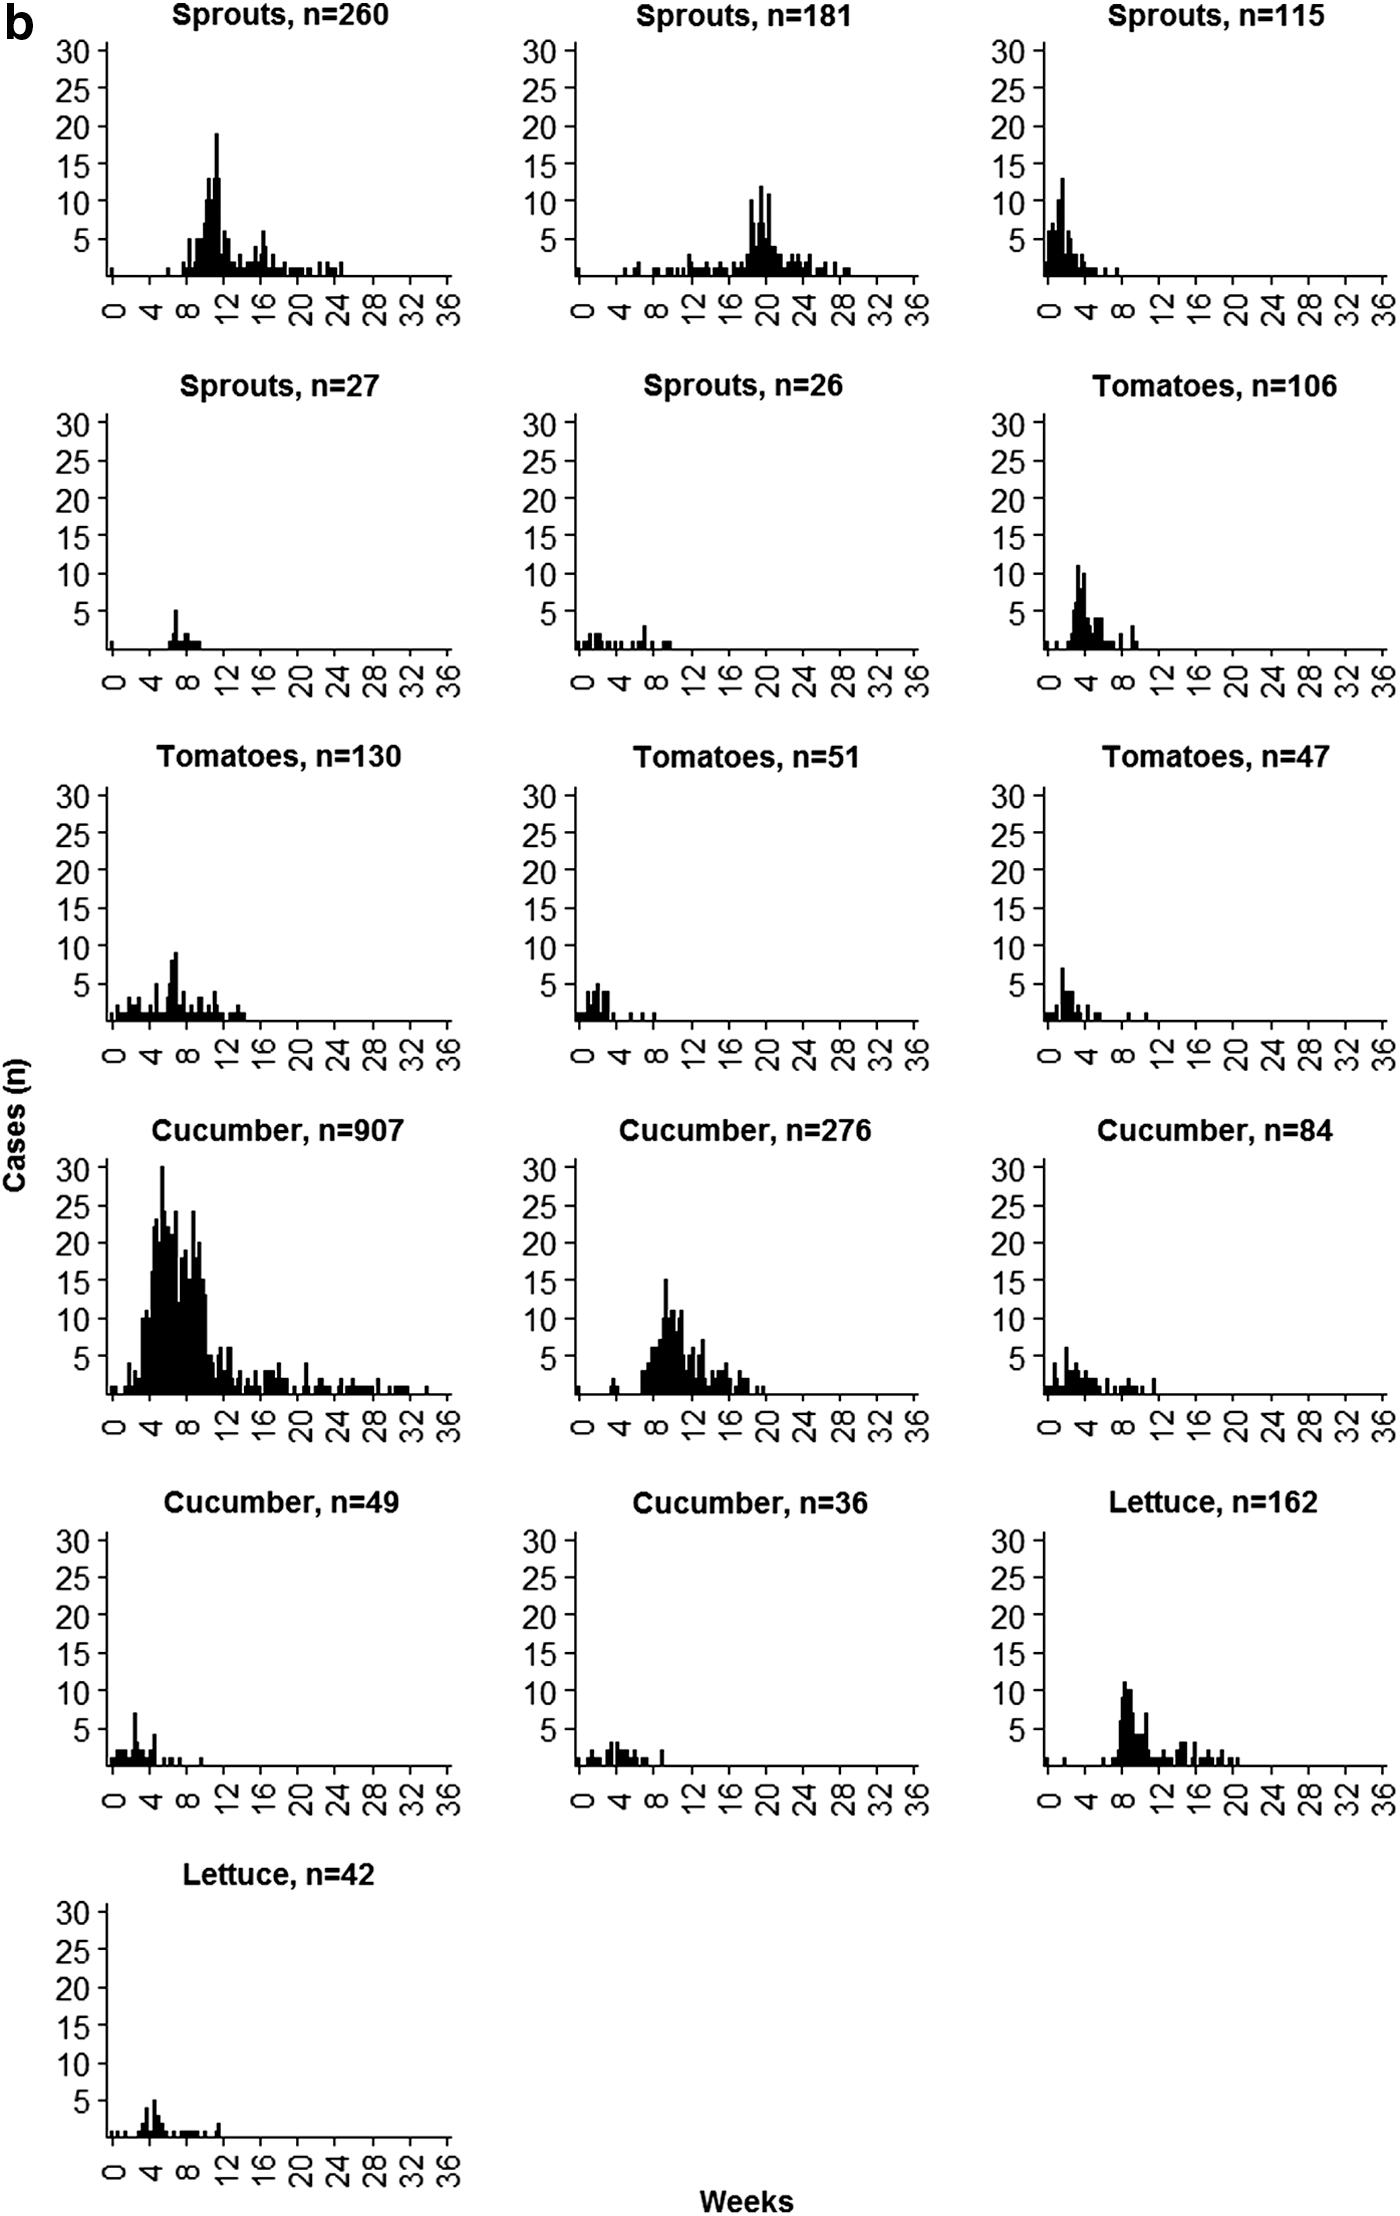
From 2009 to 2015, 38 Salmonella outbreaks related to produce were reported to CDC (Table 1). Fourteen were linked to fruits and 24 to vegetables. Fruit outbreaks were reported in all years except 2015, with the highest number of outbreaks (n = 5) occurring in 2012. Seven (50%) fruit outbreaks were related to cantaloupes, two each (14%) to mangoes and papayas, and one each (7%) to grapes, blueberries, and melons. Vegetable outbreaks were reported in all years, with the highest number of outbreaks occurring in both 2014 and 2015 (four each year). One vegetable outbreak started in 2008, but the outbreak was identified in 2009, so it was counted as a 2009 outbreak. Eight (33%) vegetable outbreaks were related to sprouts, six (25%) to tomatoes, five (21%) to cucumbers, three (13%) to lettuce, and one each (4%) to minipeppers and green onions.
Fruit- and Vegetable-Associated Multistate Outbreaks by Year and Outbreak Size: United States, 2009–2015
Vehicle identified during outbreak investigation.
IFSAC-specific food subtype.
Cases occurred before a national investigation began.
First case occurred in 12/2008, but the outbreak was identified in 2009.
IFSAC, Interagency Food Safety Analytics Collaboration Project.
Of the 38 outbreaks, 12 (32%) investigations resulted in a product recall. Of these, seven were vegetable products (six—sprouts; and one—cucumber) and five fruit products (three—cantaloupe, one—mango, and one—papaya). A median of 74% (range 22–100%) of outbreak cases occurred before the investigation start date. Among outbreaks with a recalled product, a median of 70% (range 23–100%) of cases occurred before the investigation start date.
Table 2 provides selected demographic characteristics for ill people in the 38 Salmonella outbreaks included in this analysis. Among all outbreaks, the median number of illnesses was 30 (range 3–907). The median percentage of ill people who were female was 61.9% (range 30–100%), and the median of outbreak median ages was 34 years. In 2012, the midpoint year of our analysis, the median U.S. population age was 37 (U.S. Census Bureau, 2018a). By outbreak age group, a median of 9.3% of ill people were aged <5 years, 11.1% 5–17 years, 53.2% 18–59 years, and 19.4% 60 years or older. U.S. census data from 2012 provide population estimates in these age cohorts (<5: 6.4%; 5–17: 17.1%; 18–59: 57.1%; and ≥60, 19.4%) (U.S. Census Bureau, 2018b). Illnesses were reported from a median of 11 states (range 2–40 states) per outbreak.
Selected Characteristics of Fruit- and Vegetable-Associated Multistate Outbreaks: United States, 2009–2015
Overall, characteristics of Salmonella outbreaks linked to contaminated fruits and vegetables were similar. Although not statistically different, fruit outbreaks tended to have fewer illnesses than vegetable outbreaks (median 26 vs. 45, p = 0.4). The median proportion of females was similar when comparing fruit and vegetable outbreaks (median % 59.6 vs. 65.5, p = 0.21). The median age of ill people was not significantly different between fruit outbreaks and vegetable outbreaks (48 vs. 31, p = 0.20). However, fruit outbreaks had a higher median percentage of ill people in the <5 (15.7% vs. 7.3%, p = 0.01) and >59 age groups (33% vs. 16.3%, p < 0.01). The median percentage of ill people in the 18
Velocity measures
Table 3 shows measures of outbreak velocity among Salmonella outbreaks associated with contaminated fruits and vegetables with 25 or more illnesses. Median overall outbreak duration was 77 d (range 35–242 d) or 11 weeks. Median time to the first 25 illnesses was 35 d (range 5–96 d). Additionally, median time to the 25th, 50th, and 75th percentiles of illnesses per outbreak was 25, 33, and 45 d, respectively. Using time to the measured percentiles, median quartile times were as follows: start to 25th = 25 d; 25th–50th = 7.5 d; 50th–75th = 12.5 d; and 75th to end = 22 d. Overall, median average illnesses per day was 0.82 (range 0.33–3.83), median peak daily number of illnesses was 9 (range 4–30), and median days to the peak number of illnesses was 38 (range 7–137 d). Finally, the median time from the day of peak outbreak illnesses to the last outbreak illness was 56 d (range 17–199 d).
Velocity Measures of Fruit- and Vegetable-Associated Multistate Outbreaks with 25 or More Illnesses: United States, 2009–2015
Minimum peak of four cases per day. Five fruit outbreaks and 14 vegetable outbreaks were analyzed.
When comparing fruit and vegetable outbreaks, we did not identify significant differences in outbreak duration, time to 25 illnesses, or time to 25th, 50th, or 75th percentiles of illnesses. Additionally, there were no significant differences when comparing median average illnesses per day (0.7 illnesses/day vs. 0.97 illnesses/day, p = 0.29), median peak illnesses (4 illnesses vs. 10 illnesses, p = 0.18), median time to peak illnesses (44 vs. 35.5 d, p = 0.96), or median time from day of peak illnesses to the last outbreak illness (56 vs. 57 d, p = 0.61).
Epidemic curves
All Salmonella outbreaks with 25 or more illnesses are represented as epidemic curves in Figure 1a (fruit outbreaks) and Figure 1b (vegetable outbreaks). The highest number of illnesses on a single day for fruit outbreaks was 16 illnesses for a cantaloupe outbreak and 11 illnesses for a mango outbreak. Seven of eight (88%) fruit outbreaks were over within 20 weeks (first illness date to last illness date). The highest number of illnesses on a single day for vegetable outbreaks was 30 illnesses for a cucumber outbreak and 19 illnesses for a sprout outbreak. Twelve of 16 (75%) vegetable outbreaks were over within 20 weeks of the first illness.
Discussion
Salmonella outbreaks linked to produce have historically been difficult to solve due to short product shelf lives and consequent time constraints on outbreak investigators. In this analysis, we queried national foodborne illness surveillance systems to calculate demographic and velocity characteristics of produce-associated Salmonella outbreaks. We found that produce-associated Salmonella outbreaks generally conform to gender and age assumptions used during hypothesis generation. Females were more commonly affected as well as the 18–59 age group. However, outbreak duration varied, with half of outbreaks (25 cases or larger) lasting 11 weeks or longer. While produce-associated outbreaks may be short, nine outbreaks (25 cases or larger) persisted longer than 12 weeks. The epidemic curves generated in this analysis provide a basis for understanding how fruit and vegetable outbreaks vary over time. There is variation both within outbreaks of the same vehicle and between outbreak vehicles. However, these epidemic curves represent all known illnesses that occurred in an outbreak, so they may not be readily comparable with interim epidemic curves generated during an active outbreak investigation.
While the analysis here provides information that can be used during the hypothesis generation phase of outbreak investigations, there are several limitations. First, the sample size of outbreaks is small, not all outbreaks are identified, and only outbreaks where exposure occurred in multiple states were included in this study. Additionally, sporadic and secondary illnesses do occur and are often incorporated into multistate outbreak investigations because we are often unable to differentiate which illnesses are sporadic or secondary from those that are primary cases in an outbreak. Potential inclusion of these illnesses affects duration and velocity measures. We used percentile measures in an attempt to mitigate the effect of sporadic and secondary cases. Moreover, we do not yet have an adequate comparison to assess how these duration and velocity measures differ from all Salmonella foodborne outbreaks. Finally, a notable concern is the timeline of Salmonella case reporting, which further limits investigators in rapidly identifying a product of concern during an outbreak (CDC, 2015).
There are also other factors that can influence the characteristics of outbreaks we analyzed. These factors include food distribution patterns, season, whether the produce is imported or domestically produced, whether the product is consumed only fresh or can be frozen, whether a product recall or other product action occurred, and where in the food supply chain contamination occurred. We did not analyze these factors because of limited available information. Finally, for sprout outbreaks, contamination can occur at the seed level. We excluded outbreaks where the sprout seeds were documented to be contaminated, although it is possible that other sprout outbreak investigations could not identify whether seeds were contaminated.
This analysis also suggests several opportunities for future investigation. First, this analysis should be repeated with a larger number of outbreaks when available to understand how measured outbreak characteristics may change. In addition, as the number of outbreaks available for evaluation increases, outbreak patterns for specific vehicles (e.g., lettuce and cantaloupe) can be developed. Additionally, this analysis can be repeated for other food types such as dairy products, poultry, and beef. Furthermore, evaluating descriptive outbreak characteristics at designated time points (e.g., 4, 8, and 12 weeks) can clarify how outbreak characteristics evolve over the course of an investigation, helping investigators narrow causative vehicles. In addition, increasing availability of genomic data through whole-genome sequencing will provide information for hypothesis generation by excluding sporadic cases and linking to Salmonella isolates in foods or the environment. Finally, there is the potential to develop a predictive tool based on differences in outbreak characteristics of food types, as was recently done for Shiga toxin-producing Escherichia coli (White et al., 2016). We hope improving surveillance and data capture will allow for enhanced analytic capabilities as well as creation of decision-making tools.
Conclusions
Early identification of a possible outbreak source would allow investigators to quickly narrow potential vehicles, solve the outbreak more quickly, and prevent more illnesses. Because literature on characteristics indicative of produce is not yet available during the hypothesis generation phase of outbreak investigations, investigators use rules of thumb such as outbreak duration, age, and gender as indicators of a possible produce-associated outbreak. This analysis both confirmed and disputed historical, produce-associated outbreak indicators used during investigations. Investigators can use gender and age groups to assist in investigations, but should be cautious in using duration given the variability among outbreaks.
Footnotes
Disclaimer
The findings and conclusions in this report are those of the author(s) and do not necessarily represent the official position of the Centers for Disease Control and Prevention.
Disclosure Statement
No competing financial interests exist.
Funding Information
No funding was received for this article.