
Abstract
Preweaned dairy calves and lactating dairy cows are known reservoirs of antibiotic-resistant bacteria. To further understand the differences in the resistomes and microbial communities between the two, we sequenced the metagenomes of fecal composite samples from preweaned dairy calves and lactating dairy cows on 17 commercial dairy farms (n = 34 samples). Results indicated significant differences in the structures of the microbial communities (analysis of similarities [ANOSIM] R = 0.81, p = 0.001) and resistomes (ANOSIM R = 0.93 to 0.96, p = 0.001) between the two age groups. Firmicutes, Bacteroidetes, Proteobacteria, and Actinobacteria were the predominant members of the communities, but when the groups were compared, Bacteroidetes and Verrumicrobia were significantly more abundant in calf fecal composite samples, whereas Firmicutes, Spirochaetes, Deinococcus-Thermus, Lentisphaerae, Planctomycetes, Chlorofexi, and Saccharibacteria-(TM7) were more abundant in lactating cow samples. Diverse suites of antibiotic resistance genes (ARGs) were identified in all samples, with the most frequently detected being assigned to tetracycline and aminoglycoside resistance. When the two groups were compared, ARGs were significantly more abundant in composite fecal samples from calves than those from lactating cows (calf median ARG abundance = 1.8 × 100 ARG/16S ribosomal RNA [rRNA], cow median ARG abundance = 1.7 × 10⁻¹ ARG/16S rRNA) and at the antibiotic resistance class level, the relative abundance of tetracycline, trimethoprim, aminoglycoside, macrolide-lincosamide-streptogramin B, β-lactam, and phenicol resistance genes was significantly higher in calf samples than in cow samples. Results of this study indicate that composite feces from preweaned calves harbor different bacterial communities and resistomes than composite feces from lactating cows, with a greater abundance of resistance genes detected in preweaned calf feces.
Introduction
Lactating dairy cows and preweaned dairy calves produce a significant amount of fecal waste on a per animal basis and components of this waste include fungi, protozoa, viruses, archaea, and bacteria (Morse et al., 1994; Nennich et al., 2003). Dairy animal waste is a known source of human pathogens (USDA, 2003, 2011), but the majority of organisms found in this waste are nonpathogenic members of the gut (Noyes et al., 2017). Although these bacteria do not present a significant risk to human health, they may harbor antibiotic resistance genes (ARGs) that can be potentially transferred to pathogenic bacteria.
Antimicrobial resistance (AMR) is a significant human health threat and it has been suggested that antibiotic usage in agriculture contributes to the increasing prevalence of AMR (Oliver et al., 2011; Kennedy, 2013; Chang et al., 2015). Antibiotics are used on dairy farms to treat mastitis, respiratory disorders, diarrhea, navel infections, and lameness, and although the practice is declining, they have also been used in milk replacers fed to preweaned calves (APHIS, 2008; Barlow, 2011; Springer et al., 2019). Dairy animals are known reservoirs of resistant bacteria and studies have indicated that animals of all ages shed these organisms, regardless of past antibiotic administration (Wichmann et al., 2014; Pitta et al., 2016; Cao et al., 2019; Liu et al., 2019b). Interestingly, culture-based and molecular studies have demonstrated a greater degree of AMR in the feces of younger animals with a decrease occurring as animals age (Hoyle et al., 2004; Khachatryan et al., 2004; Sato et al., 2005; Cao et al., 2019; Liu et al., 2019a, 2019b). However, dairy farms in the United States are numerous and varied in management practices, size, climate, etc., necessitating further investigation of this phenomenon in the commercial environment. To evaluate these reported age-related differences in AMR in the commercial production setting, we conducted a metagenomic survey on 17 dairy farms in Pennsylvania to assess the differences in the communities and resistomes of composite fecal samples from pens housing preweaned calves and lactating cows. Based on previous studies, we hypothesized that the communities and resistomes within feces collected from calf and cow pens are significantly different.
Materials and Methods
Sample collection
Fecal composite samples were collected from the floor in different locations within the pens of lactating cows and preweaned calves on 17 commercial dairy farms in Pennsylvania between 2013 and 2015 (Cao et al., 2019). Approximately 120 g of manure was collected from each of the six to eight sites within a pen, and this was combined to form a single composite (∼750 g) for each animal group. Preweaned dairy calves were typically younger than 8 weeks of age and received milk replacer, saleable whole milk, or waste milk. Lactating cows were milk-producing animals that had birthed at least one calf. Animals of different age groups were kept in separate pens and consisted of multiple breeds.
DNA extraction and sequencing
Samples were placed in sterile tubes, transported on ice, and within 24 h, they were suspended in 1X buffered peptone water in a filtered bag, and homogenized in a stomacher. Two milliliters of the filtrate was stored at −80°C. Samples were thawed on ice; DNA was extracted by using a MoBio PowerSoil® DNA Isolation Kit (Carlsbad, CA) and cleaned by using a DNA Clean & Concentrator kit (Zymo Research, Irvine, CA). DNA was sheared by using a Covaris-focused ultrasonicator (Covaris, Woburn, MA). Sequencing libraries were constructed by using a TruSeq Nano Kit (Illumina, San Diego, CA) on the NeoPrep Library Prep system, and sequencing was conducted with multiple high-output flow cells on a NextSeq500 (2 × 150 bp reads). Deconseq was used to clean reads of phiX, sequencing adaptors, and host reads by using the UMD 3.1 Bos Taurus genome as a target (Schmieder and Edwards, 2011). Trimmomatic V 0.36 was used to trim for quality and length (leading 20, trailing 20, sliding 4:20, min len 36) (Bolger et al., 2014). After cleaning and curation, an average of 40.4 M reads per sample (range 12.0–67.7M reads) were retained for downstream analyses. Sequencing data were deposited in NCBI (BioProject PRJNA563872).
Taxonomic and resistome analyses
To investigate the taxonomic profiles of the samples, 16S ribosomal RNA (rRNA) sequences were extracted from the metagenomic data by using MeTaxa2 (Bengtsson-Palme et al., 2015) with default settings. Taxonomies were then assigned to these sequences by using the EzBioCloud server (Yoon et al., 2017). Diversity data were collected from this output. Taxonomic abundances were normalized by dividing the number of reads matching each taxonomic category by the number of 16S rRNA reads assigned a taxonomy for that sample. Core taxa were considered those present in at least 75% of samples for each age group. ARGs were identified by aligning reads to the Resfinder database (Zankari et al., 2012) using BLASTN with a minimum of 50 bp aligned at ≥95% similarity. A minimum of 10 reads assigned to an ARG was used to consider an ARG present in the sample. ARGs were then classified into classes, mechanisms, and gene families by aggregating the read counts. ARG abundance was normalized following the methods of Li et al. (2015), which utilizes number of ARG reads, ARG reference length, read length, 16S rRNA reads passing the EzBioCloud quality filter, and the average length of the 16S rRNA gene sequence in this database (1426 bp). Normalized ARG abundance was expressed as “copy of ARG/copy of 16S rRNA.”
Differential abundances in taxa between groups were determined by linear discriminant analysis (LDA) coupled with effect size measurements with the threshold on the logarithmic LDA score for discriminative features set to 2.0 by using an “all-against-all” strategy (Segata et al., 2011). Differences in the abundances of resistance genes and classes were evaluated by using the Kruskal
Results
Taxonomic analyses
For both groups the most frequently identified phyla were Firmicutes, Bacteroidetes, Proteobacteria, and Actinobacteria, which is consistent with other studies (Mao et al., 2015; Haley et al., 2016; Pereira et al., 2016; Thomas et al., 2017) (Fig. 1). There was a significantly higher relative abundance of Bacteroidetes and Verrucomicrobia in calf feces, and a higher abundance of Firmicutes, Spirochaetes, Chloroflexi, Saccharibacteria-(TM7), Planctomycetes, and Lentisphaerae in cow feces (Fig. 2). The Firmicutes:Bacteroidetes values varied between the two groups (calves: 0.26 to 1.5, median = 0.78; cows: 1.56 to 4.27, median = 2.47, [Kruskal
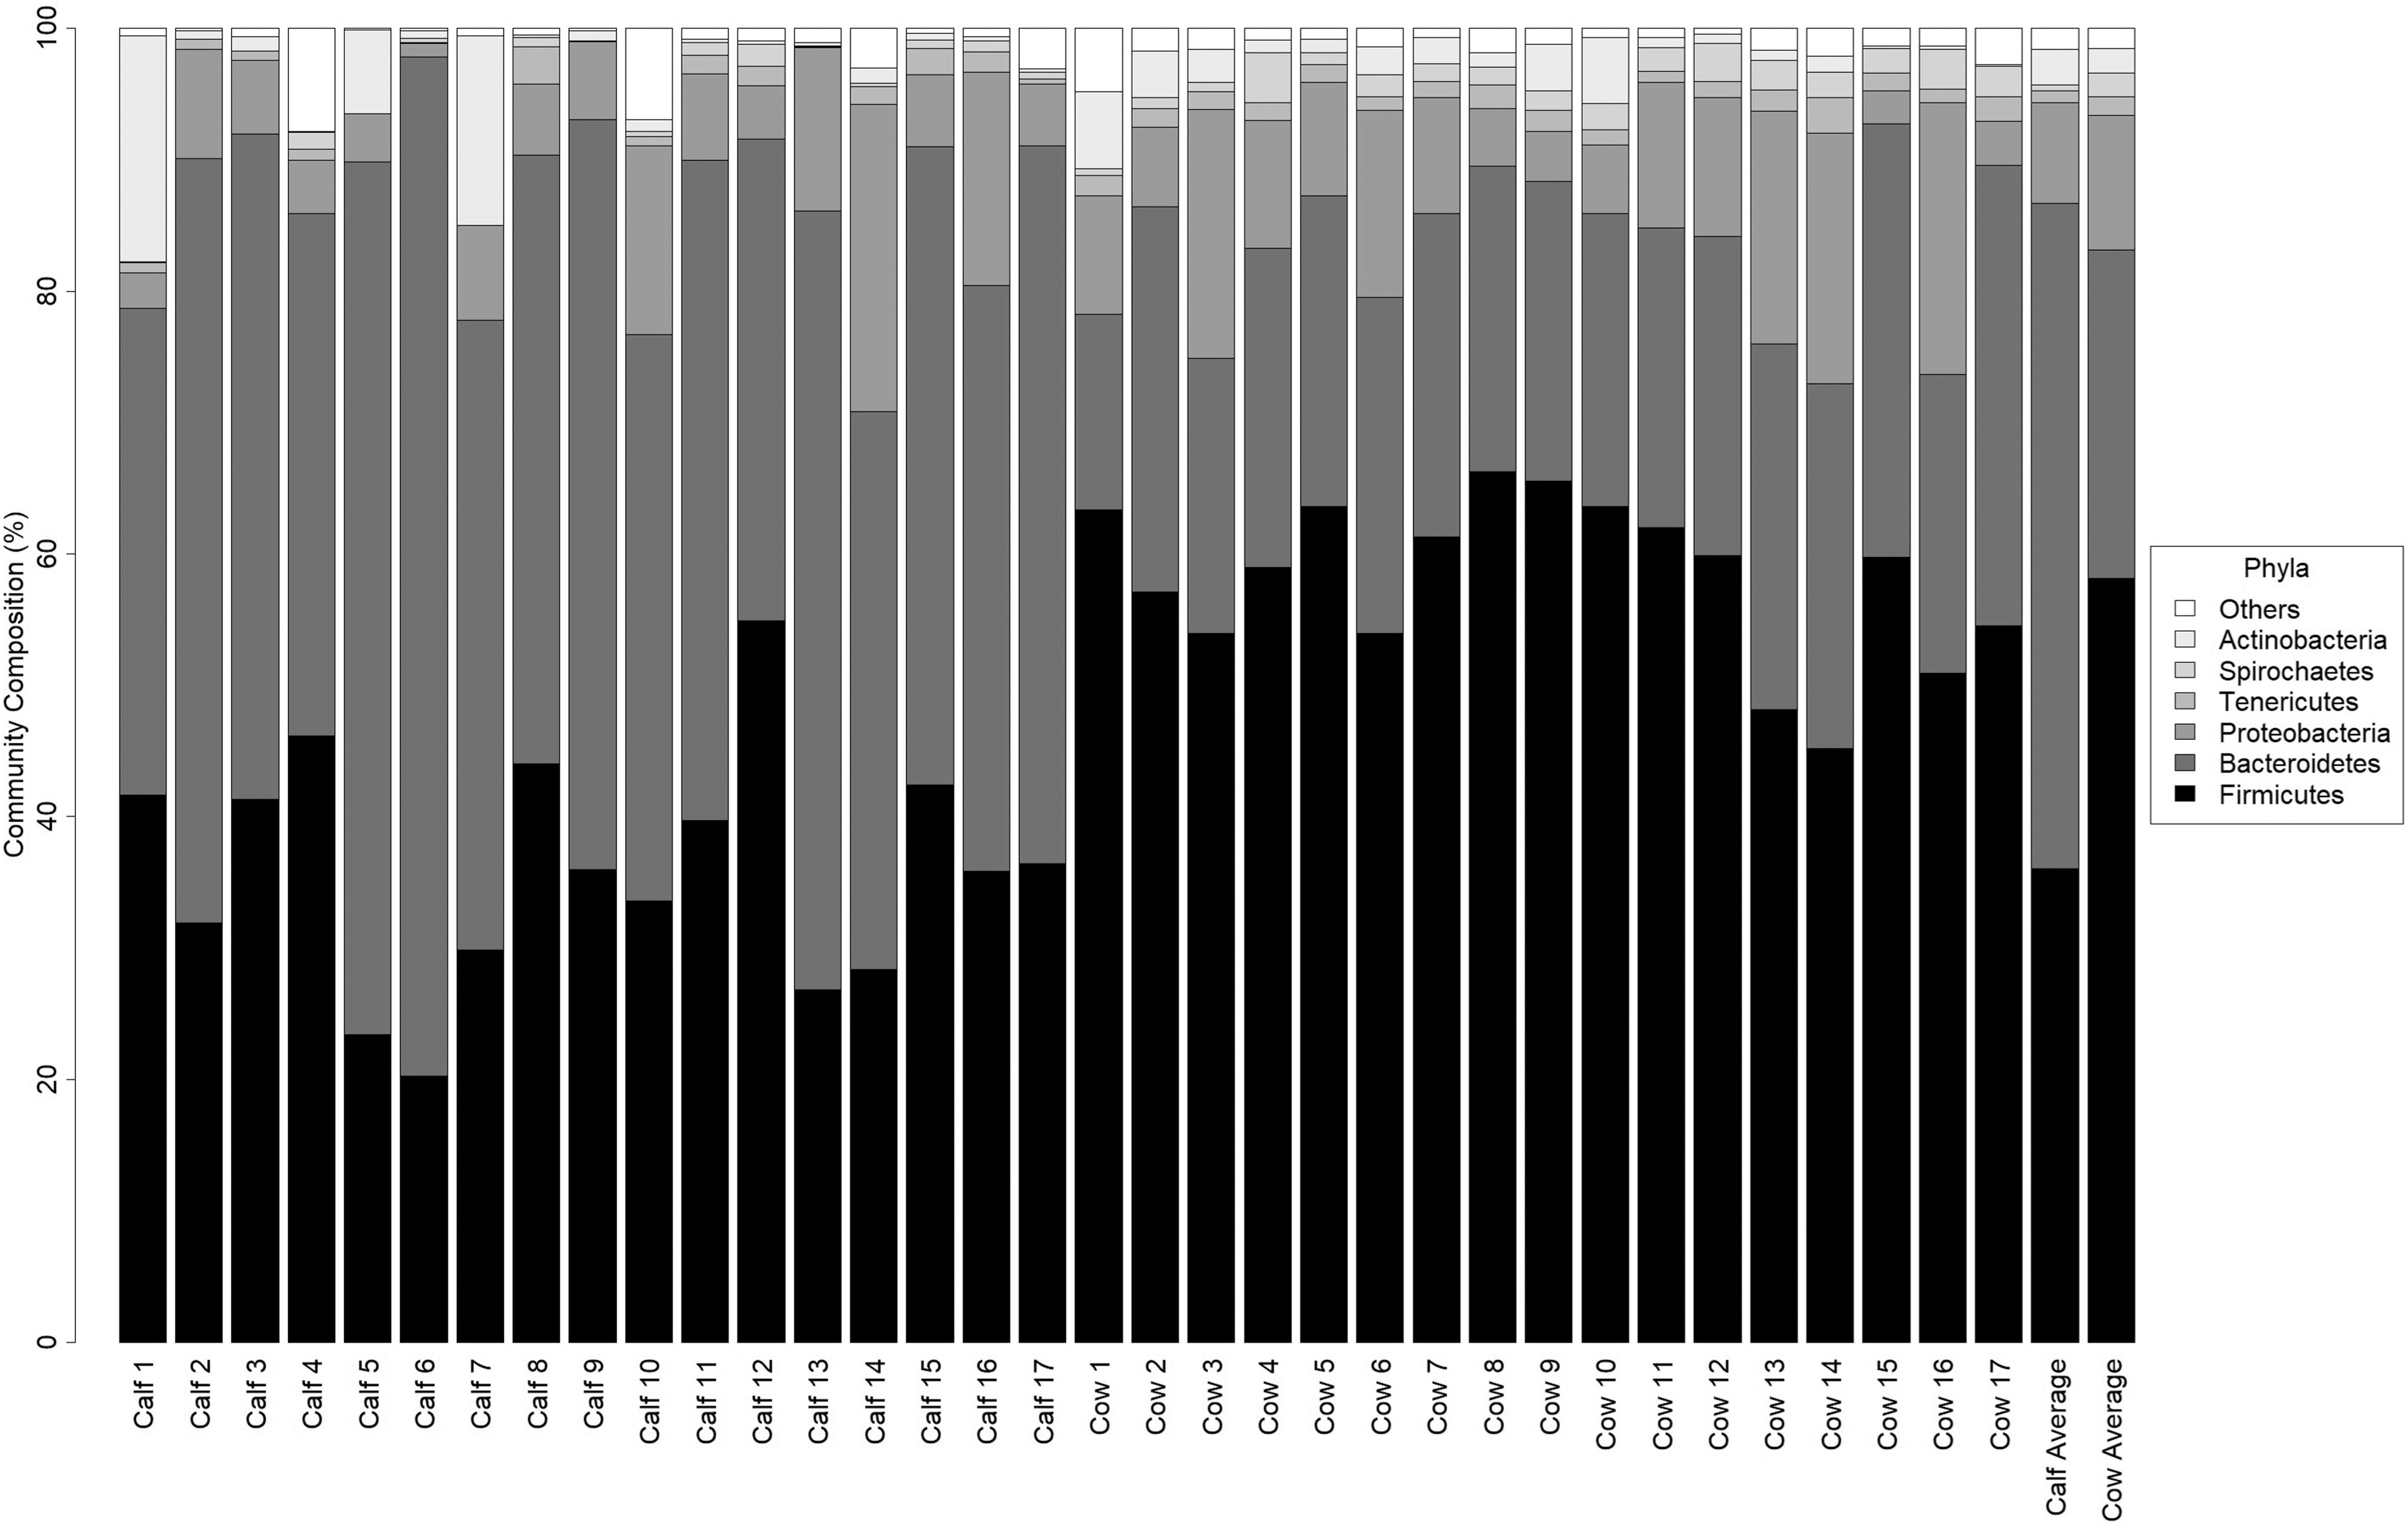
Taxonomic profiles of composite calf and cow feces. Individual composite samples are labeled on the bottom. The two far right columns are the average community composition for calf samples and cow samples. The order of phyla on the plot is the same order as the phyla on the legend.
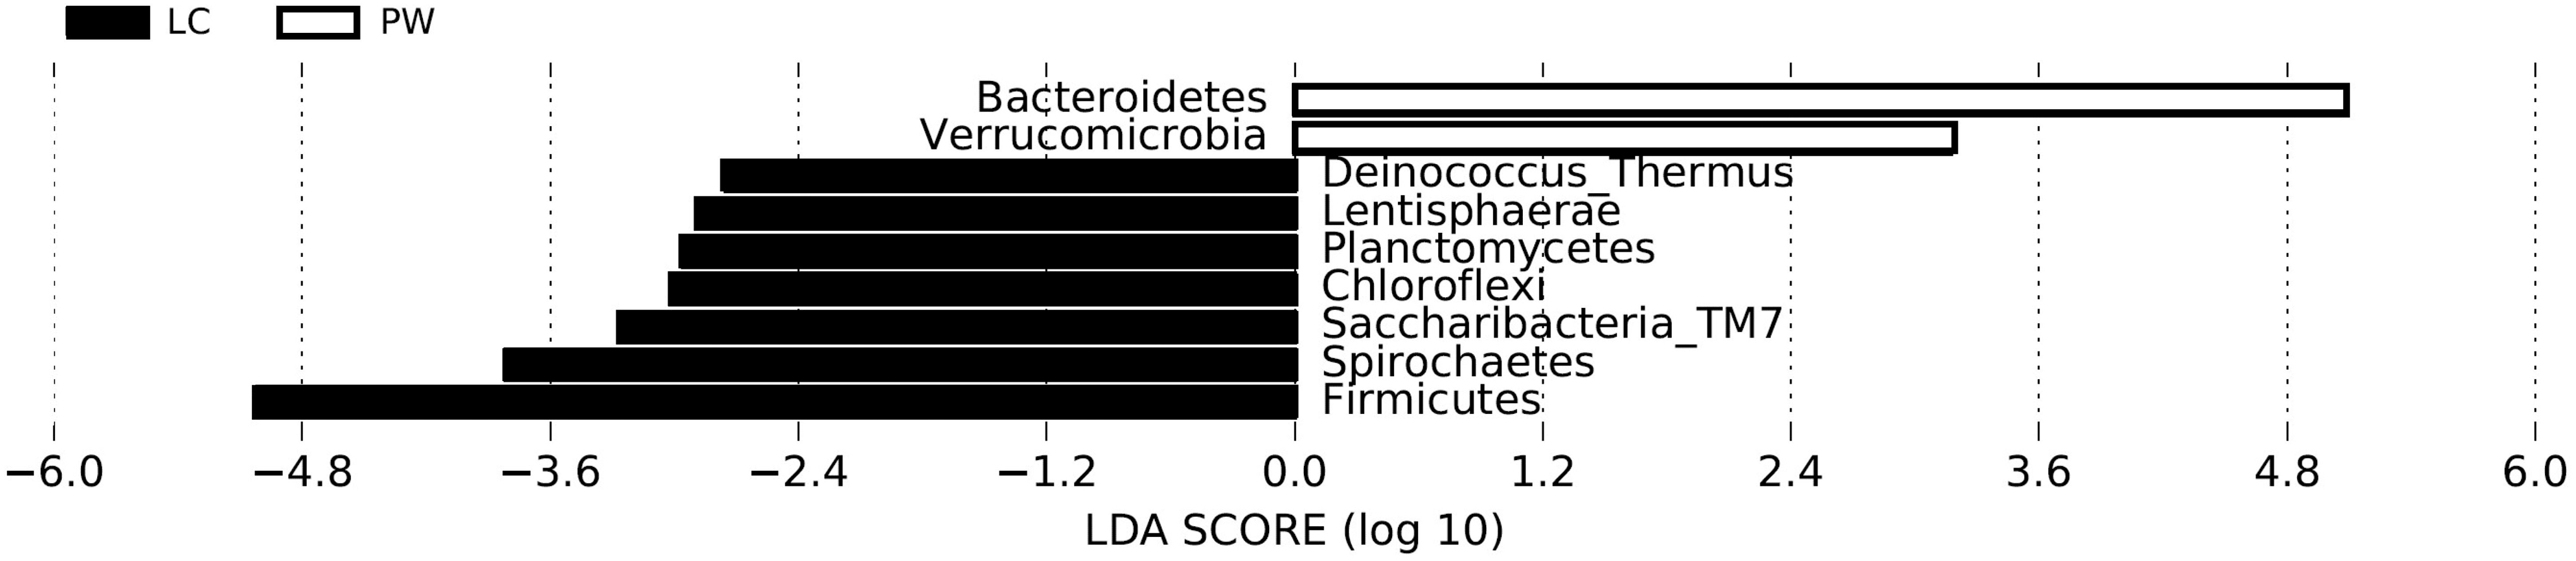
Differentially abundant phyla as determined by LDA combined with effect size measurements. A p-value of <0.05 and a score ≥2.0 were considered significant in Kruskal–Wallis and pairwise Wilcoxon tests, respectively. LC = abundances in lactating cow samples (black bars); PW = abundances in preweaned calf samples (white bars). LDA, linear discriminant analysis.
Based on comparisons of the core communities, cow feces were more diverse than calf feces. The core phyla of the calf feces consisted of Actinobacteria, Bacteroidetes, Firmicutes, Proteobacteria, Cyanobacteria, Tenericutes, Verrucomicrobia, and Spirochaetes; whereas the cow feces core consisted of these phyla in addition to Saccharibacteria-(TM7), Lentisphaerae, Fibrobacteres, and Planctomycetes. The core genera in calf feces included 88 taxa and 349 taxa cow feces, with 25 genera overlapping the two groups.
The overall microbial communities were significantly different between calf and cow feces (ANOSIM R = 0.81) (Fig. 3). Using multiple indices, cow samples demonstrated a significantly higher level of diversity (Kruskal

NMDS analysis of phyla by age. Stress = 0.13; ANOSIM R = 0.81, p < 0.001. ANOSIM, analysis of similarities; NMDS, nonmetric multidimensional scaling.
Taxa Diversity Statistics Based on 16S Ribosomal RNA Sequences
The column on the far right shows the significance of the Kruskal
OTUs, operational taxonomic units.
Resistome analyses
ARG sequences were detected in a relatively low frequency in all samples (6664 to 194,849 reads; 0.014–0.28% of reads). A total of 113 unique ARGs were detected across all samples with a median of 39 (range 14–71) (Supplementary Fig. S3). Aminoglycoside, β-lactam, trimethoprim, glycopeptide, macrolide-lincosamide-streptogramin B (MLS), oxazolidinone, phenicol, quinolone, sulfonamide, and tetracycline ARGs were detected in at least one sample, and these but quinolone and glycopeptide were detected in at least one sample for each age group (Fig. 4). Tetracycline, β-lactam, and MLS ARGs were identified in all samples. Tetracycline ARGs comprised the majority of ARGs (42% of ARGs in calf and 46% in cow feces) (Fig. 5). Aminoglycoside ARGs represented a greater percentage of the resistome of calf than cow feces (34% vs. 18%), whereas MLS ARGs represented a greater percentage of the resistome in cow than calf feces (26% vs. 13%). β-Lactam, sulfonamide, phenicol, and trimethoprim ARGs made up, on average, less than 5% of the resistomes of both groups. Among the cow feces, tetQ was the most abundant followed by lnu(C), tet(W), tet(40), mef(A), and tet(O). In calf feces, the tetQ was the most abundant, followed by aph(3′)-IIIa, ant(6)-Ib, tet(40), mef(A), and tet(W) (Supplementary Fig. S4).
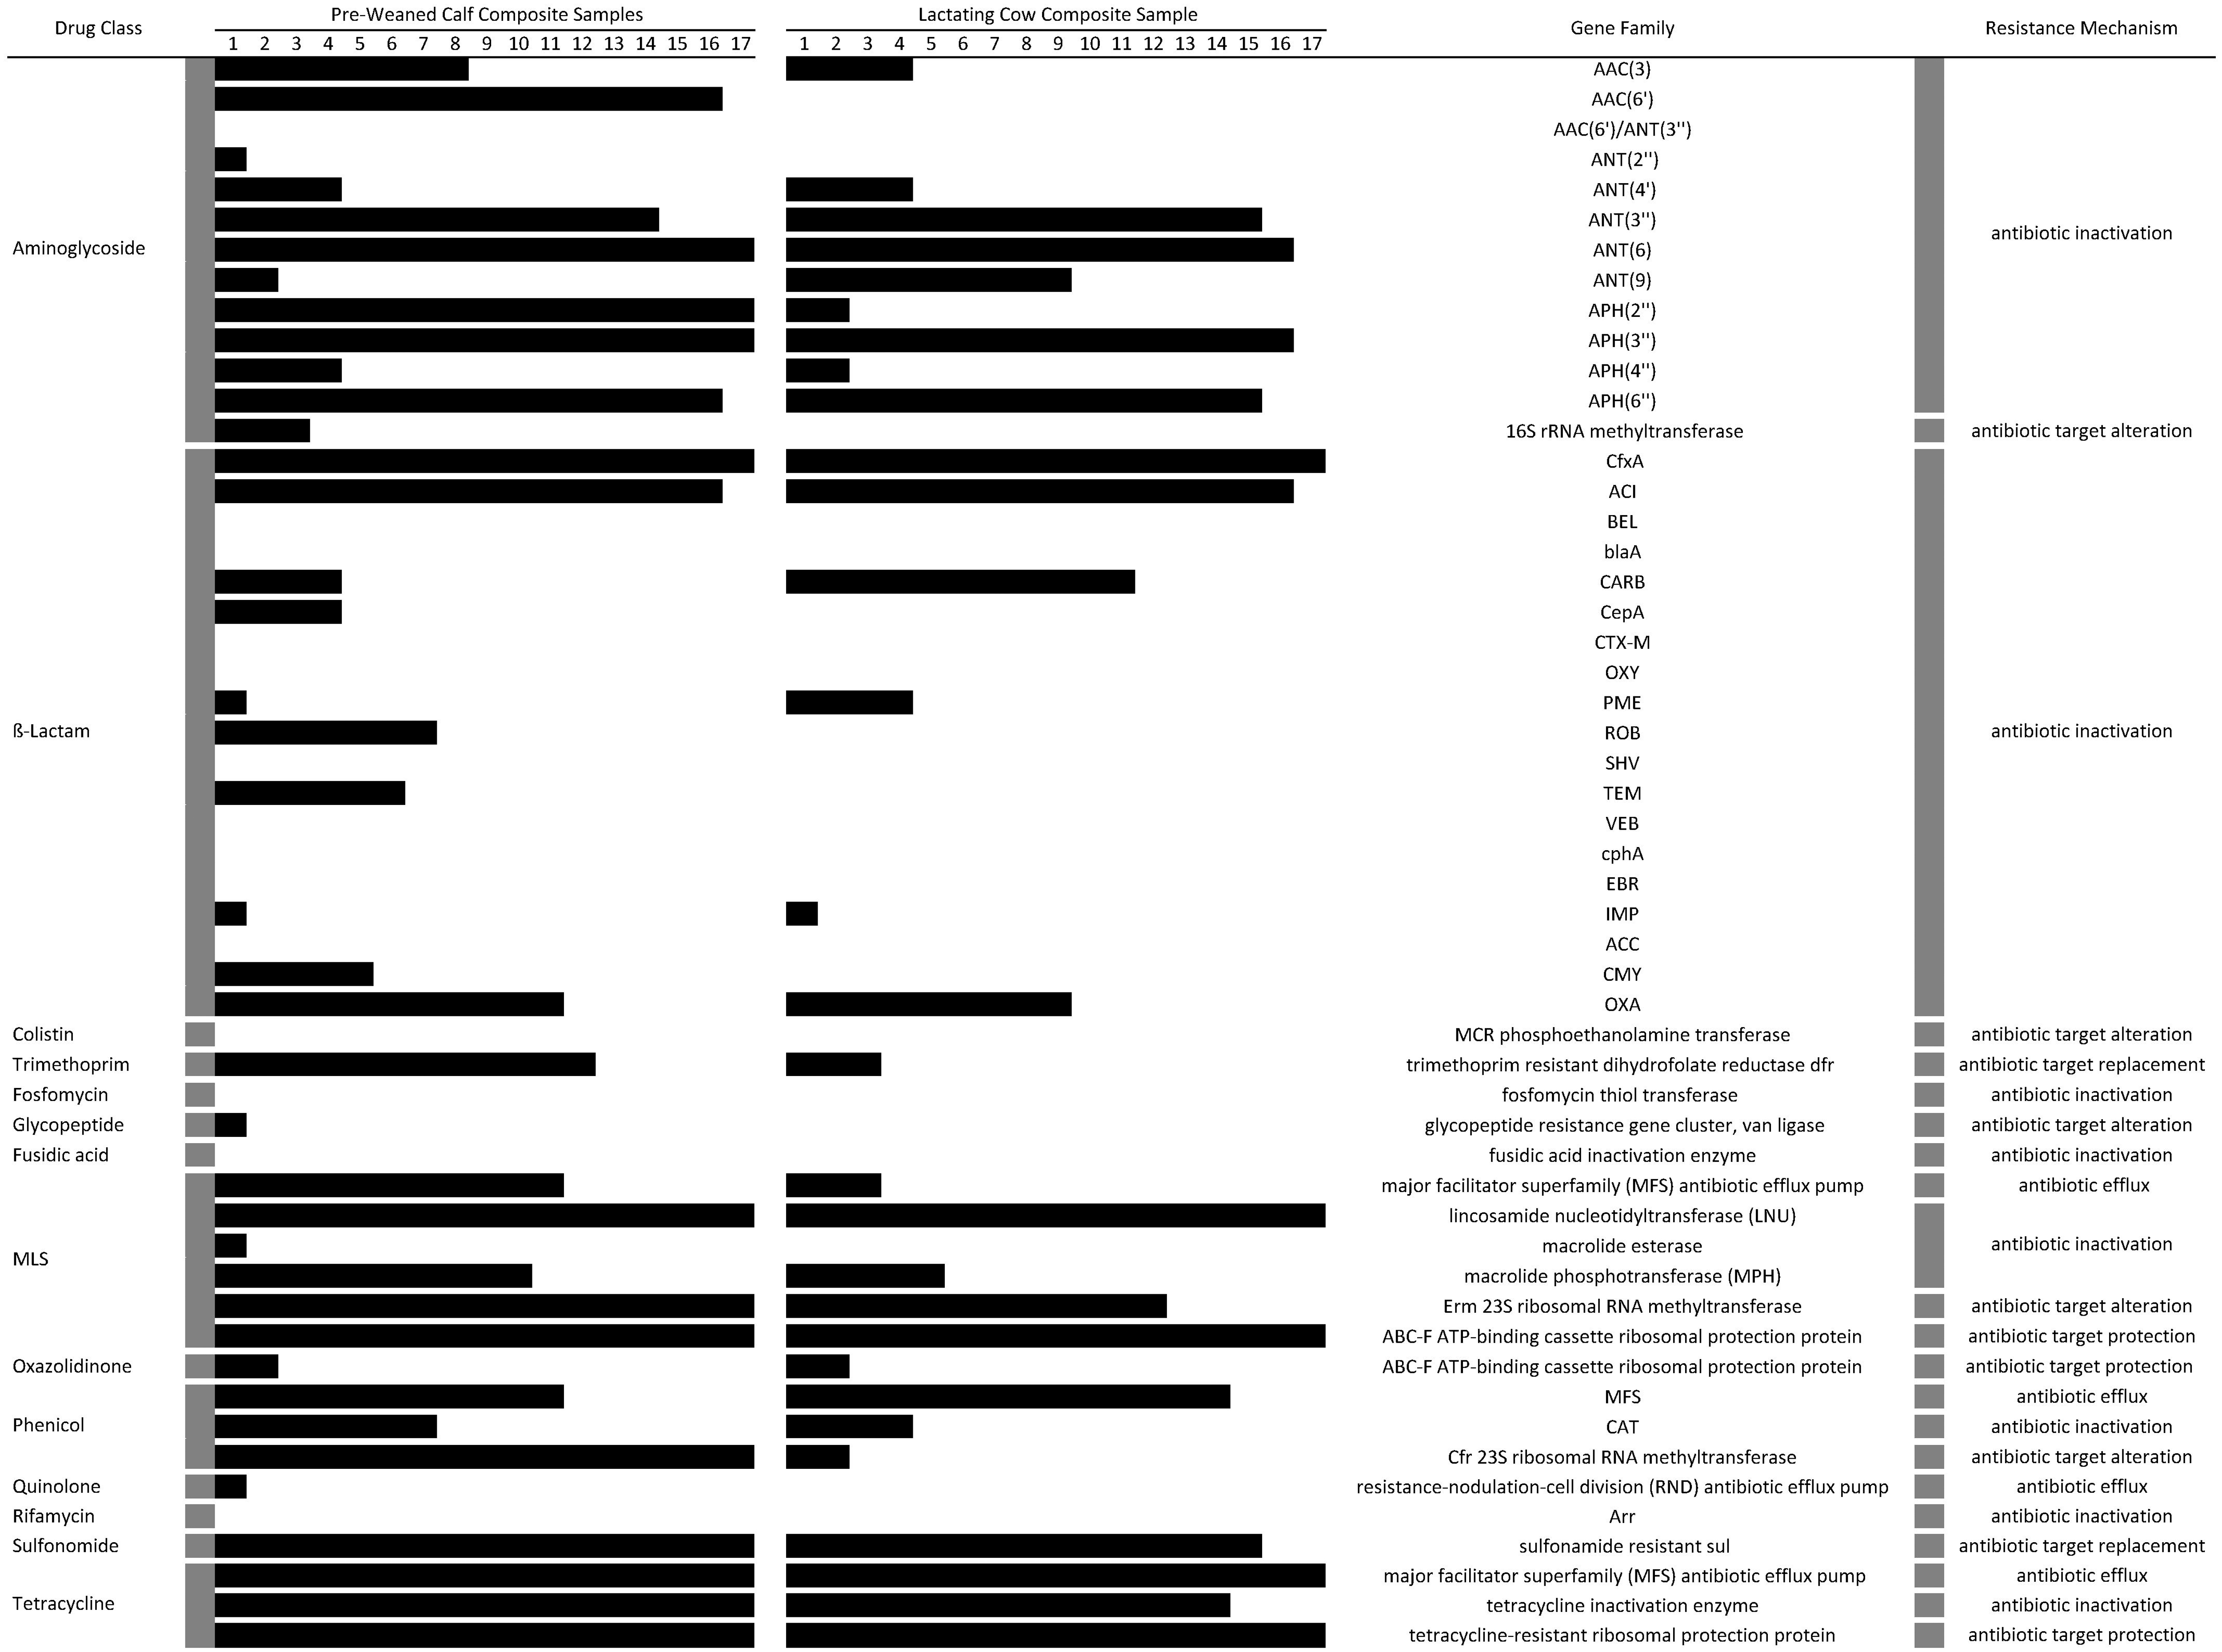
Binary (presence/absence) heatmap of ARGs that were present in at least one fecal sample. The number of composite fecal samples collected from preweaned calves and lactating cows that were positive (≥10 aligned reads) for each of the assigned gene families. The assigned resistance mechanism (far right column) for each antibiotic class (far left column) is listed. A black box indicates a positive sample. There were 17 calf fecal samples and 17 cow fecal samples analyzed in this study. ARGs, antibiotic resistance genes.
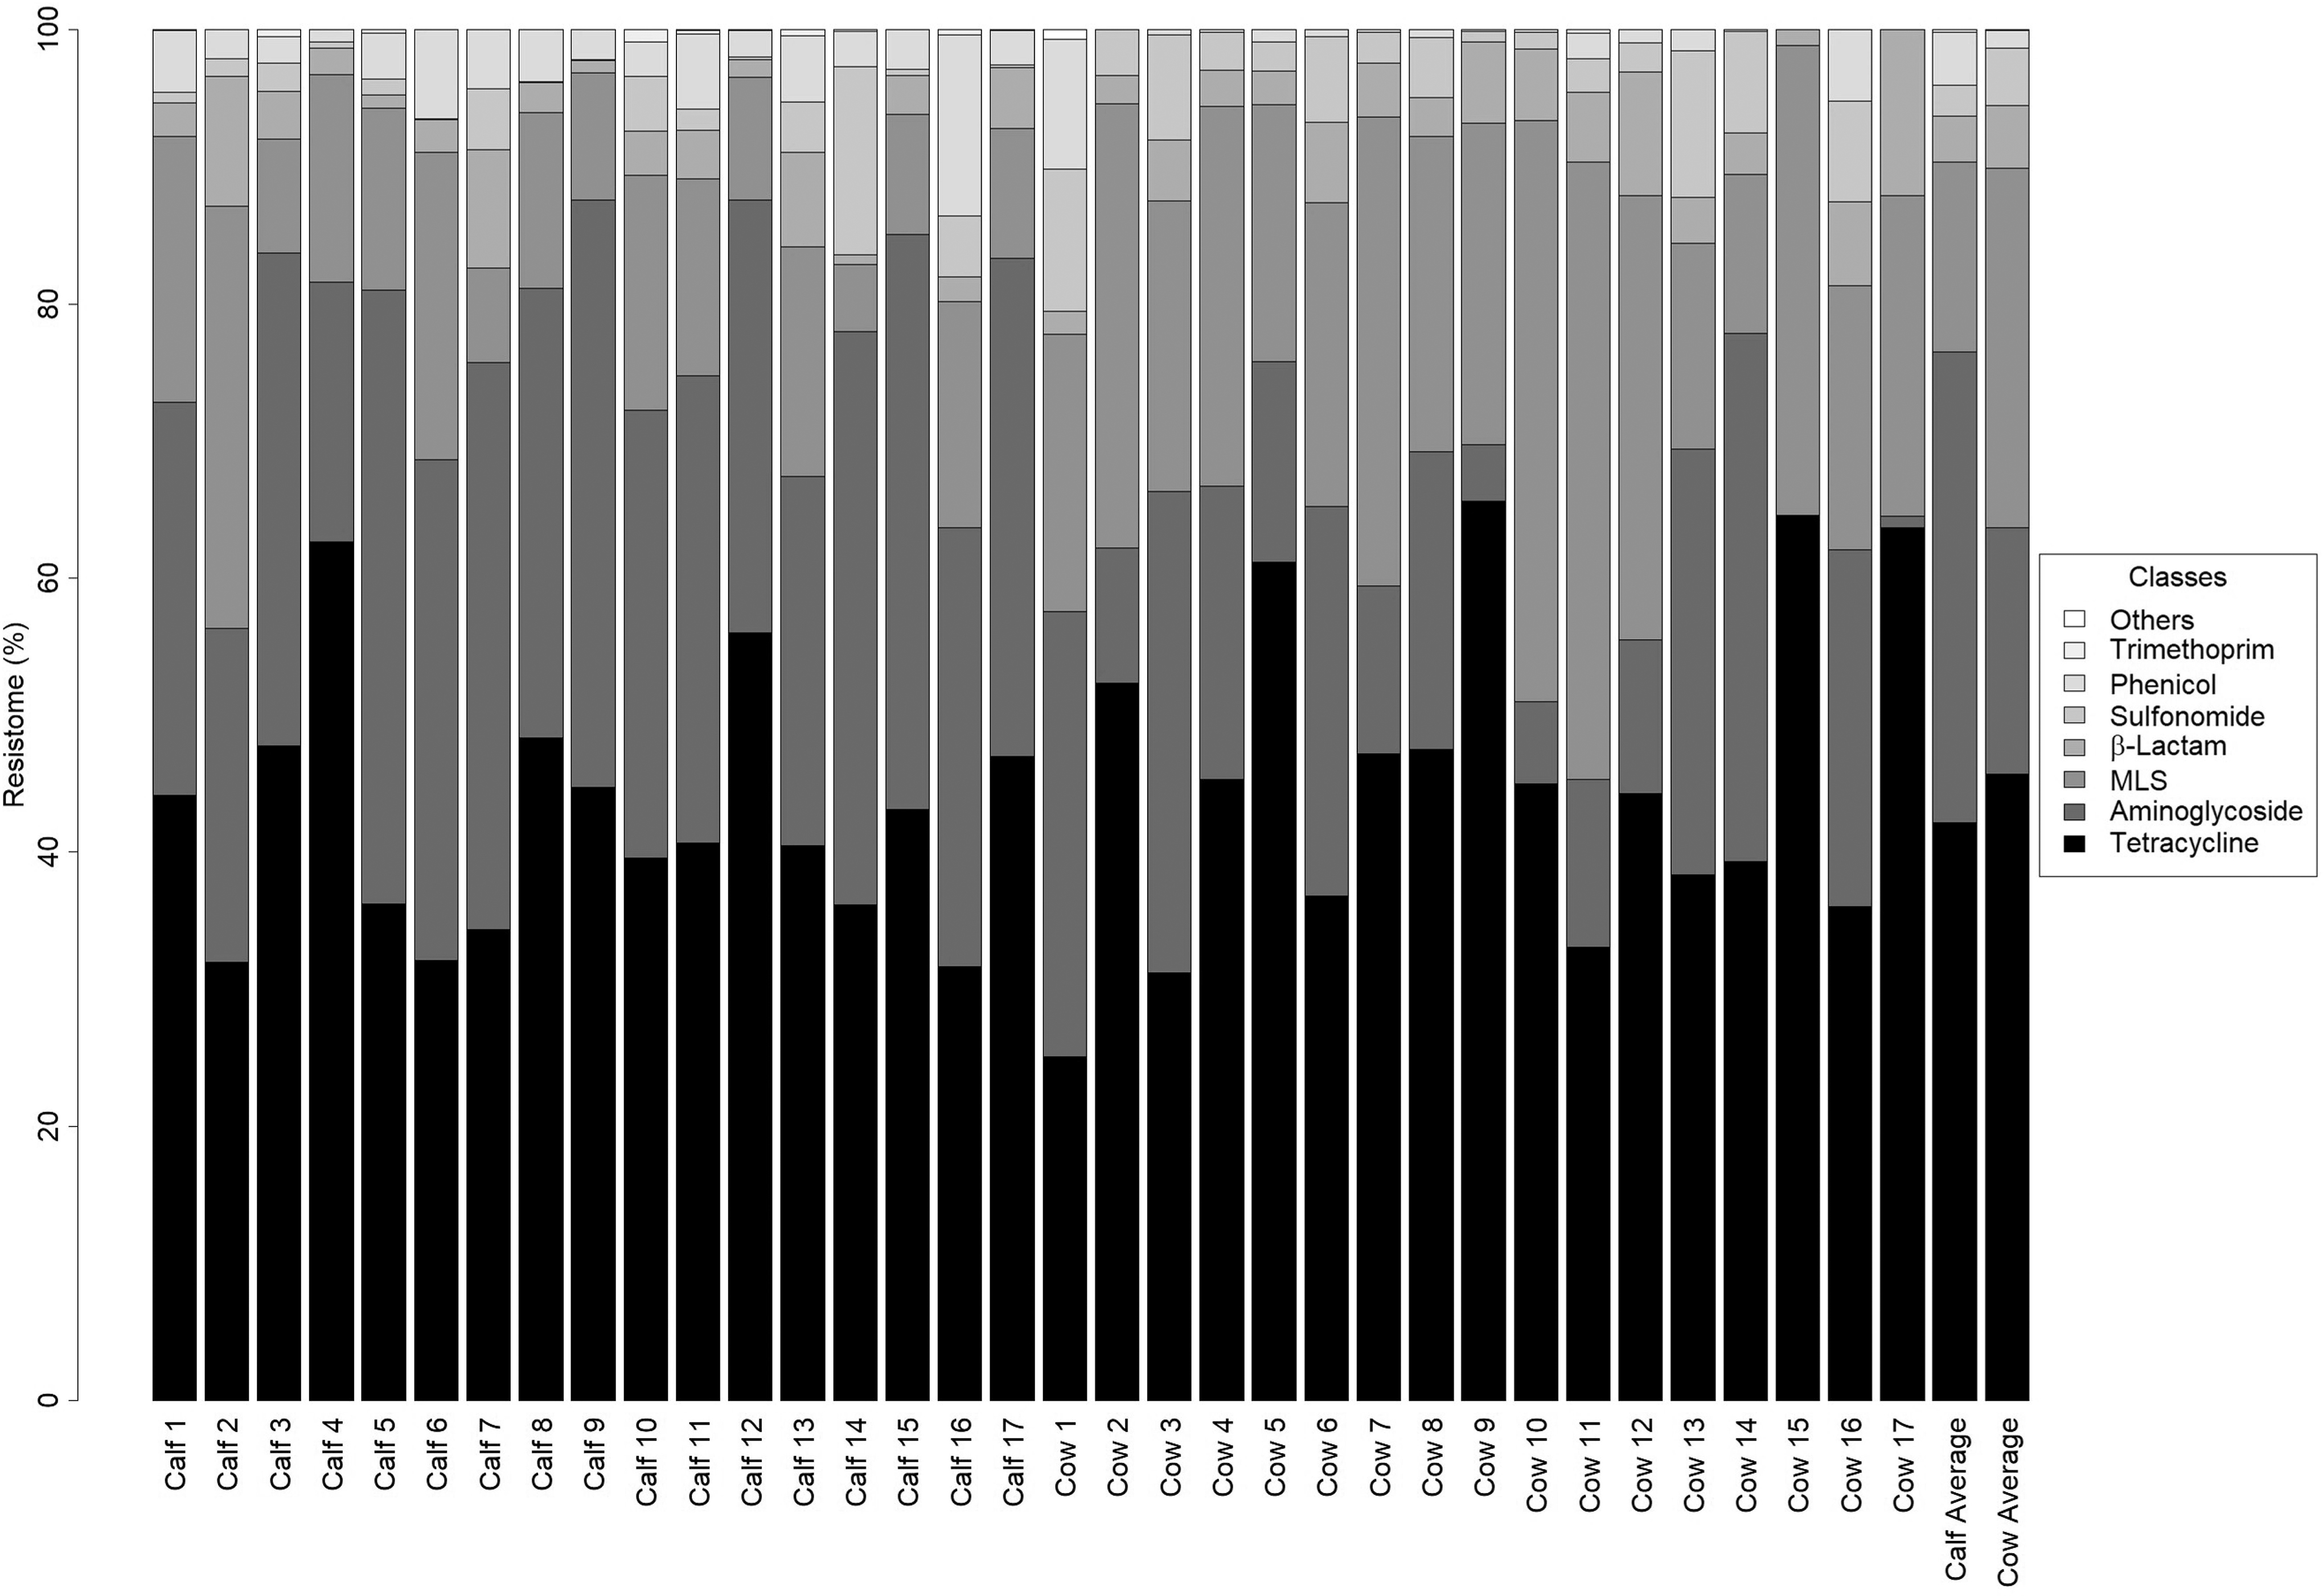
Resistome profiles of composite calf and cow feces. Individual composite samples are labeled on the bottom. The two far right columns are the average resistome composition for calf samples and cow samples. The order of classes on the plot is the same order as the classes on the legend.
The relative abundance of ARGs in calf feces ranged between 4.3 × 10⁻¹/16S rRNA and 2.9 × 100/16S rRNA (median = 1.8 × 100), which was significantly higher than cow feces, which ranged between 1.1 × 10⁻¹/16S rRNA and 6.0 × 10⁻¹/16S rRNA (median = 1.7 × 10⁻¹) (Kruskal
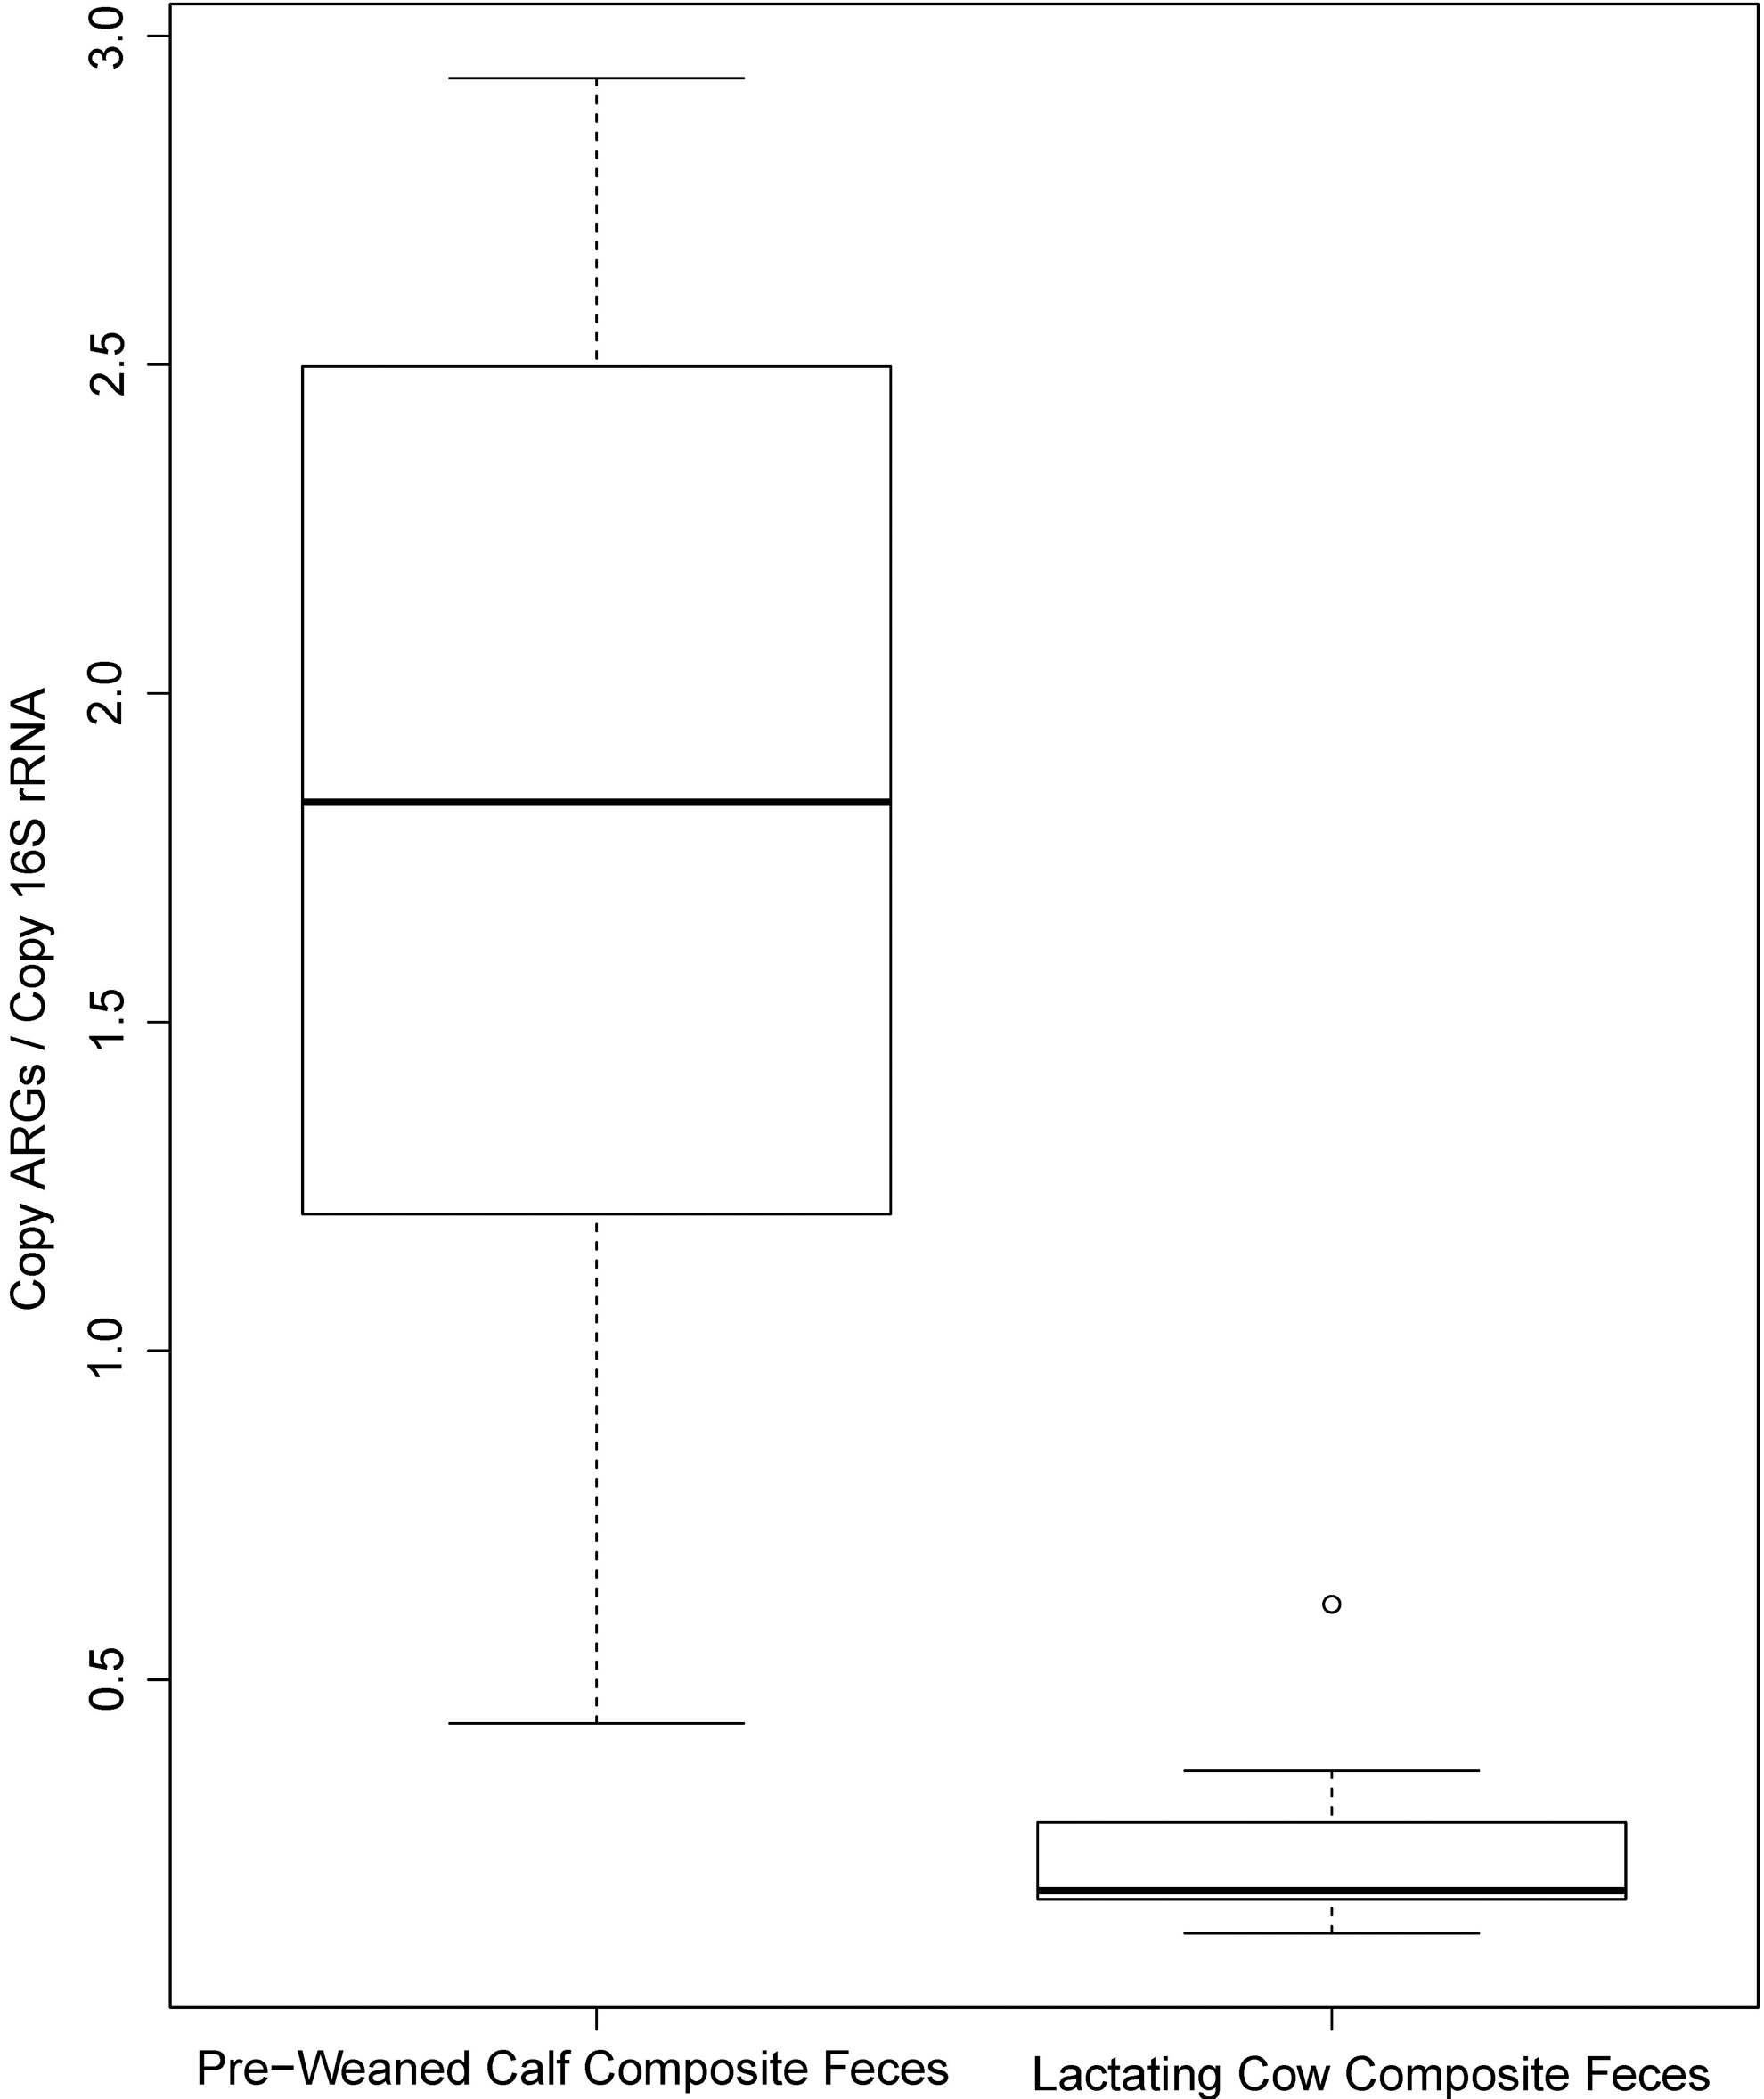
Boxplots of the range of 16S rRNA-normalized ARGs for calf and cow feces. The units on the Y-axis are copy of ARG per 16S rRNA. ARG, antibiotic resistance gene; rRNA, ribosomal RNA.
Resistance Classes That Are Differentially Abundant Between the Two Groups
Units are in ARGs/16S rRNA.
The group (calf column or cow column) in which that class is significantly more abundant.
ARGs, antibiotic resistance genes; MLS, macrolide-lincosamide-streptogramin B; rRNA, ribosomal RNA.
Antibiotic Resistance Genes That Are Differentially Abundant Between the Two Groups
Units are in ARGs/16S rRNA.
The group (calf column or cow column) in which that ARG is significantly more abundant.
ARG, antibiotic resistance gene; MLS, macrolide-lincosamide-streptogramin B; rRNA, ribosomal RNA.
The resistomes at the class and ARG family levels were significantly different between calf and cow feces (Class: ANOSIM R = 0.93; ARG family: ANOSIM R = 0.96; p < 0.001) (Fig. 7). Ordination biplots at the class level indicated that tetracycline, aminoglycoside, and MLS resistance classes strongly influenced the ordination (Supplementary Fig. S5), and at the ARG level, 17 ARGs were identified as having a strong influence on the ordination (envfit R 2 > 0.50 and p < 0.05). Of these, 47% were tetracycline resistance genes, with all but one being a tetracyclines ribosomal protection protein (tetQ, tetX, tetW, tetO/W/O, tetO/W/32/O/W/O, tetO/W, tetO/32/O, tet40). Other ARGs having a significant influence on these ordinations include mefA, ermF, cfrC, aph(3′)-IIIa, aph(3′)-Ia, ant(6)-Ia, aadA9, and aadA16.

Discussion
Results of our analyses confirm a high level of AMR diversity in lactating cow and preweaned calf feces collected from commercial dairy farms in Pennsylvania, as well as significantly different microbial communities and resistomes between the groups. These differences are most likely due to multiple factors, including the naiveté of the preweaned calf gut community being influenced by its surrounding environment including its dam and other animals in the herd; structural differences between the monogastric preweaned calf gut and the more developed rumen of the lactating cow; and differences in diet, which is typically colostrum followed by a liquid milk replacer for preweaned calves and a dry dairy ration of forages, energy concentrates, and protein supplements for cows. Diet has been shown to affect the microbial communities of cattle (de Menezes et al., 2011; Shanks et al., 2011; Henderson et al., 2015; Thomas et al., 2017; Liu et al., 2019a), but the influence of the surrounding environment, which can vary dramatically from farm to farm, may play a significant, but not yet well-quantified role in the development of the microbial community of the calf gut. Interestingly, there was a high level of variability among the community compositions of the calf feces whereas those of the cows demonstrated lower intragroup variability. This difference in calf-versus-cow variability has been previously observed by Dill-McFarland et al. (2017). The diverse suite of influencing mechanisms at an early stage of life may result in variable gut communities between calves on different farms that converge over time to a more “cow-like” composition due to conserved bovine and dairy management pressures. Taxonomic diversity and richness were greater in older animals, indicating that, as the bovine microbiome converges over time, more taxa colonize the gut and these taxa become more evenly distributed.
Bacteroidetes and Firmicutes were among the most abundant phyla and were significantly different, in terms of abundance, between the two groups as were the Firmicutes:Bacteroidetes ratios. These results are similar to those of Klein-Jöbstl et al. (2014), in which Bacteroidetes abundances were high at birth and decreased as calves aged, with Firmicutes concurrently increasing in abundance. These data indicate that there is a major shift in the dominant gut bacteria that occurs during or after the weaning process. It has been suggested that the decrease in Bacteroidetes abundance with an increase in Firmicutes abundance may be related to a decrease in milk consumption with an increase in fiber consumption that occurs during weaning (Kim et al., 2014; Klein-Jöbstl et al., 2014).
Resistomes were also different between calf and cow feces, and ARGs were detected at a higher relative abundance in calf than cow feces. These results correspond with previous studies in which cultured resistant Escherichia coli was identified in greater abundance in calf than cow feces (Hinton et al., 1985; Khachatryan et al., 2004; Berge et al., 2010; Liu et al., 2019b; Springer et al., 2019) and are similar to previous molecular-based studies (Noyes et al., 2016; Liu et al., 2019a, 2019b). Although samples from our study were collected as composites from the pen floor, consistency with other studies indicates that environmental contamination was minimal, if at all. Interestingly, based on the ordination, there were several calf and cow samples that had resistomes more similar to each other than to other samples collected from the same age group, indicating that there can exist noticeable similarities between the resistomes of animals of different ages and diets.
It is known that antibiotic treatment or use of medicated milk replacers (MMR) can select for resistant bacteria, allowing for proliferation of these organisms in the gut of treated animals and possibly untreated co-located animals (Kaneene et al., 2008). However, multiple studies have contradictory results and demonstrated that treatment may, at times, result in no change in the level of resistance (Averill, 2009) or marginal differences in resistance to some antibiotics (Vikram et al., 2017). Higher levels of resistance in calves may not be solely attributed to the use of antibiotics or MMR, as studies have indicated that even in the absence of MMR and antibiotic usage AMR abundance in young animals can be higher than that of older animals (Sato et al., 2005; Thames et al., 2012; Gerzova et al., 2015; Liu et al., 2019a). Khachatryan et al. (2004) postulated that resistant bacteria are maintained in the calf gut by the selection of associated elements that are not involved in resistance encoded by these resistant bacteria. Selection of these bacteria in the calf gut may be enhanced by antibiotic treatment. Conflicting findings from multiple studies of different animals indicate that the gut communities and the dynamics therein of food animals are highly complex and the drivers of AMR carriage may be multifactorial.
Interestingly, it appears that the difference in the resistomes between animal groups is mostly impacted by tetracycline and aminoglycoside resistance. Of the ARGs that were more abundant in calf samples, approximately 50% were tetracycline resistance genes and approximately 25% were aminoglycoside resistance genes. Among the most common reasons for treatment of preweaned calves with antibiotics nationwide is the inclusion of respiratory and gastrointestinal infections (21% and 12% of operations, respectively) and antibiotics used for these treatments include tetracyclines, β-lactams, trimethoprim/sulfonamides, macrolides, aminoglycosides, and phenicols (USDA APHIS, 2014). We were unable to gather data on which antibiotic therapies were used during the study, but treatment of calves for respiratory, gastrointestinal, navel, and other infections may be associated with shifts in resistome structures and abundance of ARGs. This could, in part, be a causal factor in the differences in resistome structures since lactating dairy cows may be treated less frequently than calves, and this would most likely be in response to mastitis.
The impact of potential donor sources (dam, environment, herd) on the development of the calf gut communities and the establishment and maintenance of resistance in this community is currently not well quantified. A recent study by Liu et al. (2019a) indicated that colostrum is a potential source of ARGs for young calves and that heavy metals and biocides, frequently detected in animal feed, could maintain AMR in the animal gut through co-selection of biocide and metal resistance genes. Another potential donor to the calf gut community is the dam (Klein-Jobstl et al., 2019), but it is difficult to link this source to the higher abundance of resistance and different composition of the calf gut resistome. More work will need to be conducted on the factors that are responsible for these differences and potential ways to mitigate them without sacrificing calf health.
Results of this study demonstrate a clear difference between the communities and resistomes of preweaned calf and lactating cow feces in commercial dairy herds, indicating that although antibiotic resistance presents a significant public health issue, waste or food products from calves and cows may present different risks. This work supports previous culture and molecular-based analyses that demonstrated significant age-related differences in the types of AMR and abundances identified in bovine feces. Future work should focus on the sources and maintenance of resistant bacteria succeeding birth and the development of the gut community, as well as the shifts in the resistome structure over time. Environmental and host factors that apparently select for AMR bacteria in young animals should be identified and further evaluated to reduce the load of AMR bacteria shed by these young animals.
Footnotes
Acknowledgments
The authors would like to acknowledge the efforts of Jakeitha Sonnier, Laura Del Collo, and Huilin Cao for their laboratory assistance. The mention of a trade name, proprietary product, or specific equipment does not constitute a guarantee or warranty by the USDA and does not imply approval to the exclusion of other products that might be suitable.
Disclosure Statement
No competing financial interests exist.
Funding Information
This project was supported by internal USDA/ARS research funding.
Supplementary Material
Supplementary Figure S1
Supplementary Figure S2
Supplementary Figure S3
Supplementary Figure S4
Supplementary Figure S5
References
Supplementary Material
Please find the following supplemental material available below.
For Open Access articles published under a Creative Commons License, all supplemental material carries the same license as the article it is associated with.
For non-Open Access articles published, all supplemental material carries a non-exclusive license, and permission requests for re-use of supplemental material or any part of supplemental material shall be sent directly to the copyright owner as specified in the copyright notice associated with the article.