
Abstract
The extent of chlorine inactivation and sublethal injury of stationary-phase (STAT) and long-term survival-phase (LTS) cells of Shiga toxin
Introduction
Fresh produce grown in natural environments can be contaminated from several sources, including irrigation water, soil, windblown dust, insects, contaminated manure, and feral or domestic animals (Alegbeleye et al., 2018; FDA, 2019). Preharvest contamination could spread during postharvest processing (Macarisin et al., 2017). During washing, vegetables or fruits are dumped in water in flumes or tanks, and the chances of microbial cross-contamination are significant (Uyttendaele et al., 2015; Gombas et al., 2017; Murray et al., 2017). Since fresh produce is usually eaten raw, postharvest washing is crucial for reducing pathogens. In the produce industry, chlorination is commonly used because it is economical, easy to use, and effective in killing vegetative bacteria (Gombas et al., 2017; FDA, 2019; DaCruz Nizer et al., 2020). However, the physiological state of bacteria can impact the effectiveness of chlorine. For example, starved Escherichia coli O157:H7 exhibited increased resistance to chlorine (Lisle et al., 1998), and long-term stationary-phase (STAT) cells of Salmonella enterica were more resistant to sodium hypochlorite (NaOCl) compared with STAT cells (Djebbi-Simmons et al., 2019).
Traditionally, studies on bacterial inactivation by chemical sanitizers have used STAT cells, which are more resistant to antimicrobials compared with exponential-phase cells (Cherchi and Gu, 2011; Pletnev et al., 2015; Alborzi et al., 2018). Therefore, it is widely believed that STAT bacteria are ideal for use in efficacy testing of antimicrobials (Beuchat et al., 2001; Wirtanen et al., 2001). The STAT in the bacterial life cycle is followed by the death phase, after which bacteria enter a long-term survival phase (LTS) (Wen et al., 2009) and can persist in that phase for months or years (Wang et al., 2018).
The LTS bacteria occur in agricultural soil (Fremaux et al., 2008) and water where nutrients can become limiting and there is strong competition for those nutrients (Finkel, 2006). In many terrestrial environments, microbes encounter variations in nutrient availability that result in a feast or famine condition from intermittent periods of growth and starvation (Almiron et al., 1992; Kolter, 1993; Morita, 1997). During starvation, many saprophytic bacteria, including E. coli, are not completely killed, but transition to the LTS (Lappin-Scott and Costerton, 1990; Finkel, 2006) and exhibit increased stress tolerance (Finkel, 2006). The LTS cells of Listeria monocytogenes were more tolerant to heat or high pressure compared with STAT and exponential-phase cells (Wen et al., 2009). Wang et al. (2018) reported that LTS Salmonella Typhimurium were more resistant to UV radiation compared with STAT and exponential cells in apple juice. More recently, LTS Salmonella Typhimurium on inanimate surfaces exhibited increased tolerance to NaOCl (p < 0.05) compared with STAT cells (Djebbi-Simmons et al., 2019).
In nature, where there are numerous environmental stresses, bacteria most often exist as LTS cells (Finkel, 2006). Therefore, pathogens such as Shiga toxin
Materials and Methods
Bacterial cultures and culture conditions
Four strains of E. coli were obtained from the culture collection of the Microbial Food Safety Laboratory at Iowa State University (Ames, IA). The E. coli O121:H19 strain was isolated from a lettuce outbreak in 2006 (Mathusa et al., 2010). E. coli serotypes, O26:H11 and O145:NM, were isolates from human diarrheal stool samples from Nebraska (Fey et al., 2000). E. coli O157:H7 ATCC 43895, a ground beef isolate, was purchased from the American Type Culture Collection (Manassas, VA). The stock cultures were maintained at −80°C in brain-heart infusion (BHI) broth (Difco, Becton Dickinson, Sparks, MD) containing 10% (v/v) glycerol. Frozen stock cultures were thawed under running water and activated separately in tryptic soy broth supplemented with 0.6% (w/v) yeast extract (TSBYE) by incubation (35°C) for 24 h. Before each experiment, working cultures of STAT cells were prepared through two consecutive 24-h transfers of the thawed stock cultures in TSBYE (35°C). To prepare LTS cells, 1 mL of each bacterial strain from the corresponding working culture was transferred to 199 mL of TSBYE in sterile Erlenmeyer flasks (250 mL), followed by incubation (35°C) for 21 d.
Preparation of inoculum
Equal volumes of each STEC culture were combined to obtain a four-strain mixture of STAT or LTS cells after incubation (35°C) for 24 h and 21 d, respectively. The four-strain mixtures were harvested by centrifugation (10,000 × g, 10 min, 22°C) using a Sorvall Super T21 centrifuge (American Laboratory Trading, Inc., East Lyme, CT). The pelleted cells were suspended in Dulbecco's phosphate-buffered saline (DPBS; GE Healthcare, Pittsburg, PA) and washed by vortexing. The washed cells were harvested by centrifugation, as previously described. Appropriate amounts of fresh DPBS were added to the pelleted cells to obtain ∼9.0 log CFU/mL for STAT or LTS cells, as determined by colony counts on tryptic soy agar supplemented with 0.6% (w/v) yeast extract (TSAYE).
Minimum bactericidal concentration
Reagent-grade NaOCl was purchased from Sigma-Aldrich (Milwaukee, WI). The minimum bactericidal concentration (MBC) of chlorine for STAT and LTS cells was determined using the broth dilution method (Lopez-Malo and Palou, 2005). Serial dilutions (twofold) of chlorine stock solution (100 ppm, pH 6.5) were prepared in sterile distilled water (pH 6.5) to obtain concentrations of 0.01 to 5 ppm. Each tube of NaOCl (10 mL per tube) was inoculated with 50 μL of a diluted (threefold) suspension of STAT or LTS cells to obtain ∼5.0 log CFU/mL. Inoculated, sterile distilled water without NaOCl served as the positive control. All inoculated solutions were incubated (35°C) and after 24 h, 10-μL aliquots were plated on tryptic soy agar (Difco, Becton Dickinson) supplemented with 0.6% (w/v) yeast extract (TSAYE). The MBC was the minimum concentration of free chlorine that produced a 3.0 log (99.9%) reduction in the initial population of STEC after incubation (35°C) for 24 h (CLSI, 1999).
Preparation of chlorine solutions and treatment of STEC
In vitro model
NaOCl was diluted in sterile 0.85% (w/v) NaCl (saline) to prepare chlorine solutions (0.25–10 ppm free chlorine). NaOCl concentrations were adjusted to compensate for volume changes from adding 1.0-mL aliquots of the STEC inoculum. Free chlorine was measured twice with a Hach Colorimeter (DR300 Model) using the DPD (N,N diethyl-1,4 phenylenediamine sulfate) reagent method (Eaton and Franson, 2005). The pH of chlorine solutions was adjusted to 6.5 using hydrochloric acid (1 M) and sodium hydroxide (1 M). A portion (10 mL) of each solution was transferred to a separate, sterile, 15-mL centrifuge tube. Aliquots (1.0 mL) of STAT and LTS cells were each added to separate tubes to obtain an initial viable cell population of ∼7.8 log CFU/mL. The contents of the tubes were mixed by vortexing just after inoculation and the free chlorine was neutralized after 30 s with 500 ppm sodium thiosulfate (Na2S2O3; Fisher Scientific, Hampton, NH). The neutralizing effect was confirmed by testing the highest concentration of chlorine for the absence of free chlorine (Hegde et al., 2012).
Lettuce wash model
Romaine lettuce heads with no prior postharvest wash treatment were procured and refrigerated (4°C) until further use. Nonblemished leaves were detached from the heads and analyzed for indigenous E. coli and aerobic plate count. Areas (each 6.15 cm2) of leaves were aseptically excised using the opening of a sterile 50-mL centrifuge tube. The upper surfaces of the leaves (three samples per treatment solution) were each spot-inoculated with 50 μL (∼7.40 log CFU/leaf sample [6.15 cm2]) of STAT or LTS cells. Inoculated samples were held for 2 or 20 h in sterile Petri dishes (with lids on) in a laminar flow, BSL2 biosafety cabinet (22°C ± 1°C) for drying of the inoculum.
Chlorine solutions (10–40 ppm) were prepared using tap water to simulate field situations. Portions (30 mL) of free chlorine solution (pH 6.5) were placed in sterile Whirl-Pak bags, and three inoculated leaf samples were added to each solution. Each bag was manually shaken for 60 s, and Na2S2O3 (500 ppm) was added to neutralize the reaction. The leaf samples were manually shaken for 30 s before testing the wash solution for STEC survivors.
Microbiological analysis
Neutralized chlorine solutions were serially diluted (10-fold) in 0.1% (w/v) buffered peptone water (Becton Dickinson) and surface-plated on sorbitol–MacConkey agar (SMAC; Oxoid, Ltd., Basingstoke, England, United Kingdom) and TSAYE. Three 1.0-mL aliquots of treatment solution were each added to a separate 9-mL portion of TSBYE and incubated (35°C) for 48 h. When numbers of bacterial survivors were lower than the detection limit (1.0 log CFU/mL), enriched samples were streak-plated onto SMAC and incubated (35°C) for 48 h to determine the presence of STEC.
Determination of sublethal injury
The plate counts from the nonselective agar (TSAYE) and selective agar (SMAC) were used to evaluate sublethal injury in STEC survivors. The following equation was used to calculate percent injury, as described by Lan et al. (2019) and Tian et al. (2018):
Bacterial colony counts were mean values obtained from three replications of the experiments.
Scanning electron microscopy
Inoculated leaf samples were fixed with 1% paraformaldehyde and 3% glutaraldehyde in cacodylate buffer (0.1 M; pH 7.2) at 4°C for at least 1 h. After fixation, samples were rinsed three times each with 5 mL of cacodylate buffer (0.1 M) and then postfixed in 1% osmium tetroxide in cacodylate buffer (0.1 M) for 1 h. After several washes with deionized water, samples were dehydrated through a graded ethanol series (25%, 50%, 70%, 85%, 95%, and 100%) for 15 min per concentration. Samples were critical point-dried using a Denton Vacuum, Inc., drying apparatus, Model DCP-1 (Denton Vacuum, Inc., Moorestown, NJ). Dried samples were mounted on aluminum stubs with carbon tape and colloidal silver paint and sputter-coated with platinum using a Cressington HR208 sputter coater. Images were captured using a Hitachi SU-4800 field emission scanning electron microscope at 10 kV (
Statistical analysis
Inactivation data for STEC cells were recorded as log10 CFU/mL and analyzed using Microsoft Excel and Statistical Analysis Software (SAS), version 9.4 (SAS Institute, Inc., Cary, NC). Statistical comparisons were performed using Tukey's Honestly Significant Difference (HSD) test in JMP®, version Pro 13 (SAS Institute, Inc.). Assuming normality, data were analyzed using two-way analysis of variance, and the level of significance was set at 0.05. Three replications of each experiment were performed.
Results and Discussion
Minimum bactericidal concentration
The average MBC for STAT and LTS cells in distilled water was 0.04 and 0.08 ppm, respectively. Based on these results, the minimum concentration of chlorine to inactivate LTS cells in water was twice that required to kill STAT cells. The MBC tests were performed using distilled water because organic components in laboratory broth would have decreased the free chlorine concentration (Kotula et al., 1997; Shang and Blatchley III, 2001). More importantly, when LTS cells are exposed to a nutritious medium, they revert to a logarithmic phase of growth (Wen et al., 2009; Wang, 2017). This reversion prevents accurate comparison of STAT and LTS cells.
Chlorine treatment of STEC cells in vitro
Figure 1 shows survivors (log CFU/mL) of planktonic STEC cells following exposure (30 s) to chlorine in saline (pH 6.5) at 22°C ± 1°C. The STAT cells were rapidly inactivated by chlorine (1.0 ppm) and were not detected at the higher chlorine concentrations (2.5, 5.0, and 10 ppm) tested. However, LTS survivors were at 5.1 (2.5 ppm), 3.71 (5.0 ppm), and 2.55 (10 ppm) log CFU/mL. The tailing of the inactivation curve for LTS cells suggests that with increasing chlorine concentrations, there was a disproportionately lower log reduction in the LTS cells. These results demonstrate that planktonic LTS cells have a higher chlorine tolerance compared with STAT cells (p < 0.05).
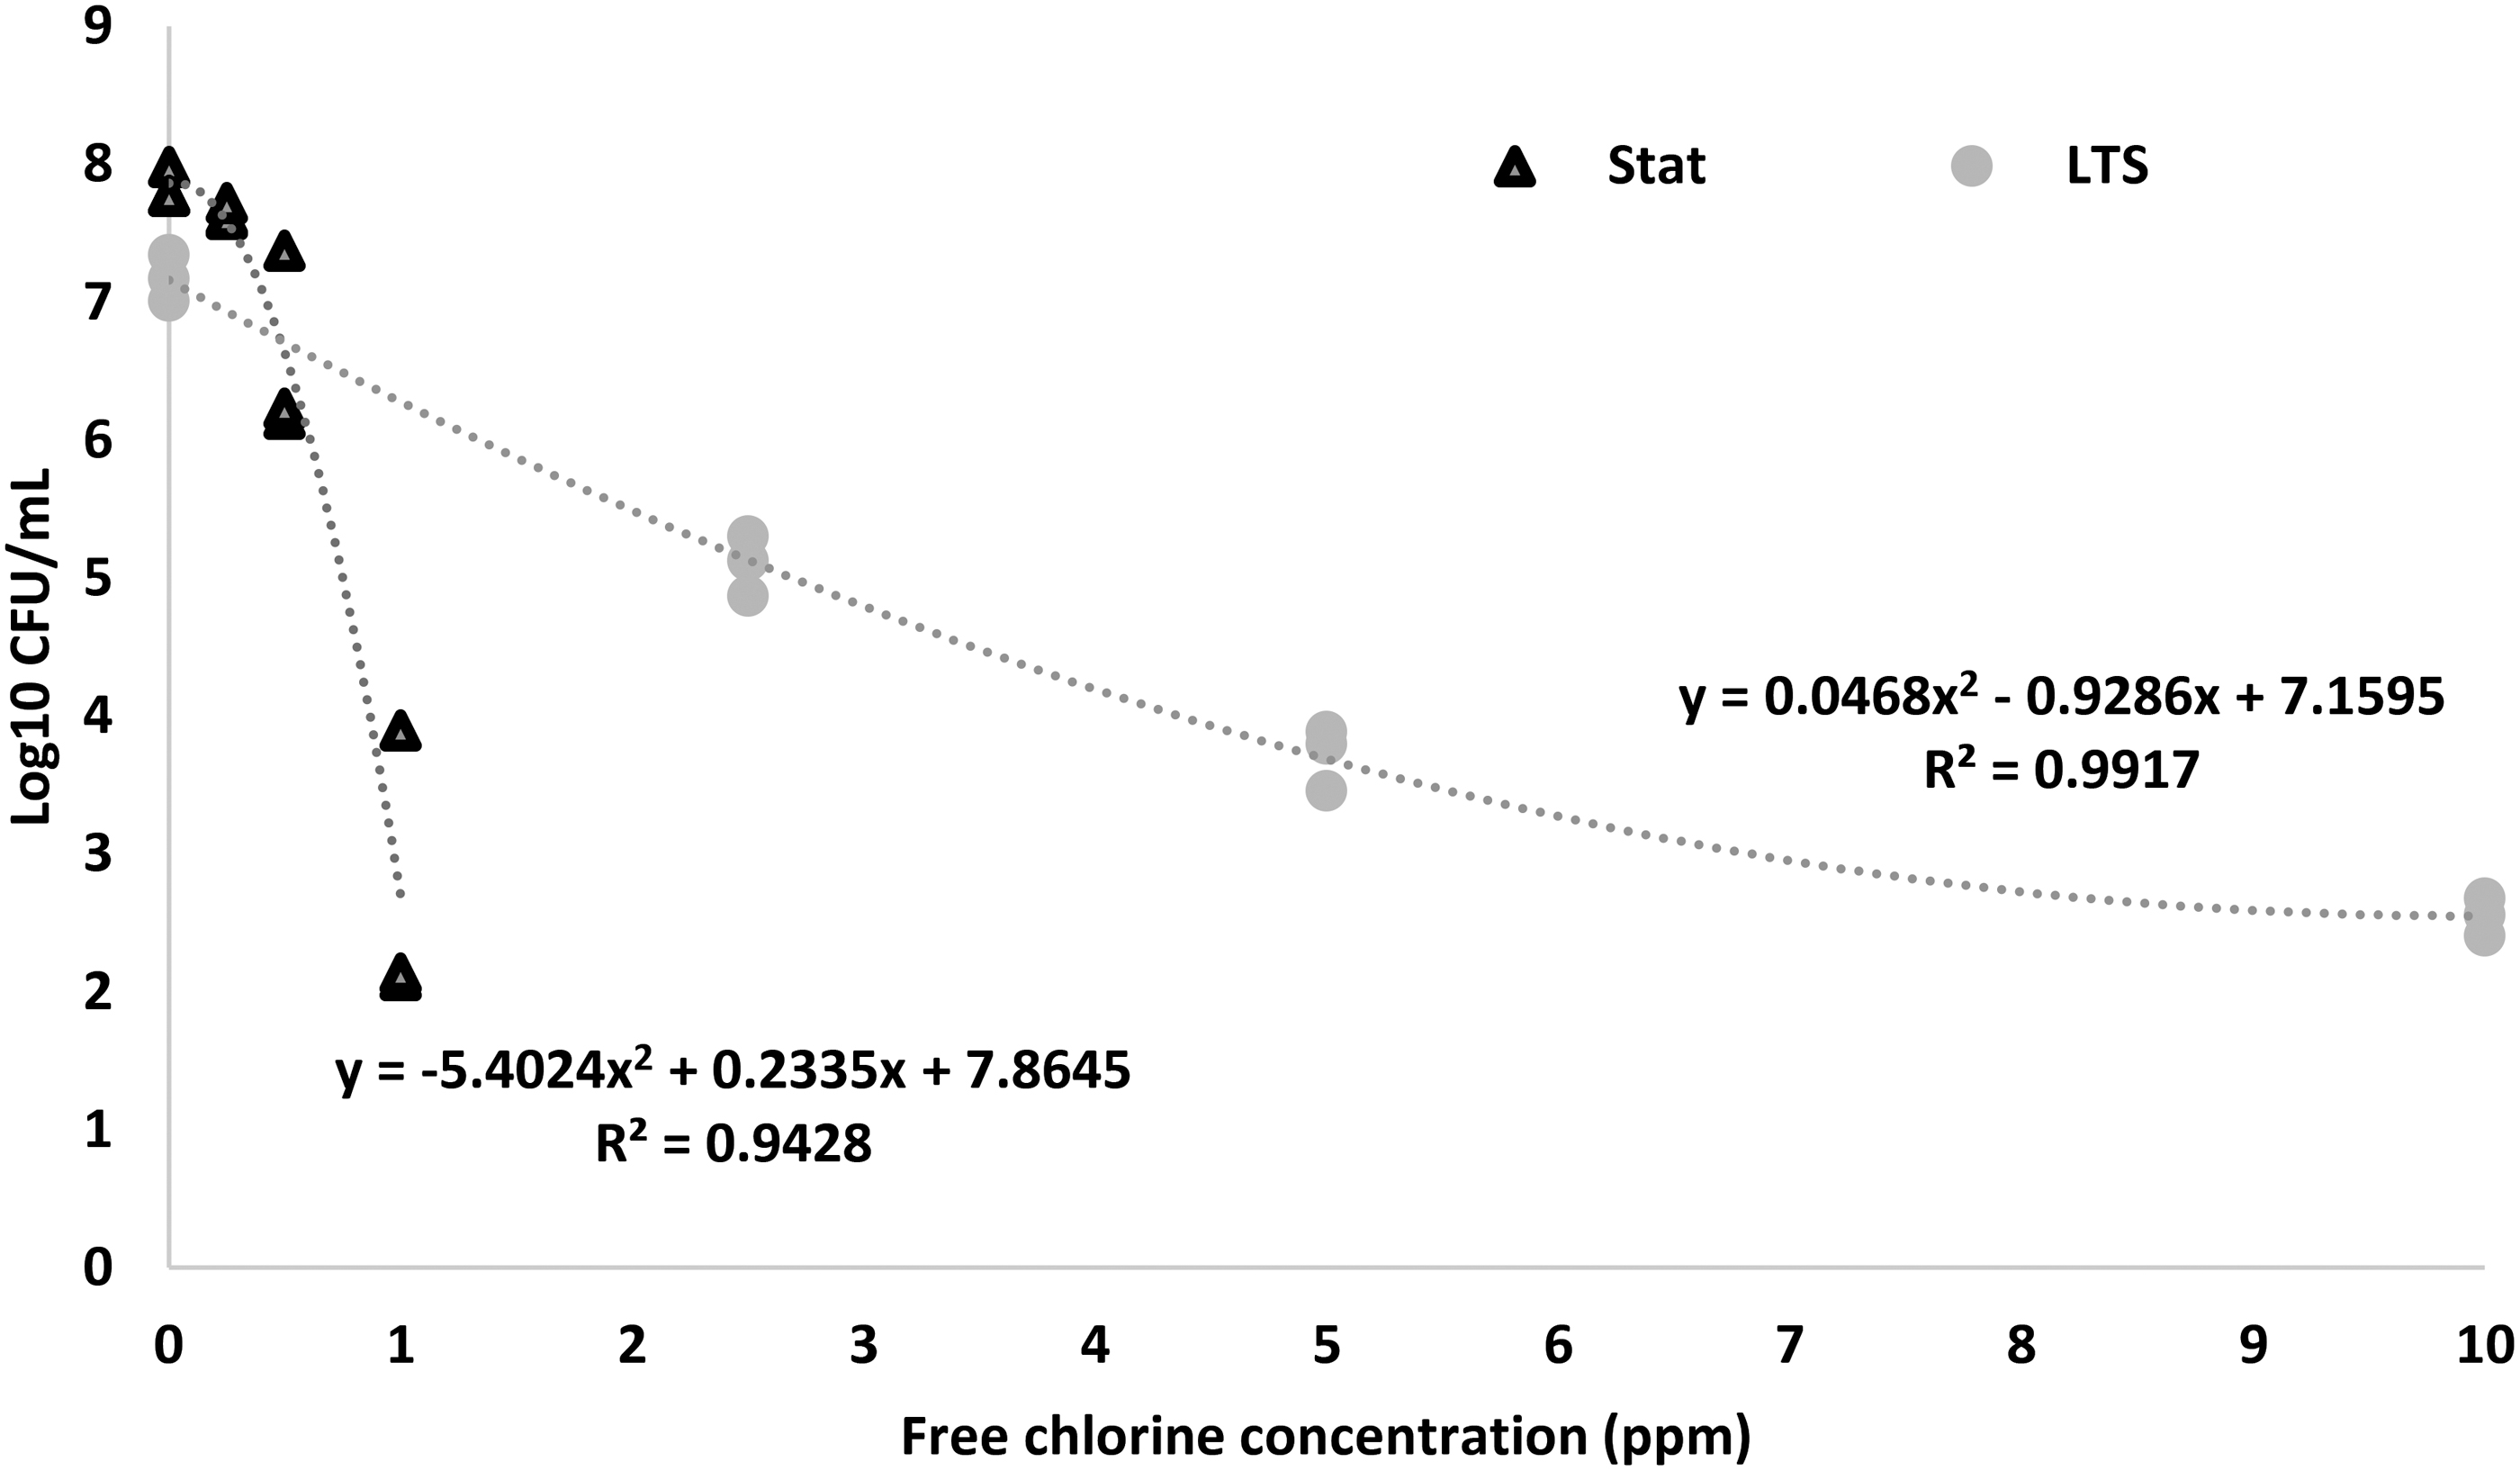
Surviving populations of stationary-phase and long-term survival-phase Escherichia coli following exposure (30 s) to various concentrations of free chlorine in 0.85% (w/v) NaCl (saline).
Chlorine can nonselectively oxidize and thus damage components of the bacterial cell (Shang and Blatchley, 1999; Mizozoe et al., 2019). The first part of the Gram-negative bacterial cell to come in contact with the chlorine solution is the outer lipopolysaccharide membrane. Therefore, oxidative damage by hypochlorous acid will start at the surface of that membrane and likely continue within the cell envelope as it penetrates the cell. Exposure of E. coli and Yersinia enterocolitica to chlorine caused entry of propidium iodide in the cells and leakage of 260 nm-absorbing substances, indicating permeabilization of the cytoplasmic membrane (Virto et al., 2005a). Therefore, chlorine-induced damage to the bacterial cell envelope might allow more of the antimicrobial to enter the cell and damage components such as DNA and proteins (Block, 2001; Virto et al., 2005b; Cho et al., 2010; DaCruz Nizer et al., 2020).
It is conceivable that changes in the cell envelope of LTS cells contributed to their increased tolerance to chlorine compared with STAT cells. Results of an earlier study indicated that LTS cells of L. monocytogenes were coccoid forms, which exhibited a contracted cell wall and condensed cytoplasm (Wen et al., 2009). Wen et al. (2011) reported that genes related to the cell envelope structure were significantly (p < 0.05) upregulated in LTS L. monocytogenes. Therefore, the higher chlorine tolerance of LTS cells in this study might be partly due to a modified cell envelope, which is less susceptible to damage by chlorine. In addition, we speculate that increased chlorine tolerance in LTS cells might be due to protection of DNA and proteins by condensation of the cytoplasm (Wen et al., 2009). Further research is needed to specifically elucidate how LTS bacterial cells are more tolerant to chlorine.
Chlorine tolerance of STEC on lettuce
Figure 2A and B shows the effect of phase on chlorine tolerance of STEC cells after contact with lettuce for 2 and 20 h. After 2 h on lettuce, STAT cells exposed to 10, 20, and 40 ppm chlorine decreased by 1.21, 1.64, and 1.85 log CFU/mL, respectively. In contrast, reductions of LTS cells were only 0.88, 0.94, and 0.83 log CFU/mL, respectively. At 20 and 40 ppm of chlorine, larger reductions (p < 0.05) occurred in STAT cells compared with LTS cells (Fig. 2A). Higher chlorine tolerance of LTS cells compared with STAT cells was reported for Salmonella Typhimurium attached to food contact surfaces (Djebbi-Simmons et al., 2019); the authors demonstrated that the disinfection efficacy of NaOCl (95 ppm) was higher for STAT cells (40%) compared with LTS cells (31%) (p < 0.05). Reductions of STAT cells (20 h on lettuce) were consistently higher than those of LTS cells after exposure to 10, 20, and 40 ppm chlorine; however, differences were not significant (p > 0.05) (Fig. 2B).

Effect of the life cycle phase on chlorine tolerance of Shiga toxin
The previously stated results reveal a higher chlorine tolerance of STEC cells attached to lettuce compared with planktonic cells (Figs. 1 and 2A, B). This is not surprising considering that planktonic bacteria are killed faster than those attached to fresh produce (Davidson et al., 2014; Fu et al., 2018). Additionally, for STEC (2 h on lettuce), the higher reductions of STAT cells compared with LTS cells (p < 0.05) indicate a greater chlorine tolerance of LTS cells (Fig. 2A). Although not significant (p > 0.05), the reductions of STAT cells (20 h) were apparently lower (0.19, 0.41, and 0.54 less) than those of STAT cells (2 h) after exposure of cells to 10, 20, and 40 ppm chlorine, respectively. Reductions of LTS cells (2 h) compared with LTS cells (20 h) did not decrease following chlorine treatment. These results suggest that the STAT cells (20 h) likely underwent some change that increased their tolerance to chlorine.
In this study, the low nutrient status of water in the inoculum and drying of the inoculum on lettuce for 20 h could have triggered a stress-hardening response that increased the cells' tolerance to chlorine. Lisle et al. (1998) reported that nutrient starvation in E. coli O157:H7 resulted in a chlorine-resistant phenotype. In addition, starved E. coli developed resistance to chlorine-based disinfection (Du et al., 2015). During drying, viable bacteria accumulate ions and compatible solutes (Potts, 1994) that stabilize cell components such as DNA, proteins, and ribosomes (Pleitner et al., 2012; Finn et al., 2013). Although the bacterial cell envelope is damaged by chlorine, chlorine's main antibacterial action seems to involve damage to DNA and proteins (Virto et al., 2005b; Cho et al., 2010). This is supported by the fact that the cytoplasmic membrane becomes permeable to cytoplasmic material at 50 ppm chlorine; however, bacterial cells can be killed by lower concentrations (Virto et al., 2005a). Interestingly, although LTS cells were exposed to similar conditions on lettuce, those cells did not exhibit an increase in chlorine tolerance after 20 h on lettuce. Due to the dormancy of LTS cells (Wen et al., 2009), we hypothesize that those cells cannot make physiological adjustments typically induced by nutrient limitation or desiccation to develop further tolerance to chlorine treatment.
Sublethal injury
Table 1 shows injury in STEC survivors of chlorine treatment after 2 and 20 h on lettuce. The LTS survivors of 40 ppm chlorine had lower sublethal injury compared with STAT survivors (p < 0.05). Our results are consistent with those of Wang et al. (2018) who reported less sublethal injury in LTS Salmonella Typhimurium compared with STAT cells following exposure to ultraviolet radiation (1500 μW/cm2) in apple juice (p < 0.05).
Sublethal Injury (%) in Stationary-Phase and Long-Term Survival-Phase Escherichia coli After 2 and 20 H of Contact with Lettuce, Followed by Exposure to Chlorine Solutions for 60 S
Means with the same letter within a row are not significantly different.
Sublethal injury in microorganisms refers to repairable structural and/or metabolic damage caused by a physical or chemical treatment (Russell, 1984; Han et al., 2018). The occurrence of sublethally injured pathogens in food is a food safety problem because those cells might not be detected on selective media, but later resuscitate and multiply to pose a significant health risk (Dhakal et al., 2019; Lv et al., 2019). Determination of injury in pathogen survivors is crucial for two major reasons. First, failure to detect injured survivors can erroneously overestimate the effectiveness of an antimicrobial treatment. Second, treatments that cause sublethal injury provide opportunities for their application in combination with other hurdles to prevent repair and ultimately cause death of the pathogen. In this study, the low extent of injury in LTS survivors suggests that they were less susceptible to chlorine damage compared with STAT cells.
Scanning electron microscopy
Figure 3 shows scanning electron microscope (SEM) images of STAT (Fig. 3A) and LTS cells (Fig. 3B) on lettuce for 20 h. The STAT cells consisted of predominantly long rods, whereas the LTS cells (shown in red color) consisted of smaller short rods (Fig. 3B). Other researchers have also reported changes in morphology of LTS cells. For example, The LTS S. enterica strains were much smaller compared with the exponential-phase or STAT cells (Wang, 2017), and LTS L. monocytogenes strains were coccoid (Wen et al., 2009). In our study, long rods among the LTS cells are unavoidable because LTS cells are formed after the death phase during which some STAT cells (larger rods) die and therefore do not transition to the LTS (Wen et al., 2009).
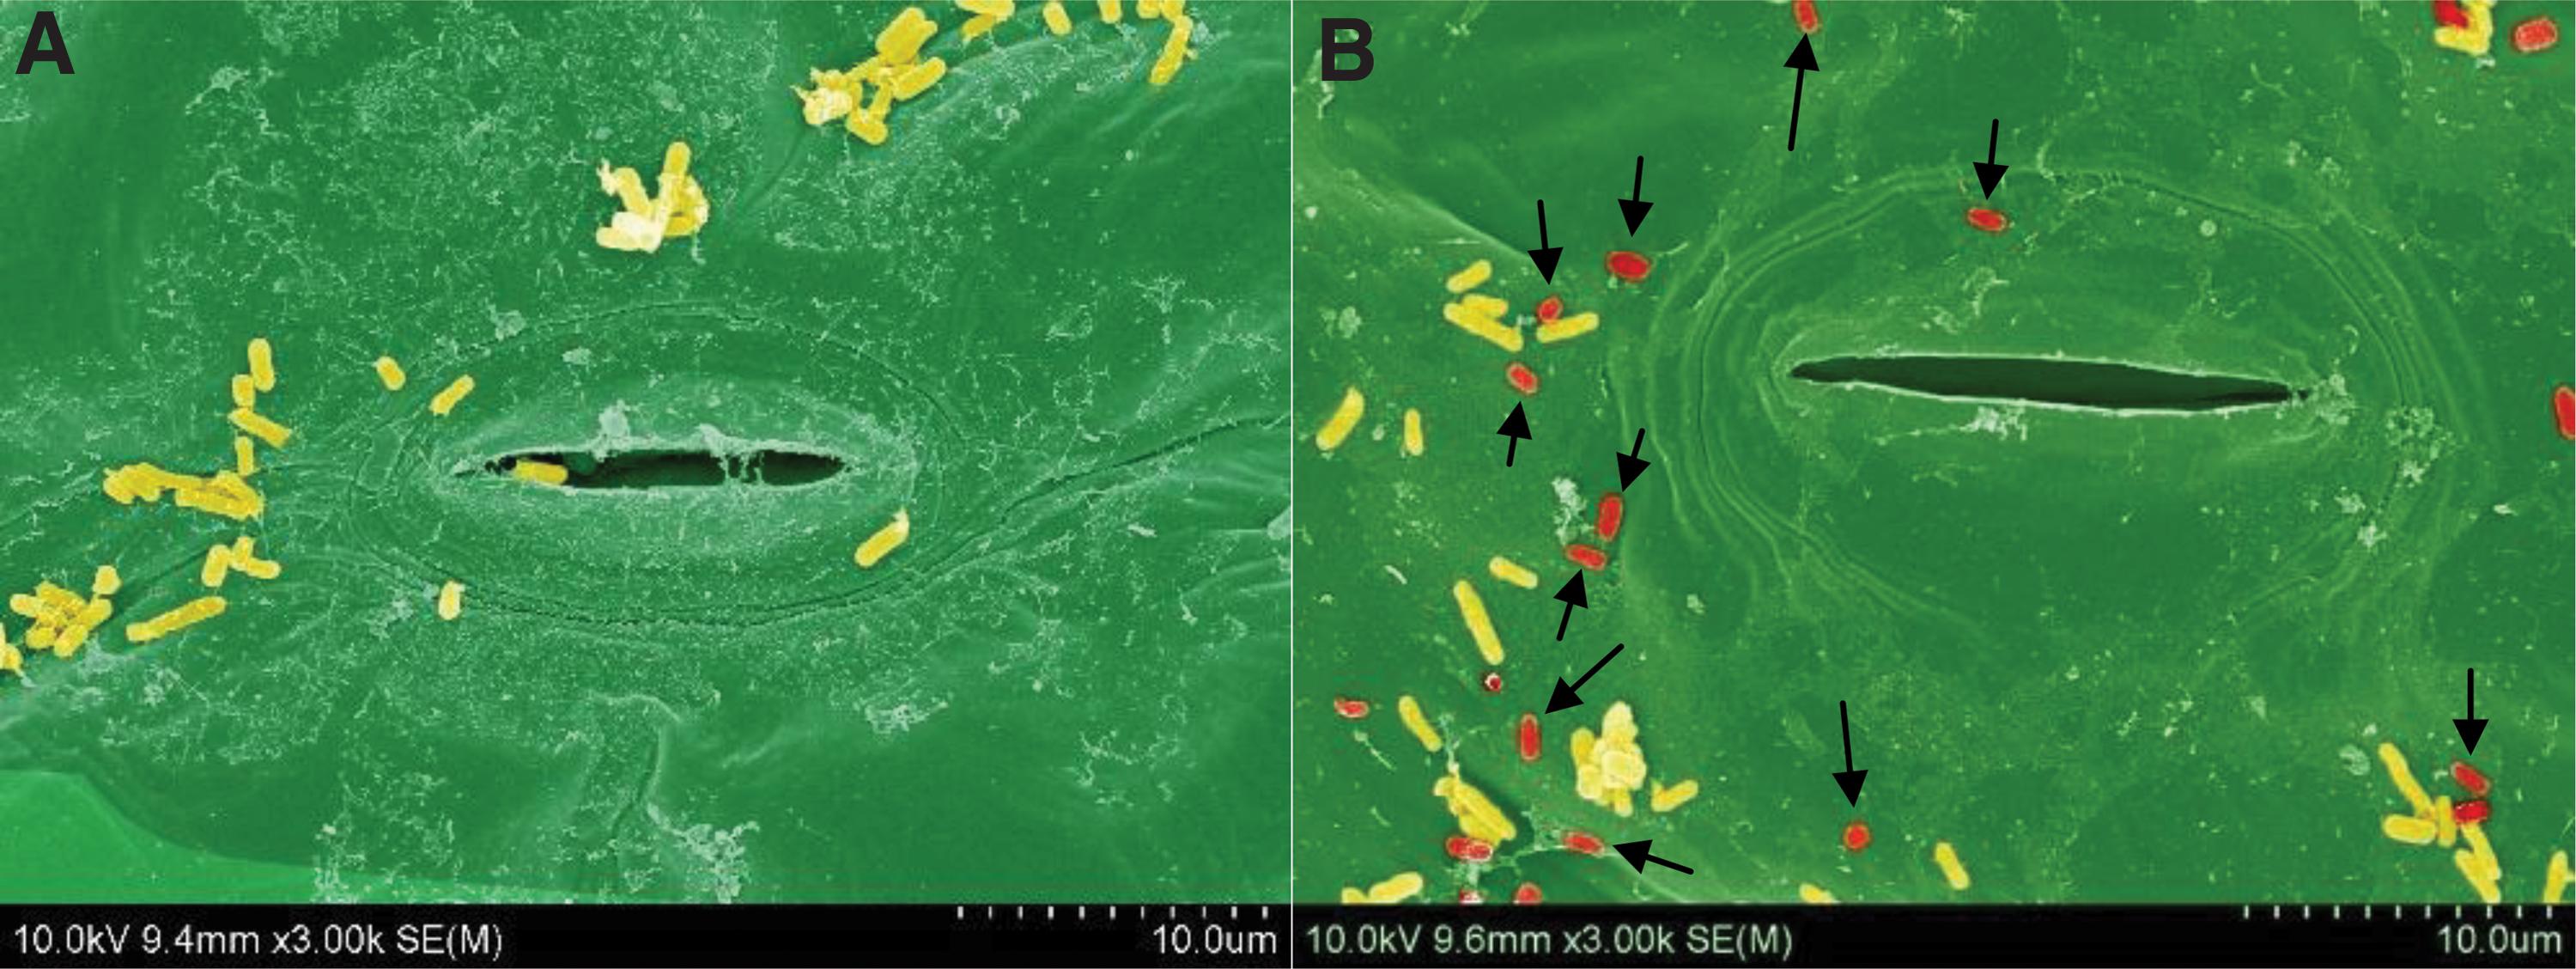
SEM images of Shiga toxin
Conclusions
STEC cells in the LTS, compared with STAT, have a higher chlorine tolerance as planktonic cells and as attached cells depending on prior cell contact time on lettuce. In addition, a higher percentage of LTS cells, compared with STAT cells, survive in a noninjured state after chlorine (40 ppm) treatment of lettuce.
Footnotes
Acknowledgments
The authors express their appreciation to personnel in the Roy J. Carver High Resolution Microscopy Facility at Iowa State University for technical assistance with scanning electron microscopy imaging. The authors thank Dr. Stephen Knabel, Pennsylvania State University, for critical review of the manuscript.
Disclosure Statement
No competing financial interests exist.
Funding Information
This work was supported by the Iowa Agriculture and Home Economics Experiment Station, Project number IOW04202, sponsored by the Hatch Act and State of Iowa funds.