
Abstract
Multilocus variable number tandem repeat analysis (MLVA) is a molecular subtyping technique that remains useful for those without the resources to access whole genome sequencing for the tracking and tracing of bacterial contaminants. Unlike techniques such as multilocus sequence typing (MLST) and pulsed-field gel electrophoresis, MLVA did not emerge as a standardized subtyping method for Listeria monocytogenes, and as a result, there is no reference database of virulent or food-associated MLVA subtypes as there is for MLST-based clonal complexes (CCs). Having previously shown the close congruence of a 5-loci MLVA scheme with MLST, a predictive model was created using the XGBoost machine learning (ML) technique, which enabled the prediction of CCs from MLVA patterns with ∼85% (±4%) accuracy. As well as validating the model on existing data, a straightforward update protocol was simulated for if and when previously unseen subtypes might arise. This article illustrates how ML techniques can be applied with elementary coding skills to add value to previous-generation molecular subtyping data in-built food processing environments.
Introduction
Listeria monocytogenes is a bacterium ubiquitous in the environment, and, through the contamination of food products, it can cause serious infection in susceptible humans, posing a significant challenge for food businesses producing refrigerated ready-to-eat (RTE) foods (Carpentier and Cerf, 2011; Koopmans et al., 2023). Foods most often associated with infection include cold cuts of meat, pre-prepared cooked and chilled meals, soft cheeses, pâtés, and smoked fish (HPSC, 2019). Listeria monocytogenes can survive and grow in refrigerated conditions, and if it enters the food processing environment, it may persist if not controlled through sanitation measures. It can enter facilities through contaminated ingredients, equipment, or personnel and then has the potential to cross-contaminate RTE foods as they are processed, which can contribute to foodborne illness. It is therefore essential that food businesses have effective control measures to minimize the opportunity of contamination through good manufacturing practices, effective hygiene measures, environmental monitoring, and fast and effective corrective action protocols if the presence of the bacterium is detected (Ferreira et al., 2014; Malley et al., 2015).
Molecular subtyping can assist with tracking and tracing contamination, as well as distinguishing transient contaminants from persistent subtypes that may survive in a processing plant in an environmental niche (Carpentier and Cerf, 2011; Malley et al., 2015). Multilocus variable number tandem repeat analysis (MLVA) is a reliable and relatively simple method for subtyping pathogens (Andrews et al., 2023; Martin et al., 2018) but was not standardized for L. monocytogenes and does not readily give any indication of the potential virulence or degree of environmental adaptation of a subtyped isolate. In contrast, multilocus sequence typing (MLST) groups isolates into clearly delineated clonal complexes (CCs), which through epidemiological evidence have been shown to display different virulence phenotypes in human disease, and this knowledge can provide powerful information for risk assessments (FAO/WHO, 2022; Maury et al., 2019). MLVA exploits the length differences of polymorphic variable number tandem repeat regions (VNTR) in genomes. Schemes for L. monocytogenes have been shown to give highly consistent results to MLST (Andrews et al., 2023; Chenal-Francisque et al., 2013; Martin et al., 2018), providing the potential to predict the CC from MLVA patterns.
Machine learning (ML), a field concerned with how computer systems can automatically improve through experience, is increasingly being used to gain insights and make predictions from large datasets to aid decision making (Jordan and Mitchell, 2015). ML-based methods can be used to build predictive models following a supervised learning approach, training a model to predict the label (y) of an object in response to the input of its features (x). One ML approach to modeling is through decision trees, where models can be incrementally improved by adding alternative trees in an iterative process as learning progresses. This method, known as gradient boosting, works on the principle that combining many “weak” classifiers can produce a powerful “committee” (Friedman et al., 2000). XGBoost is a popular gradient boosting package (Chen and Guestrin, 2016), which in recent years has found successful application in medical, veterinary, and microbiological genomic investigations (Behravan et al., 2018; Li et al., 2018; Nguyen et al., 2019).
The objectives of this investigation were (1) to build and test a predictive model of CCs and thus establish the virulence potential of L. monocytogenes isolates from MLVA patterns, (2) to build the model using ML techniques assuming elementary coding skills, and (3) to explore a practical approach of continuously refreshing the model by simulating an update procedure as new MLVA patterns emerge.
Materials and Methods
Bacterial isolates, MLVA subtyping, and in silico MLST (via whole genome sequencing)
A collection of 100 L. monocytogenes originally cultured from routine environmental monitoring programs in three food processing facilities over a 4-year period was initially available for the modeling. These isolates were subtyped using a 5-loci MLVA scheme and in silico MLST via whole genome sequencing (WGS) in previous investigations (Andrews et al., 2023; Hurley et al., 2019).
To validate the performance of the model and to simulate routine model updates when new MLVA patterns were identified, an additional collection of 213 additional isolates became available through a separate investigation. These isolates were cultured from food processing environments, and MLVA and WGS were performed on them using the aforementioned methods (unpublished data).
XGBoost implemented in Python 3
The ML package XGBoost was selected as a freely available tool, which has been successfully applied to other biological problems (Bandoy and Weimer, 2020; Behravan et al., 2018; Nguyen et al., 2019). The XGBoost Python Package (https://github.com/dmlc/xgboost) was installed on a stand-alone PC using Python 3 (version 3.8.2), allowing the manipulation of data arrays with NumPy (version 1.16.5) into the necessary formats for modeling, the execution of the XGBoost algorithms, the monitoring of the training and test procedures, and to access characteristics of the trained models. The data were prepared in Microsoft Excel (version 2005).
Modeling procedure
The initial dataset of 100 samples was split 70/30 into a training set to develop the predictive model and a test set to monitor and validate model performance (Kotsiantis, 2007). To simplify Python coding, the data were split manually. Multiple instances of any given CC followed the 70/30 split as far as possible (Supplementary Table S1), and CCs with only two instances were split 50/50. Singletons were placed in the training set.
In a typical “big data” project, there could be thousands or millions of predictors (p) for a relatively small number of samples (n), and a common pitfall in this scenario is the creation of a predictive model that overfits the training data but performs poorly on separate validation datasets (Anonymous, 2019; Teschendorff, 2019). In this example, where there are five features and 100 samples, n exceeded p by a solid margin (i.e., n ≥ 5p) (Johnstone and Titterington, 2009), avoiding the problem of making meaningful models from high-dimensional data.
The Python commands for the modeling are included in the Supplementary Material (see Supplementary Data S1). The prediction of the CC from an MLVA pattern is a “multiclass classification” problem, where the label can fit one of three or more discrete classes. Key parameters to optimize the training step are the learning rate, which helps to minimize overfitting by slowing down the adaptation of the model to the training data at each step; the maximum number of levels in each tree, where a high number will encourage complexity and the greater chance of overfitting; and the number of rounds of boosting, where more rounds can again lead to overfitting. These parameters were varied to understand the effects on model accuracy and to refine optimum values for the learning problem at hand. A parallel model was generated using the “multiclass probability” objective to return the probability of a label classification rather than a categorical label.
The “relative importance” of the features in the predictive model (in this case the 5 VNTR loci) was accessed using the “get_score” function (see https://xgboost.readthedocs.io/en/latest/python/python_api.html). Confidence intervals (CIs) on model accuracy were calculated using the formula for a single proportion using the normal distribution at the 95% level: CI = 1.96 × √ [{p × (1 −p)}/n], where p is the proportion (model accuracy), and n is the number of samples (Kirkwood and Jonathan, 2003).
Validation and remodeling procedure
The additional 213 samples that became available were used as a separate validation set to confirm the performance of the predictive model on previously unseen data (see Supplementary Table S3). Very low CC prediction probabilities were noted for several new MLVA allele patterns in these additional data, and a procedure was developed to simulate occasional remodeling with the addition of incremental train and test data. It is not straightforward in XGBoost to incrementally learn through new data, so to circumvent this limitation, a new model was generated each time any train and test data were added.
Results
Initial modeling on 100 samples
The modeling procedure using gradient tree boosting is illustrated in Figure 1. An initial model (Model 1) was generated using a training set of 70 samples and a test set of 30 samples to help select the optimum training parameter values, using the XGBoost tutorials as a guide. The effect of varying these parameters on the model’s error rates as training progressed is illustrated in Figure 2, showing how a learning rate of 0.3 gave lower error rates than 0.1 at all boosting rounds. Although the training error steadily reduced as boosting progressed, the test error fell to a low value and then rose again. This illustrates the model overfitting the training data, getting better at predicting the correct classes in the training data as model complexity increases but performing less well on new data. Lower learning rates of 0.01 and 0.001 with more boosting rounds were experimented with but without lower test errors being achieved.

A schematic of the gradient tree boosting procedure.
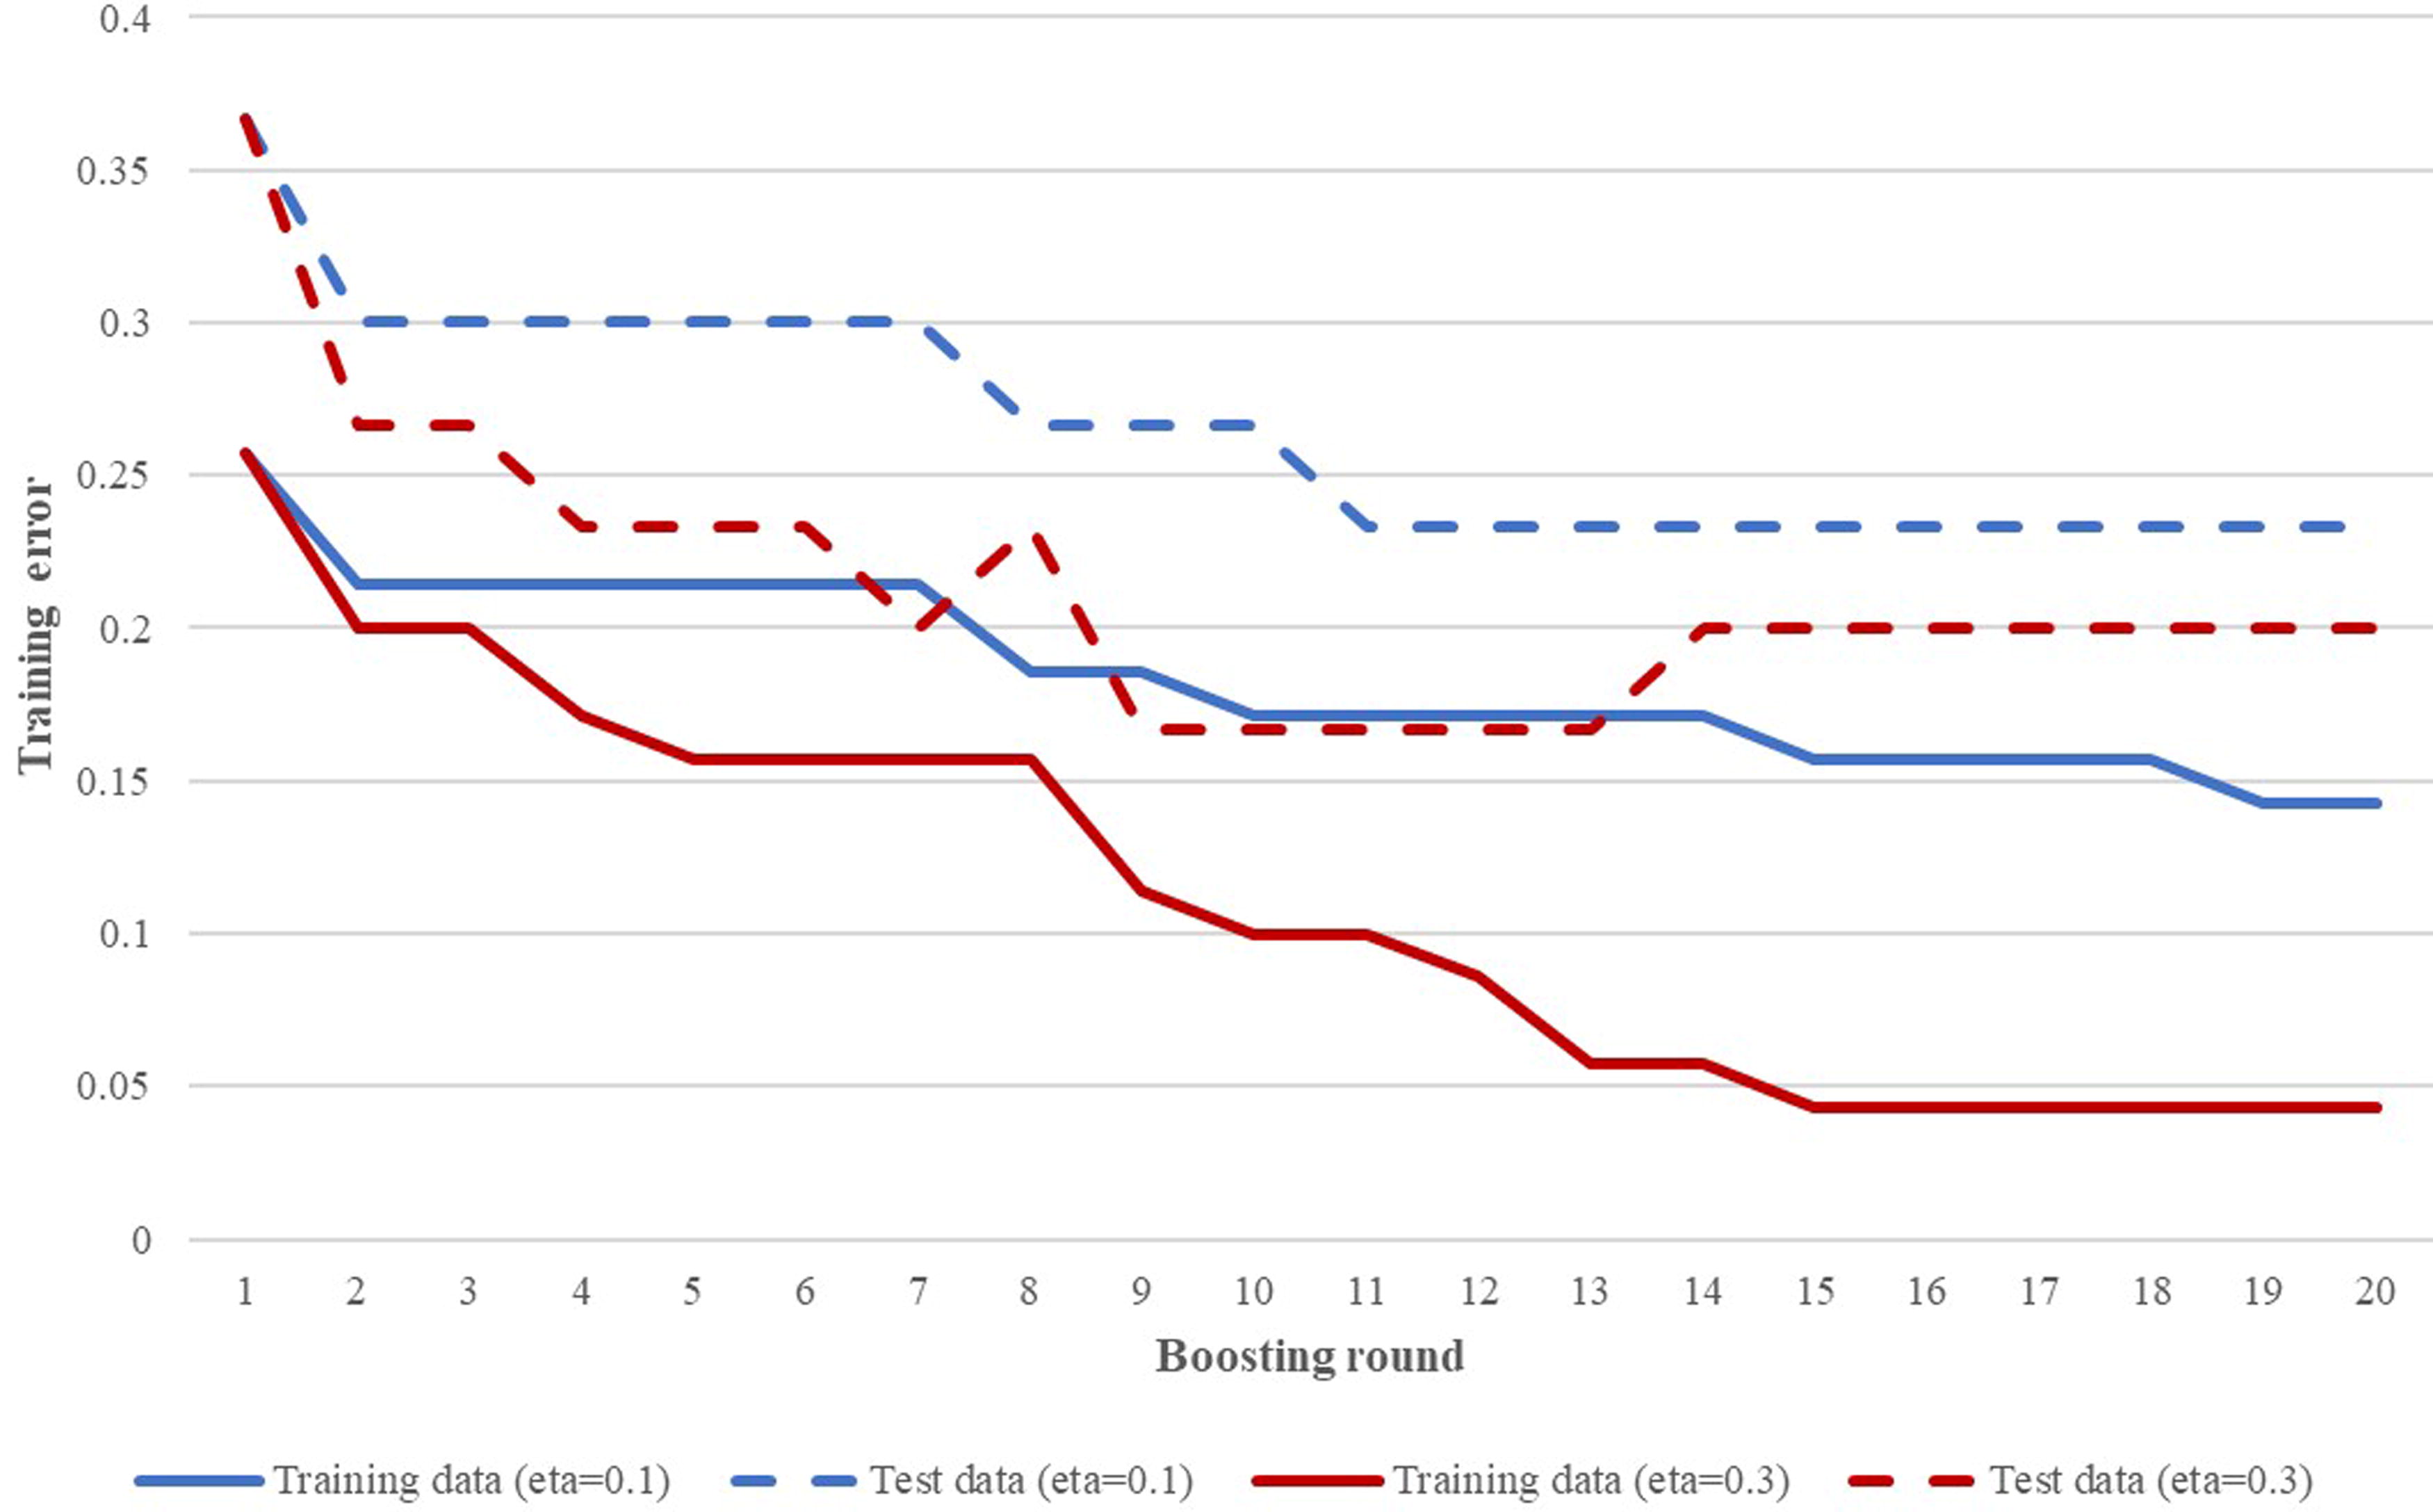
Model 1 prediction errors (the proportion of incorrectly classified CCs) using different training parameters. The effect of varying the learning rate (η) is illustrated. As training progressed with each boosting round, the error rates reduced on both the training and the test datasets, with a limit reached for the test data at 14 rounds because of the overfitting of the model to the training data. There was no change in error rates when the value of maximum depth was varied (not shown). CC, clonal complex.
On the basis that the “simplest model is best” to prevent overfitting (Teschendorff, 2019), a learning rate of 0.3, maximum depth of 3, and 12 boosting rounds were selected. This gave a model with an error rate in predicting the correct CC from the training data of 8.6% and the test data of 16.7%, a combined train/test error of 11.0%. When applied to the validation dataset, the prediction error was higher at 20.7% (see Table 1).
Accuracy of Predictions from Successive Models
The table displays overall prediction accuracy of each model on the train/test and validation datasets (with confidence intervals [CI])) and by clonal complex (CC; across all datasets). The prediction accuracy of Model 4 for the CCs with at least 15 samples was >80%.
CC1, CC2, CC4, and CC6 are “hypervirulent clones,” more prevalent in human cases than in foods.
CC9 and CC121 are “hypovirulent clones,” more prevalent in foods.
No examples of these clonal complexes were present in the training set.
Improving the model with incremental data
A model generated with the probability objective outputs a matrix of CC probabilities rather than categorical predictions. In Model 1, it was observed that all correct CC predictions on the 100 train and test samples were predicted at a probability of 50% or higher. For those samples with a CC called on a probability between 25% and 50%, six predicted CCs were correct and six were incorrect. For those called on a probability below 25%, seven predictions were correct and five incorrect (data not shown; for examples of prediction probabilities, see Supplementary Table S2).
Following this observation, the predictions from the validation data were examined in the time order in which samples had been subtyped. A working procedure for remodeling (see Fig. 1) was proposed as follows: A categorical CC prediction with a probability of 50% or greater was considered of high confidence for the sample in question. Any prediction with a probability of <50% was classed as low confidence but would be accepted as the best available if the MLVA allele pattern was similar to samples already in the training data. However, if a pair of additional samples with very similar MLVA patterns (i.e., within ±1 repeats at each allele) had the CC predicted with a probability <50%, and this pattern was different from any existing in the training data, remodeling would be performed, with one sample added to the training set and one to the test set. The CCs of only these two additional samples would be available for remodeling and monitoring, that is, in a nonsimulated situation, additional subtyping would be required for only two samples.
Prediction accuracy as remodeling progressed is summarized in Table 1. Overall accuracy on the train/test data and validation data improved with each remodeling step, with a pair of samples added each time to successively create Model 2, Model 3, and finally Model 4. All training parameters were held constant for the remodeling steps except for Model 3, where it was noted that with just two additional boosting rounds (14 total), the errors on both the train and test data fell further. On the validation data, the final Model 4 had a prediction error of 15.9%, improved from 20.7% for Model 1. On all data, Model 4 had a predictive accuracy of >80% for the most frequent CCs identified, which together comprised 85% of all samples.
Although an XGBoost model can be exported to a text file, it is difficult to intuitively grasp the model structure and identify which features are most informative in making predictions. Instead, these can be identified using the “feature importance” function to view “information gain” (Kotsiantis, 2007), a measure of how informative a feature is through its appearance across all decision trees. To illustrate this function, gain values by feature for Models 1 and 4 are shown in Figure 3. These were of the same order of magnitude for all features, each adding a similar value in deriving predictions. Their order of significance was modified through the remodeling exercise: in Model 1, VNTR11 was the most influential locus in the predictive model, whereas in Model 4, VNTR5 had become the most influential. VNTR4 was the least influential feature.
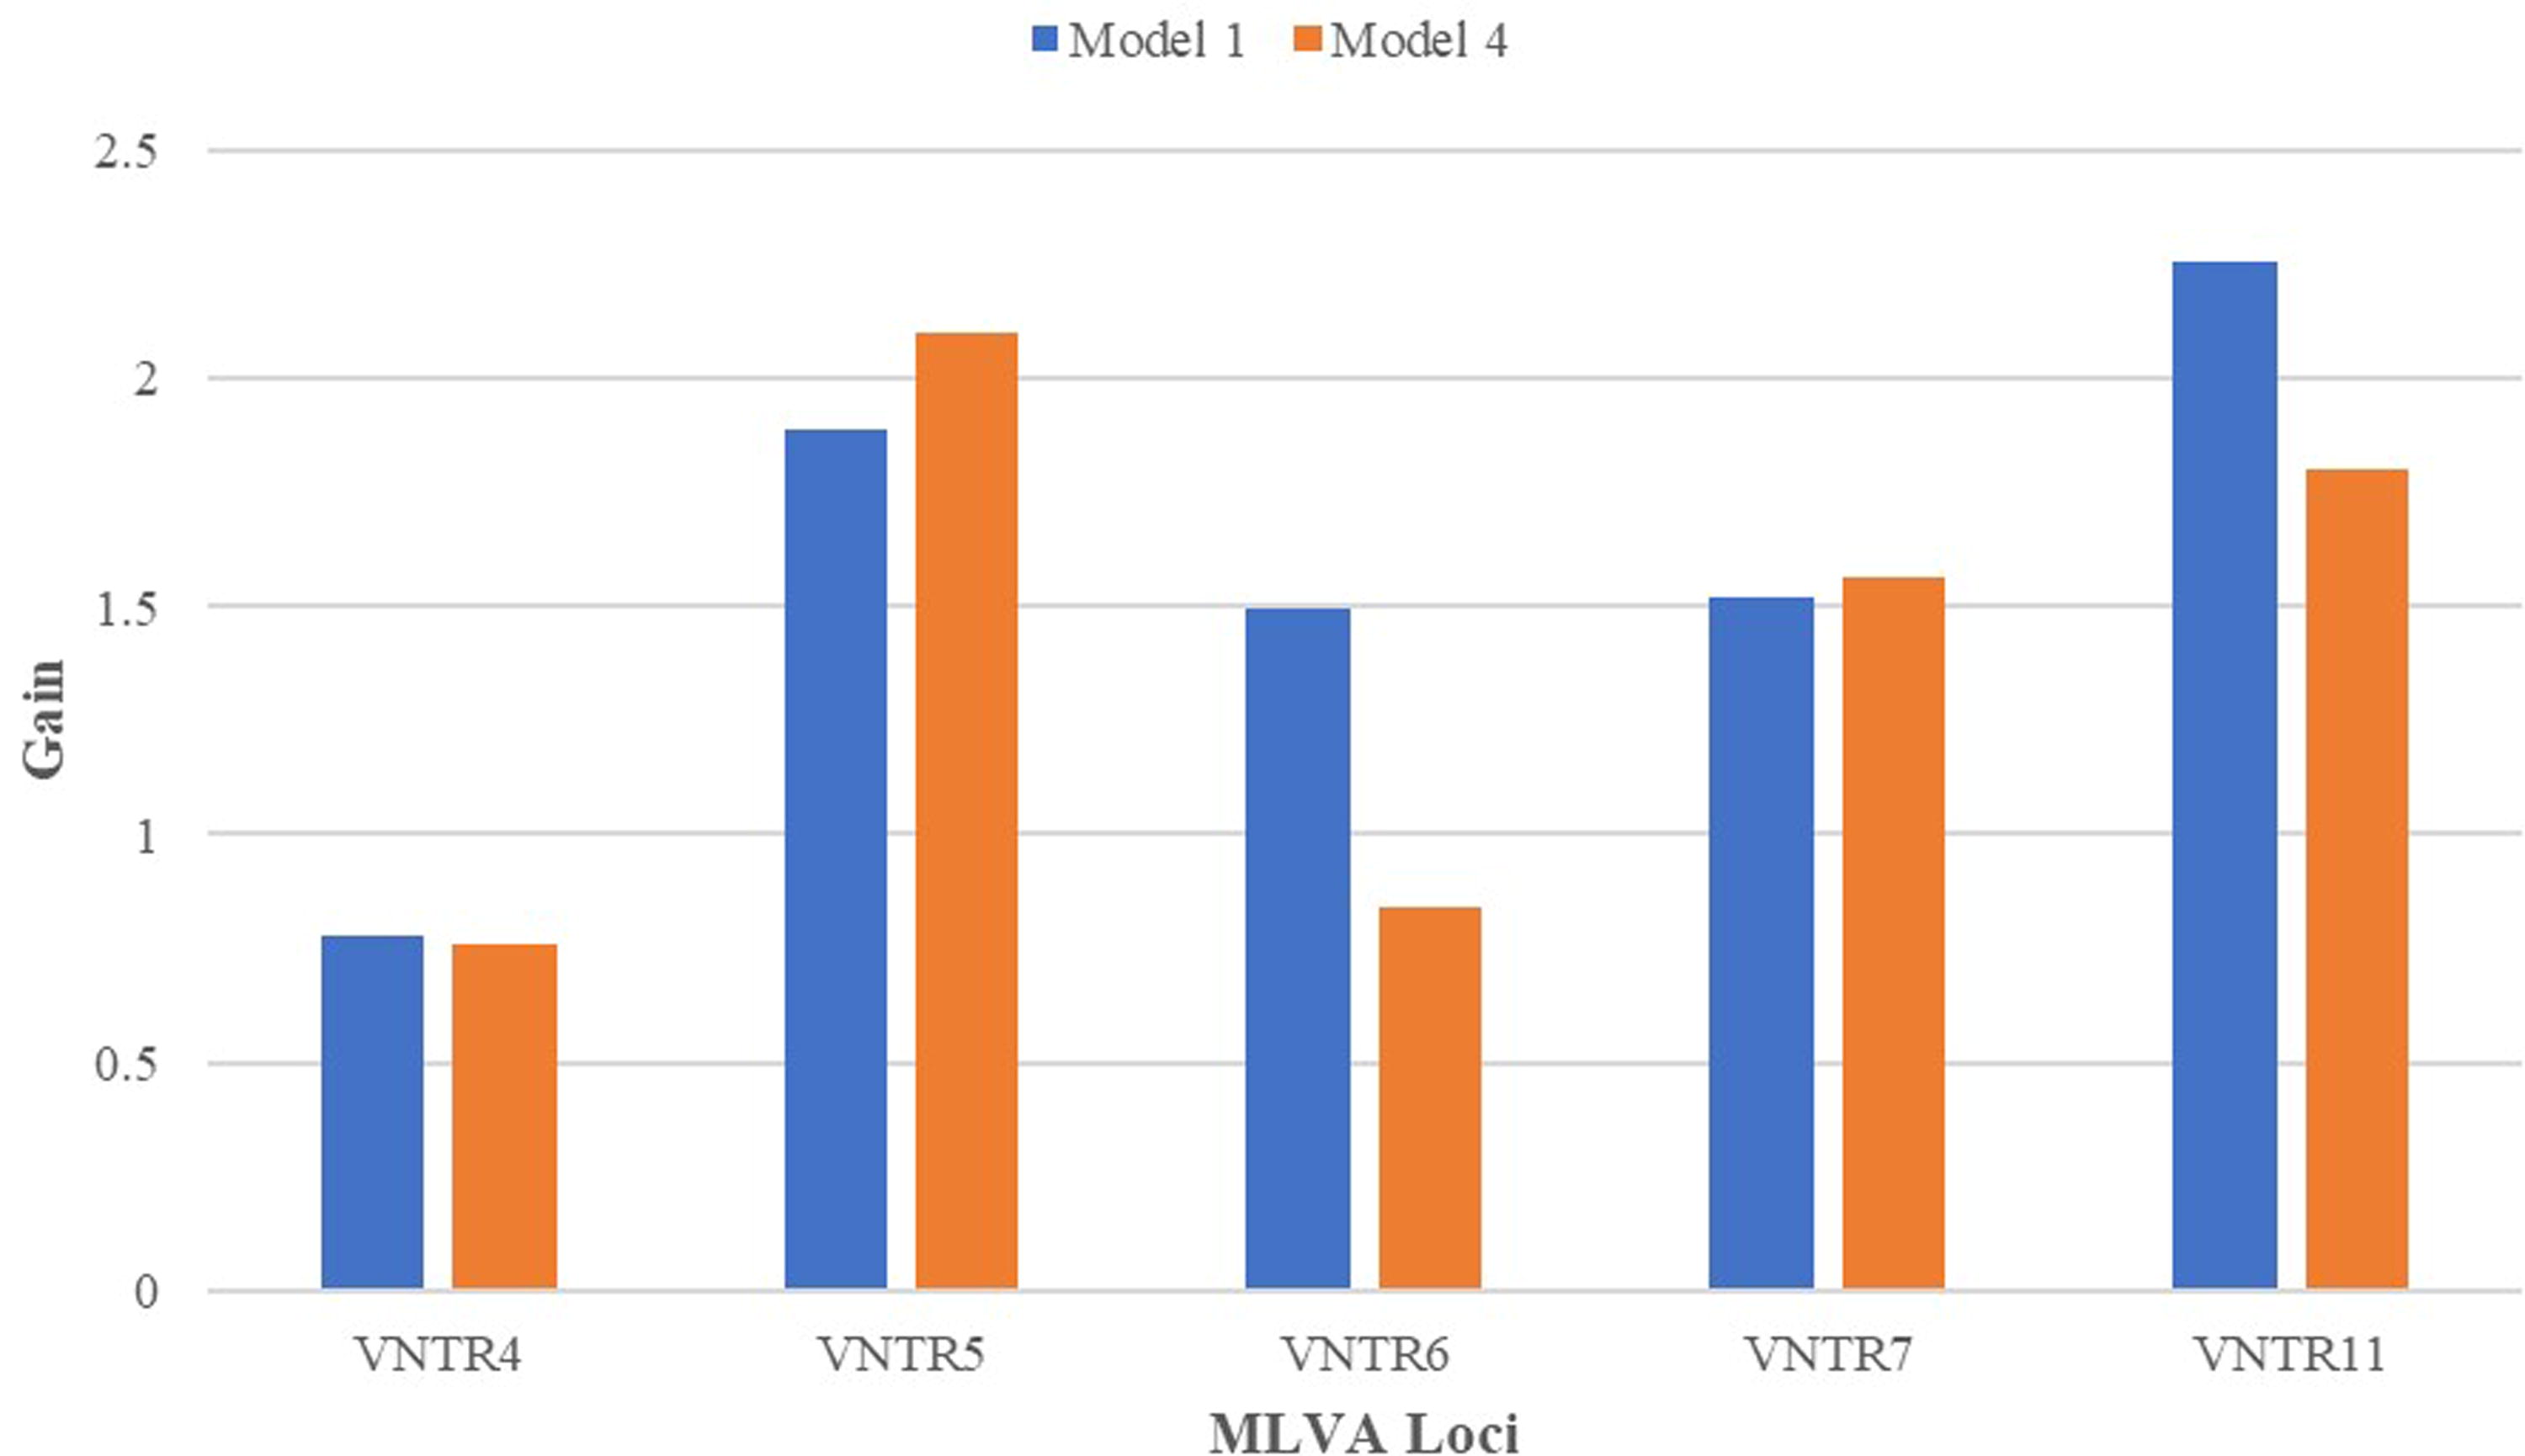
Feature importance values. The value of “average information gain” is illustrated for each feature (the MLVA loci) for two of the models. This represents the importance of a feature in deriving a prediction through all the combined decision trees, with importance in this example being of similar orders of magnitude. MLVA, multilocus variable number tandem repeat analysis.
Discussion and Conclusions
Although MLVA is a discriminatory, cost-effective, and repeatable molecular subtyping method capable of discriminating between all major clones of L. monocytogenes, heretofore it has not been adopted as a standardized method for subtyping this bacterium. Without standardized subtype classifications that allow comparison between results from different laboratories and investigations, the method can give little insight into the commonality of a subtype across different source categories (e.g., from human, food, and environmental sources) or into its potential virulence (from epidemiological data). The ability to predict the CC and thus the likelihood of having recovered an infection-associated clone or a less virulent food-associated clone (Maury et al., 2016) is valuable information for risk assessment. However, it is important to include the caveat that while different clones have been shown to have different virulence potentials, all have the ability to cause disease, and regulatory authorities at present consider all L. monocytogenes to be equally pathogenic (Hurley et al., 2019).
The initial model developed in this investigation (Model 1) had a CC prediction accuracy of 82.4% (78.2–86.6%) for all isolates, and this improved to 86.3% (82.5–90.1%) in Model 4 through a simulated remodeling procedure. This simulation was realistic and practical, following a stepwise protocol to recognize previously unseen MLVA patterns with low-probability CC predictions, and in a real-world situation would have required additional MLST subtyping effort on just 6 isolates out of 213. The trend of improvement in model accuracy both in terms of overall prediction accuracy and individual CC prediction showed that remodeling did not lead to the phenomenon of “catastrophic forgetting,” an issue associated with lifelong learning in computational models when new information interferes with previously learned knowledge (Parisi et al., 2019). In this context, the remodeling steps were few, added only incrementally to the training dataset. Training was performed afresh each time, which helps to avoid catastrophic forgetting but may be inefficient in a big data situation.
In a previous investigation into the accuracy and value of MLVA subtyping to track L. monocytogenes in food processing environments, the 5-loci MLVA scheme used was found to be highly congruent with MLST with an adjusted Wallace coefficient (congruence [Carrico et al., 2006]) of 0.939 (i.e., 94%). This was consistent with the predictive accuracy of 89% of Model 1 on the same initial dataset. For the most numerous CCs included, 101, 9, 121, 5, and 8, the predictive accuracy was high at 80% or higher (Table 1).
A broad set of 18 CCs were represented in the training data, obtained from routine environmental monitoring in food processing facilities. These included representatives from L. monocytogenes lineages I and II and serogroups IIa, IIb, IIc, IVb, and IVb-v1 (Hurley et al., 2019). The clones CC121, CC9, CC8, and CC5, all frequently isolated from foods in Europe (Maury et al., 2019; Painset et al., 2019), were well represented. CC121 and CC9 are the two “hypovirulent” clones, most frequently detected in foods. In contrast, the “hypervirulent” clones CC1, CC2, CC4, and CC6 commonly identified in clinical cases were relatively poorly represented. To be more representative of these virulent subtypes, which would be valuable for risk assessment purposes, a small number of samples of reference strains could be subtyped and included in a further remodeling exercise.
Care was taken during the modeling steps to avoid “data leakage,” which is a common pitfall in the application of ML techniques (Kapoor and Narayanan, 2022). Data leakage is the inclusion of technically unknowable data or inferences that allow the model in progress to “see the future.” Typical examples are (1) a lack of complete, consistently separated training and test datasets; (2) using features in the model that are a proxy for the outcome variable; and (3) validating a model using test data from one population and assuming this performance will translate to a different population (as there may be different variables and structural dependencies in the population of focus).
In this investigation, care was taken to maintain consistent train and test data splits, no preprocessing steps were required to impute missing data points, all data came from a consistent population, and remodeling was performed using only information that would have been available at the particular point in time of sampling. Although the validation dataset was used to assess the overall accuracy of the models for the purpose of this article, it was not used in the generation of the models.
The analysis of big data is undergoing a revolution, and the use of ML methods to help solve complex bioinformatics problems is rapidly growing (Teschendorff, 2019). Results for the search term “machine learning” in PubMed show an exponential increase in papers since the early 2000s. However, the use of ML methods to predict a standardized molecular subtype from previous-generation microbial molecular typing data, as in this case, appears to be novel.
This investigation demonstrates the successful application of the XGBoost ML method to reliably predict an attribute that has real risk assessment value to a food business. The application to the prediction of subtyping classes is a novel, if relatively simple, exercise, which provides a useful tool to any users of MLVA methods, predicting the likely CC and thus the potential virulence of any subtyped isolates. The predictive accuracy was consistent with the previously determined congruence between the two subtyping methods. The ML method, including the protocol to remodel with newly emerging MLVA patterns, is simple to apply and maintain for a user familiar with proprietary and research-based bioinformatics and statistical packages and with elementary coding skills.
Footnotes
Authors’ Contributions
N.A.: Conceptualization, methodology, investigation, formal analysis, methodology, visualization, and writing—original draft. N.U.: Investigation and writing—reviewing and editing. P.W.: Conceptualization and writing—reviewing and editing. J.F.B.: Conceptualization and writing—reviewing and editing. S.F.: Conceptualization, supervision, funding acquisition, and writing—reviewing and editing.
Disclosure Statement
No competing interests exist.
Funding Information
This work received no funding from any agency.
Supplementary Material
Supplementary Data S1
Supplementary Table S1
Supplementary Table S2
Supplementary Table S3
References
Supplementary Material
Please find the following supplemental material available below.
For Open Access articles published under a Creative Commons License, all supplemental material carries the same license as the article it is associated with.
For non-Open Access articles published, all supplemental material carries a non-exclusive license, and permission requests for re-use of supplemental material or any part of supplemental material shall be sent directly to the copyright owner as specified in the copyright notice associated with the article.