




Abstract
Background: Detoxifying glutathione S-transferase (GST) gene polymorphisms show variation in different ethnic populations. GST detoxifies and metabolizes carcinogens, including oxygen free radicals. GST polymorphisms have been associated with susceptibility to different diseases. In the current study, allelic polymorphisms of GSTM1 and GSTT1 were analyzed in three ethnic groups of North East (NE) India where a high prevalence of various cancers and other diseases such as hypertension, tuberculosis, and asthma have been reported. Methods: We compared the prevalence of GSTT1 and GSTM1 deletion genotypes, which were determined by multiplex polymerase chain reaction, in 422 voluntary, healthy NE Indians with those of other populations. The data was statistically analyzed. Results: The GSTT1-null genotype was found in 51%, 34.3%, and 15.7% of individuals (from Mizoram, Sikkim, and Assam regions of NE India, respectively), whereas the GSTM1-null genotype was found in 46.9%, 46%, and 35% of individuals from the same areas. Conclusions: The NE Indians differ from the rest of the Indian population with reference to genotypic distribution of GST polymorphisms but the frequency was found to be similar to that which has been reported from China. This may explain the hypothesis of the common ancestral origin of both the NE Indians and the Chinese and a higher frequency of cancers such as gastric, esophageal, and oral cancers, which has been reported from these regions. This study establishes baseline frequency data for GST polymorphisms for future case control studies on the role these polymorphisms play with regard to diseases. The results presented here provide the first report on GST polymorphisms in the NE Indian population.
Introduction
T
Most chemical carcinogens require metabolic detoxification by phase II enzymes. Effects of exposure to these carcinogens are determined by the quantitative absorption, distribution, metabolism, and excretion of the toxic chemicals depending on the presence, efficiency, and concentration of phase I and II detoxifying enzymes, which are ultimately decided by the genetic constitution of the concerned person. Among the phase II enzymes, the glutathione S-transferase (GST) enzymes play an important role in the metabolism of environmental carcinogens (Torresan et al., 2008). GST catalyzes the binding of a large variety of electrophiles to the sulfydryl group of glutathione, thereby yielding less harmful and more water-soluble molecules, which can be excreted via bile or urine. Since the most reactive, ultimate carcinogenic forms of chemicals are generally electrophiles, GST assumes considerable importance as a mechanism for detoxification of a variety of potential carcinogenic compounds such as hydrocarbon diol-epoxides, steroids, genotoxic lipoperoxidation products, and polycyclic aromatic hydrocarbons (Tsuchida and Sato, 1992; Hayes and Pulford, 1995; Gaspar et al., 2004).
The GSTs are known to be polymorphic, with different frequencies of polymorphism in individuals of different ethnicity (Saravana Devi et al., 2008). The allelic polymorphism of GSTM1 and GSTT1 are characterized by the deletion of a part of the gene. This results in variation or the absence of activity of the enzymes, thus leading to reduced or absence of detoxification of carcinogens in the body and thereby resulting in variation in the concentration of activated carcinogenic chemicals in a significant percentage of individuals (Strange and Fryer, 1999; Katoh et al., 2008). Other mechanisms like Transcriptional silencing by CpG island hypermethylation can also lead to the reduced expression of these genes (Mavis et al., 2009; Peng et al., 2009). High frequency of the GST null genotype has been reported in Chinese (64.4%) and Koreans (60.2%), whereas the lowest frequency has been reported in Mexican-Americans (9.7%) (Nelson et al., 1995). In addition, intraethnic differences in the frequencies of GSTM1 and GSTT1 deletion have also been observed. For example, in the Turkish population, the frequency of GSTM1 and GSTT1 was reported to range between 32.7% and 51.6% and between 17.3% and 22.4%, respectively (Ada et al., 2004; Yalin et al., 2007).
The frequencies of GST gene polymorphism in the NE population, where interindividual and interethnic differences are common, have not been reported so far. In the current study, samples from healthy volunteers belonging to three different geographical regions of NE India, that is, Mizoram, Sikkim, and Assam, were analyzed to understand the genetic distribution of GSTM1 and GSTT1 polymorphisms in the NE population. Comparisons have been made with other regions of India and the world.
Materials and Methods
Peripheral blood samples were obtained from 422 healthy individuals of NE India. All the individuals included in the study were residents of Guwahati (Assam), Aizawl (Mizoram), and Gangtok (Sikkim). The samples were collected between the years 2006 and 2008. Questionnaires containing information on age; gender; region of origin; occupation; type of tobacco habit, frequency, and duration of tobacco; betel quid; and alcohol consumption were recorded by interviewing all participating individuals. Institutional ethical clearance was obtained as per guidelines. An informed consent was signed and obtained from all the subjects.
Collection, transport, and processing of samples
Two to 3 mL of peripheral blood samples were collected in tubes containing ethylenediaminetetraacetic acid and stored at −20°C until processed. Genomic DNA was extracted and purified using proteinase K Phenol-Chloroform extraction procedure (Sambrook and Russell, 2001).
Genotyping of GSTM1 and GSTT1 genes
A multiplex polymerase chain reaction (PCR) method (Chen et al., 1996; Kelada et al., 2003) was used to detect the presence or absence of the GSTM1 and GSTT1 genes in the genomic DNA samples of the healthy individuals. Twenty-five microliter of PCR mixture was prepared by adding 2.5 μL of 10 × Taq buffer, 1 μL of MgCl2 (25 mM), 0.5 μL of dNTPmix (10 mM), and 0.5 μL of both forward and reverse primers (10 pM). The primers were synthesized from Microsynth (Lindau, Germany). The forward and reverse primer pairs were 5′-TTCCTTACTGGTCCTCACATCTC-3′ and 5′ TCACCGGATCATGGCCAGCA-3′ for GSTT1, 5′-GAACTCCCTGAAAAGCTAAAGC-3′ and 5′-GTTGGGCTCAAATATACGGTGG-3′ for GSTM1, and 5′ CAACTTCATCCACGTTCACC-3′ and 5′-GAAGAGCCAAGGACAGGTAC-3′ for β-globin gene, 50-100 ng of template DNA, and 1 unit of Taq Polymerase (Fermentas, Vilnius, Lithuania). β-globin gene was used as an internal control to check for failures of the PCR reaction. To test for contamination, negative controls (no template) were included in every PCR run. The amplified products were analyzed in 3% agarose gels containing ethidium bromide and run in 0.6 × tris-borate-ethylenediaminetetraacetic acid (TBE) buffer. The absence of a 459 bp band indicated GSTT1 null genotypes, and the absence of a 219 bp band indicated GSTM1 null genotypes (Fig. 1).
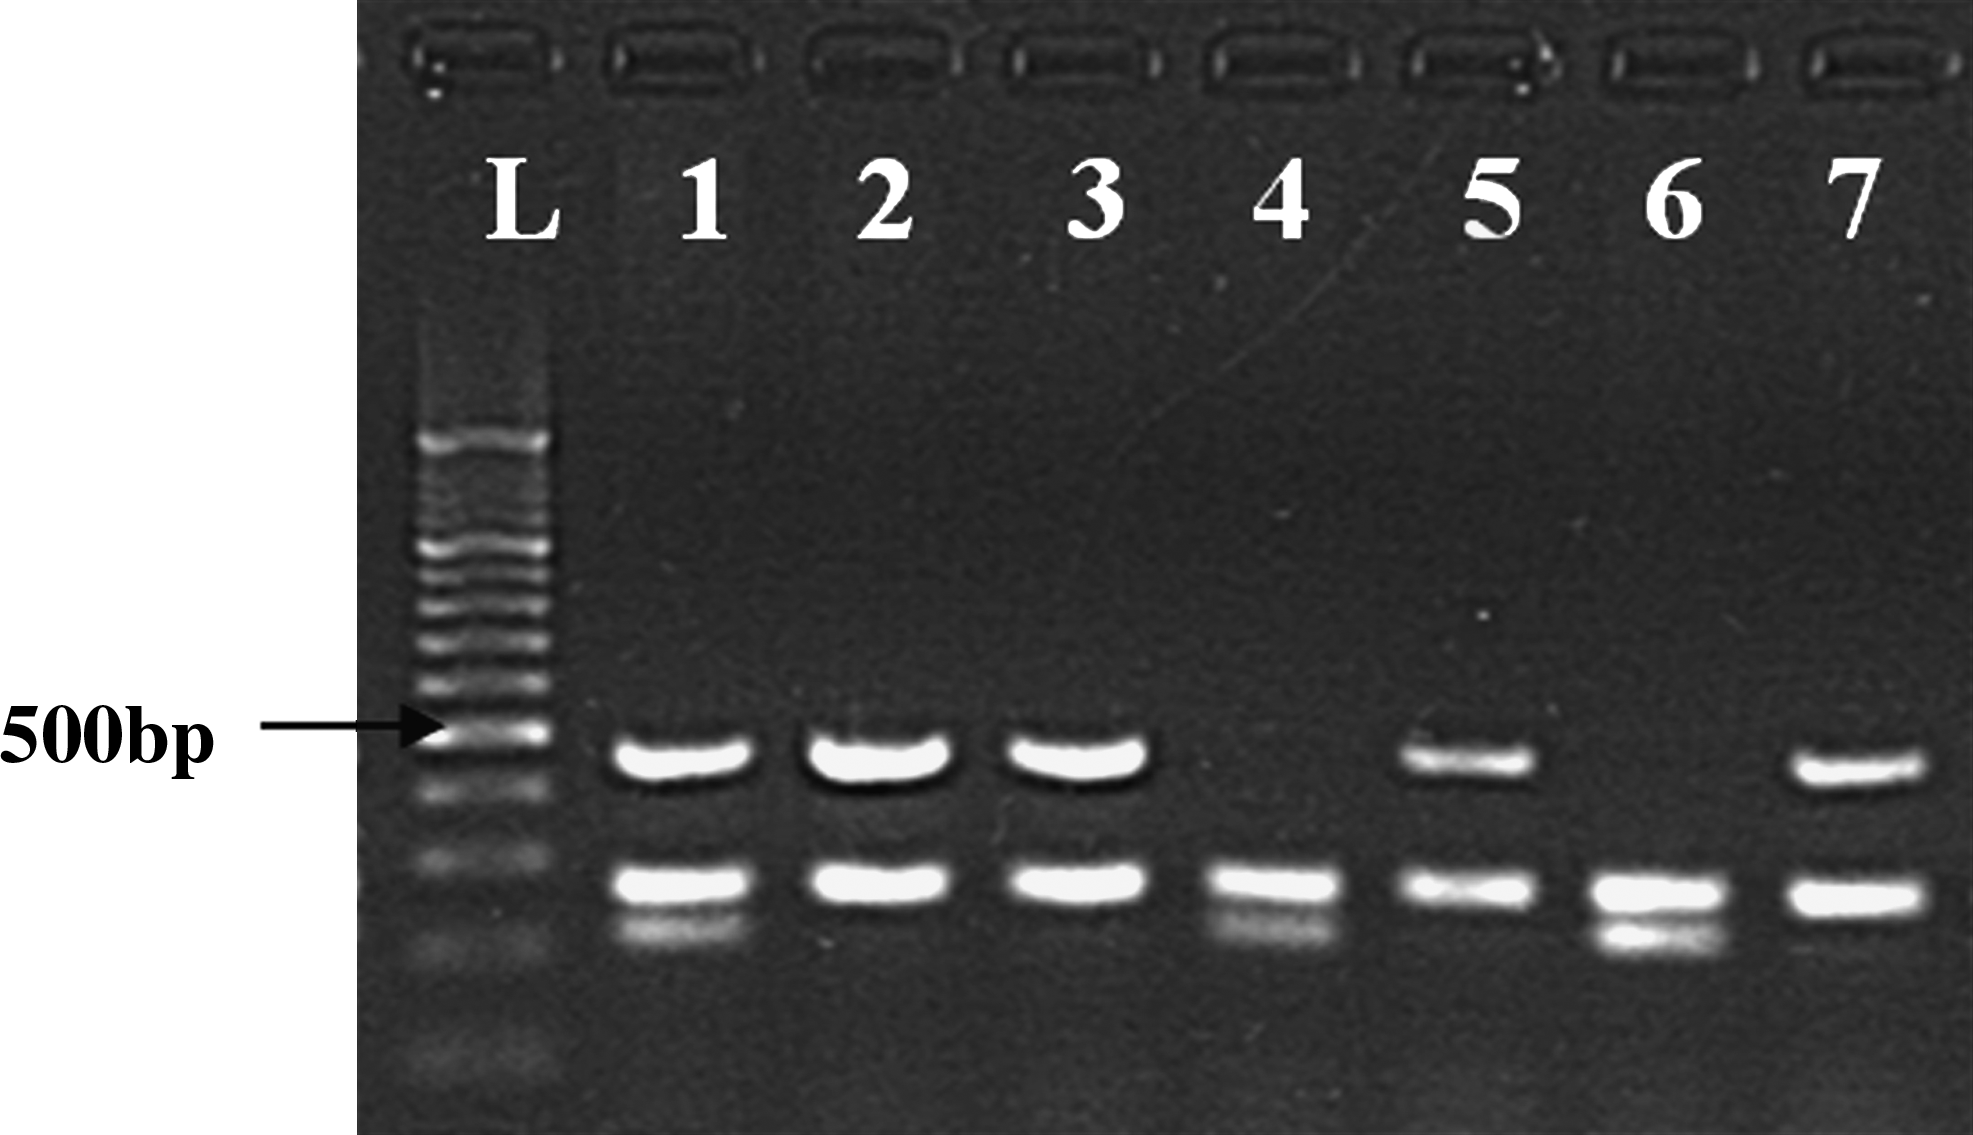
Detection of polymerase chain reaction amplification of GSTT1 (459 bp fragment), β-globin (268 bp fragment), and GSTM1 (219 bp fragment) genes. Representative image of ethidium bromide stained agarose gel: lane L (100 bp ladder); lane 1 (No null allele-GSTT1 and GSTM1 both present); lanes 2, 3, 5, 7 (GSTM1-null allele); lanes 4 and 6 (GSTT1-null allele).
Statistical analysis
Pearson χ2/Fisher's exact test statistics was applied to study the difference of the frequencies of GSTT1 and GSTM1 null genotypes among different populations, and a two-sided p ≤ 0.05 was considered statistically significant. The prevalence of GSTT1 and GSTM1 null genotypes was estimated along with their 95% confidence interval.
Results
Polymorphisms of GSTT1 and GSTM1 genes were analyzed in 422 individuals from NE India. Of these, 149 (56 males and 93 females) were from Mizoram, 102 (52 males and 50 females) were from Sikkim, and 171 (143 males and 28 females) were from Assam. The ethnicity of Mizoram population was homogenous whereas that of Sikkim and Assam was heterogeneous. The frequency of GST null genotype of the NE population was compared with the available reported data from the Central, Northern and Southern populations of India and other populations of the world, that is, Chinese, Arabian, American, Turkish, and Caucasian populations, to find out the influence of ethnicity on GSTM1 and GSTT1 polymorphisms.
GSTT1 genotype
The GSTT1 null frequency in the overall NE population was found to be 32.7%. The frequency of GSTT1 null genotype in Mizoram, Sikkim, and Assam populations was found to be 51%, 34.3%, and 15.7%, respectively (Table 1).
GSTT1 null polymorphism was significantly higher in Mizoram population as compared with Sikkim and Assam population (p < 0.05).
GSTT1 null polymorphism was significantly higher in Sikkim population as compared with Assam population (p < 0.05).
Combined GSTT1 and GSTM1 null polymorphism was significantly lower in Assam population as compared with Mizoram and Sikkim populations (p < 0.001).
CI, confidence interval.
The frequency of GSTT1 null genotype was compared with the data from the individual populations of NE India (Table 1). The frequency of GSTT1 null genotype in Mizoram population was found to be significantly higher when compared with that in Sikkim population (χ2 = 6.18, p = 0.0129). This difference was even more significant when compared with population in Assam (χ2 = 43.643, p < 0.0001). A statistically significant difference in the frequency of GSTT1 null genotype was also observed between populations of Sikkim and Assam (χ2 = 11.457, p = 0.0007).
A comparison of GSTT1 null polymorphism with other available reported data from Central, Northern, and Southern Indian populations showed a significantly higher frequency of GSTT1 null genotype in Mizoram population (51%) than in the North (19%, χ2 = 38.328, p < 0.0001) (Singh et al., 2008), South (16.8%, χ2 = 71.261, p < 0.0001) (Naveen et al., 2004), and Central Indians (12.4%, χ2 = 73.942, p < 0.0001) (Saravana Devi et al., 2008) (Table 2). Similarly, the frequency of GSTT1 null genotype in Sikkim population (34.3%) was found to be significantly higher than in the Northern (χ2 = 7.827, p = 0.0051) (Singh et al., 2008), Southern (χ2 = 15.374, p < 0.0001) (Naveen et al., 2004), and Central Indian (χ2 = 22.660, p < 0.0001) (Saravana Devi et al., 2008) populations. Unlike the frequency of GSTT1 null genotype in Mizoram and Sikkim, that in Assam was not significantly higher when compared with the frequencies in other parts of India. In addition, the overall NE population showed a significantly higher frequency of GSTT1 null genotype than the Northern (19%, χ2 = 11.889, p = 0.0006) (Singh et al., 2008), Southern (16.8%, χ2 = 31.267, p < 0.0001) (Naveen et al., 2004), and Central Indian populations (12.4%, χ2 = 36.459, p < 0.0001) (Saravana Devi et al., 2008). The frequency of GSTT1 null genotype of NE India was also compared with reported data from other populations, that is, Chinese, Arabian, American, Turkish, and Caucasian populations (Table 3). The GSTT1 null genotype did not show significant variation between NE Indian (32.7%) and Chinese populations (37.5%, χ2 = 0.552, p = 0.4573) (Bian et al., 2000), whereas significant variation was found when compared with other populations of the world, that is, Americans (16.7%, χ2 = 16.838, p < 0.0001) (Wideroff et al., 2007), Arabians (25%, χ2 = 6.457, p = 0.0111) (Siraj et al., 2008), Caucasians of America (18.1%, χ2 = 28.547, p < 0.0001) (Zhao et al., 2007), and Caucasians of Germany (18.5%, χ2 = 26.692, p < 0.0001) (Schneider et al., 2004). The frequency of the GSTT1 null genotype was lower in the Turkish population (22.4%, χ2 = 3.458, p = 0.0630) (Yalin et al., 2007) when compared with that in the NE population (32.7%).
GSTT1 null polymorphism was significantly higher in Mizoram, Sikkim, and NE populations as compared with North, South, and Central Indians (p < 0.05).
GSTM1 null polymorphism was significantly higher in Mizoram and Sikkim populations as compared with North and South Indians (p < 0.05).
GSTM1 null polymorphism was significantly higher in NE population as compared with North Indians (p < 0.05).
Combined GSTT1 and GSTM1 null polymorphism was significantly higher in NE Indians as compared with North and South Indians (p < 0.05).
NE, North East; NA, Not available.
GSTT1 null polymorphism was significantly higher in NE population as compared with Arabian, American, European, and Caucasian populations (p < 0.05).
Combined GSTT1 and GSTM1 null polymorphism was significantly higher in NE Indians as compared with Turkish population (p < 0.05).
NA, Not available.
GSTM1 genotype
The GSTM1 null frequency in the overall NE population was found to be 41.9%. The frequency of GSTM1 null genotype in the Mizoram, Sikkim, and Assam populations was 46.9%, 46%, and 35%, respectively. A comparison of GSTM1 null genotype in Mizoram, Sikkim, and Assam did not show significant differences in either of the population groups studied (Table 1).
The frequency of the GSTM1 null genotype in the NE population was compared with other available data from Central, Northern, and Southern populations of India (Table 2). The genotypic deviation of GSTM1 null genotype in the Mizoram population (46.9%) was found to be significantly higher when compared with that of the Northern (28%, χ2 = 12.524, p = 0.0004) (Singh et al., 2008) and Southern Indian populations (30.3%, χ2 = 13.478, p = 0.0002) (Naveen et al., 2004). Similarly, the frequency of the GSTM1 null genotype in the Sikkim population (46%) was found to be significantly higher when compared with that of the Northern (28%, χ2 = 9.036, p = 0.0026) (Singh et al., 2008) and Southern Indian populations (30.3%, χ2 = 8.819, p = 0.003) (Naveen et al., 2004). Also, the frequency of GSTM1 null genotype in the overall NE population (41.8%) was significantly higher when compared with that of the Northern (28%, χ2 = 10.673, p = 0.0011) (Singh et al., 2008) and Southern Indian (30.3%, χ2 = 13.084, p = 0.0003) (Naveen et al., 2004) populations, but there were no significant differences in GSTM1 null genotype between the combined NE population and the Central Indian population.
The frequency of GSTM1 null genotype of NE Indians was also compared with reported data from Chinese, Arabian, American, Turkish, and Caucasian populations (Table 3). The genotype frequency of GSTM1 null in the overall NE population (41.9%) did not show much deviation when compared with that in the Chinese population (42%, χ2 = 0.010, p = 0.9195) (Bian et al., 2000). Significant variation was found in the GSTM1 null genotype frequency when the overall NE population was compared with other populations of the world, that is, Arabians (54.6%, χ2 = 14.298, p = 0.0002) (Siraj et al., 2008), Americans (57.8%, χ2 = 14.079, p = 0.0002) (Wideroff et al., 2007), and Caucasians of America (50.1%, χ2 = 6.408, p = 0.0114) (Zhao et al., 2007). Higher frequency was also observed when compared with that of the Turkish population (32.7%, χ2 = 2.48, p = 0.1152) (Yalin et al., 2007).
GSTT1/GSTM1-double null genotype
The frequency of GSTT1/GSTM1-double null polymorphism was found to be significantly lower in individuals from Assam (5.8%) when compared with individuals from Mizoram (21.3%, χ2 = 15.713, p = 0.0001) and Sikkim (19.6%, χ2 = 11, p = 0.0009) (Table 1). The frequency of GSTT1/GSTM1-double null polymorphism of overall NE India (14.6%) was significantly higher than that of the North (8.5%, χ2 = 4.150, p = 0.0416) (Singh et al., 2008) and South Indians (4.6%, χ2 = 27.011, p < 0.0001) (Naveen et al., 2004) (Table 2). Comparison of the frequency of GSTT1/GSTM1-double null polymorphism of overall NE India with the available data of Chinese, Arabian, and Turkish populations showed not much deviation from the frequency in the Chinese population (18%, χ2 = 0.442, p = 0.5063) (Bian et al., 2000), whereas it was found to be significantly higher than that of the Turkish population (6%, χ2 = 4.412, p = 0.0357) (Yalin et al., 2007) (Table 3).
Discussion
Polymorphisms of GSTM1 and GSTT1 genes have been found to be associated with susceptibility to several diseases in addition to being associated with modulation of drug response and resistance to chemotherapy in cancers (Hayes and Pulford, 1995). Cancers that have been associated with cigarette smoking (Strange and Fryer, 1999) and tobacco chewing (Bhattacharjee et al., 2006) such as oral, esophageal, gastric, and lung cancers are particularly implicated with the carcinogenicity of tobacco constituents and GST gene polymorphisms. A significant risk of GST null genotype with certain other cancers including bladder (Grando et al., 2009), thyroid (Ho et al., 2006), colon (Zhu et al., 2002), nasopharyngeal (Bendjemana et al., 2006), breast (Syamala et al., 2008), and prostate cancers (Mo et al., 2009) had also been reported in earlier studies. Moreover, susceptibility to other diseases such as cardiovascular disease (Wang et al., 2008), childhood malnutrition (Marshall et al., 2006), obstructive pulmonary disease (Xiao et al., 2004), diabetes (Yalin et al., 2007), Parkinson disease (Nishimura et al., 2005), and bronchial asthma (Saadat and Ansari-Lari, 2007) has also reported to be associated with polymorphisms in GST genes.
GST enzymes have been reported to be active toward reactive oxygen species and play an important role in protecting cells against oxidative stress (Hanene et al., 2007). These enzymes have a wide range of functions in cells, including the removal of reactive oxygen species and regeneration of S-thiolated proteins, both of which are consequences of oxidative stress (Sheehan et al., 2001). Several studies have indicated that oxidative stress impairs pulmonary function and makes existing asthma worse (Holla et al., 2006). It is possible that intermediates of electrophilic metabolites arising in the first phase of detoxification are not metabolized by GST enzymes in asthmatic patients and are not excreted. These intermediate metabolites may damage cells and generate oxidative stress (Tamer et al., 2004). A high prevalence of bronchial asthma has been reported from NE India. However, till date no study has been carried out to observe the association of asthma with GST polymorphism in this region of India.
GSTT1 and GSTM1 have broad and overlapping substrate specificities (Ryberg et al., 1997), and the genetic polymorphisms of these enzymes are attractive candidates for cancer susceptibility, as reduced ability to remove potential carcinogens may result in mutation in key tumor suppressor genes. Earlier molecular epidemiologic studies have suggested that allelic (deletion or null) variants of GSTT1 and GSTM1 genes are associated with failure to express GST proteins, which may lead to less effective detoxification of potential carcinogens and increased susceptibility to cancer (Board, 1981; Seidegard et al., 1988; Pemble et al., 1994; Spurdle et al., 2001). A genetic predisposition and susceptibility to certain cancers has long been suspected in the ethnic population of NE Indians. For example, a high age adjusted rate (AAR per 100,000) has been reported for oral and esophageal cancer in Assam (AAR 8.7 and 32.5, respectively), gastric and lung cancer in Mizoram (AAR 57.3 and 39.3, respectively), and nasopharyngeal cancer in Sikkim (AAR 4.1) (ICMR, 2006). However, the association of these cancers with polymorphisms of GST genes has not been analyzed. Besides, the frequency of null genotypes in the diverse ethnic population of NE India is also unknown.
In the current study, a high frequency of GSTT1 null (32.7%) and GSTM1 null (41.9%) genotype was found in the NE population when compared with that of North (19% and 28%, respectively) (Singh et al., 2008), Central (12.4% and 35.4%, respectively) (Saravana Devi et al., 2008), and South Indians (16.8% and 30.3%, respectively) (Naveen et al., 2004). In addition, a higher frequency of combined GSTT1 and GSTM1 null in overall NE Indians (14.6%) was found when compared with the frequencies in the Northern (8.5%) (Singh et al., 2008) and Southern Indian population (4.6%) (Naveen et al., 2004), which suggests that NE Indians differ from the rest of the Indian population with reference to genotypic distribution of GST polymorphism. In particular, the frequency of GSTT1 null genotype was found to be very high in the Mizoram region of NE India (51%) as compared with the frequency of GSTT1 null genotype in Sikkim (34.3%) and Assam (15.7%), thereby showing the presence of intraethnic differences.
The overall frequency of GSTT1 and GSTM1 null polymorphism in NE India was similar to the high frequency of GSTT1 and GSTM1 polymorphism that had been earlier reported from China (37.5% and 42%, respectively) (Bian et al., 2000). In addition, combined GSTT1 and GSTM1 null polymorphisms were also found to be higher in NE Indian and Chinese populations (14.6% and 18%, respectively) (Bian et al., 2000) as compared with that of the Turkish population (6%) (Yalin et al., 2007). Interestingly, the Chinese have also reported a high prevalence of gastric cancer (Parkin et al., 2002) and esophageal cancer (Adams et al., 2003). The frequency of GSTT1 and GSTM1 gene deletion in our population and the Chinese population was significantly different from what has been reported in the Arabian, American, and Caucasian populations. This difference can probably be explained by the ethnic variation in the East Asian population, which has a higher number of individuals of mongoloid origin as compared to other regions. The NE population bears a close resemblance to the East Asian population. The available data and our finding thus favor the hypothesis that suggests an ancestral origin of some ethnic groups of NE India from China (Phukan et al., 2004). We also hypothesize that the individuals with polymorphic variant of GST null genotype in NE India may have a varied rate of metabolic activation/deactivation of xenobiotics as compared to other ethnic groups. In addition, epigenetic inactivation due to hypermethylation of CpG islands around transcription start sites in GST genes (GSTM2-M5, GSTA4, GSTP1, GSTZ1, GSTT2, GSTO1, and GSTO2) may be an important mechanism in tumourigenesis. DNA hypermethylation has been demonstrated to regulate the expression of members of the Mu-class GSTs in Barrett's adenocarcinoma (Mavis et al., 2009; Peng et al., 2009). Moreover, aberrant methylation and downregulation of GSTP1 may contribute to the carcinogenetic process in breast, prostate, renal, and pancreatic neoplasms (Esteller et al., 1998; House et al., 2003). DNA hypermethylation has also been reported to promote progression in bronchioloalveolar carcinoma and could serve as a poor prognostic indicator for patients with this disease (Gao et al., 2009). In addition to transcriptional silencing of GST genes, differential expressions of GSTM3, GSTP1, and GSTO1 proteins have been reported in neurodegenerative disorders such as Parkinson disease (Werner et al., 2008). It is possible that GST polymorphism is responsible for the higher prevalence of certain complex diseases like cancer, hypertension, asthma, and cardiovascular diseases in NE India. To the best of our knowledge, this is the first report on GST gene polymorphisms in the NE population of India.
Footnotes
Acknowledgments
The study was funded by a grant from the Indian Council of Medical Research, New Delhi (Ref. No. 49/3/RMRC/NE/2005-NCD-II dated 28-03-05). We are thankful to the clinicians involved in this study-Dr. K. Ahmed, Dr. B.K. Das, Dr. J. Purkaystha, Dr. C. Bhuyan, Dr. B.J. Saikia, and Dr. N. Kalita.
Disclosure Statement
The authors declare that no competing financial interests exist.