




Abstract
We developed a method of quality control and monitoring for the isolation of mesenchymal stem cells (MSCs) from bone marrow and their differentiation into osteoblasts. After dividing the cell culture process into five groups based on cell types such as MSCs and osteoblasts, we used microarray analysis to select genes with expression profiles characteristic of each group and quantitative polymerase chain reaction for confirming the expression profiles of these genes. Comparing multiple gene expression profiles per cell from quantitative polymerase chain reaction permitted us to distinguish (1) different groups of cell culture including MSCs and osteoblasts; (2) MSCs that had differentiated cells other than osteoblasts such as chondroblasts, adipocytes, or skin-derived fibroblasts; and (3) desirable MSCs from undesirable MSCs occurring under different culture conditions. These findings suggest that it is possible to standardize MSCs and osteoblasts on the basis of multiple gene expression profiles and to check the quality of these cells. We believe that our methods can be applied to cells cultured for transplants.
Introduction
M
To ensure the safety of cells used in regenerative medicine, it is important to guarantee the quality of cultured cells because of the possibility of malignant transformation of MSCs, differentiation into unintended cell types, and contamination by viruses or bacteria during cell culture. For instance, it is necessary to conduct various tests that conform to Federal Drug Administration guidelines in the United States when we propose the use of cultured cells for medical purposes (Guidance for Industry, 1998; Guidance for Reviewers, 2003). Thus, in this work, we attempted to develop new quality control inspection methods that can simultaneously test for multiple criteria such as purity and sterility. To put regenerative medicine into practical use, it is necessary to develop a simple and inexpensive quality control inspection system for cultured cells in addition to the basic techniques of cell culture.
Materials and Methods
Procurement of cells
Bone marrow samples (ABM001; AllCells, Emeryville, CA) were purchased after gaining approval of the ethical committee of the Olympus Corporation. Table 1 shows the ages and sexes of the donors. Skin-derived fibroblasts were also purchased from Lonza Walkersville (CC-2511; Walkersville, MD).
Cell culture
Preparation of on-specification model cells
A culture protocol has been established by Pittenger et al., in which MSCs are isolated from bone marrow and then induced to differentiate into osteoblasts (Pittenger et al., 1999). We considered their protocol to include five groups of cells, as follows (Fig. 1): Group 1 is bone marrow, Group 2 is MSCs with low quantities of other bone marrow-derived cells halfway into the isolation process of MSCs, Group 3 is MSCs, Group 4 is osteoprogenitor cells to initiate differentiation, and Group 5 is osteoblasts. In addition, we have divided these five groups into eight stages based on cellular status, as our modified protocol of Pittenger et al. contains two passages in Group 3 (MSCs) and MSCs differentiated into osteoblasts showed three degrees of alkaline phosphatase staining density at approximately 4, 7, and 14 days after the induced differentiation (Fig. 2b). We cultured differentiation cells for a long period, as cells obtained from the early stage of differentiation could be used for transplant, while the remainder of transplanted cells would be necessary for subsequent culture for use in quality control of differentiation.

Five groups of cell culture. The five groups, which indicate the type of cell, include eight stages in the culture protocol.
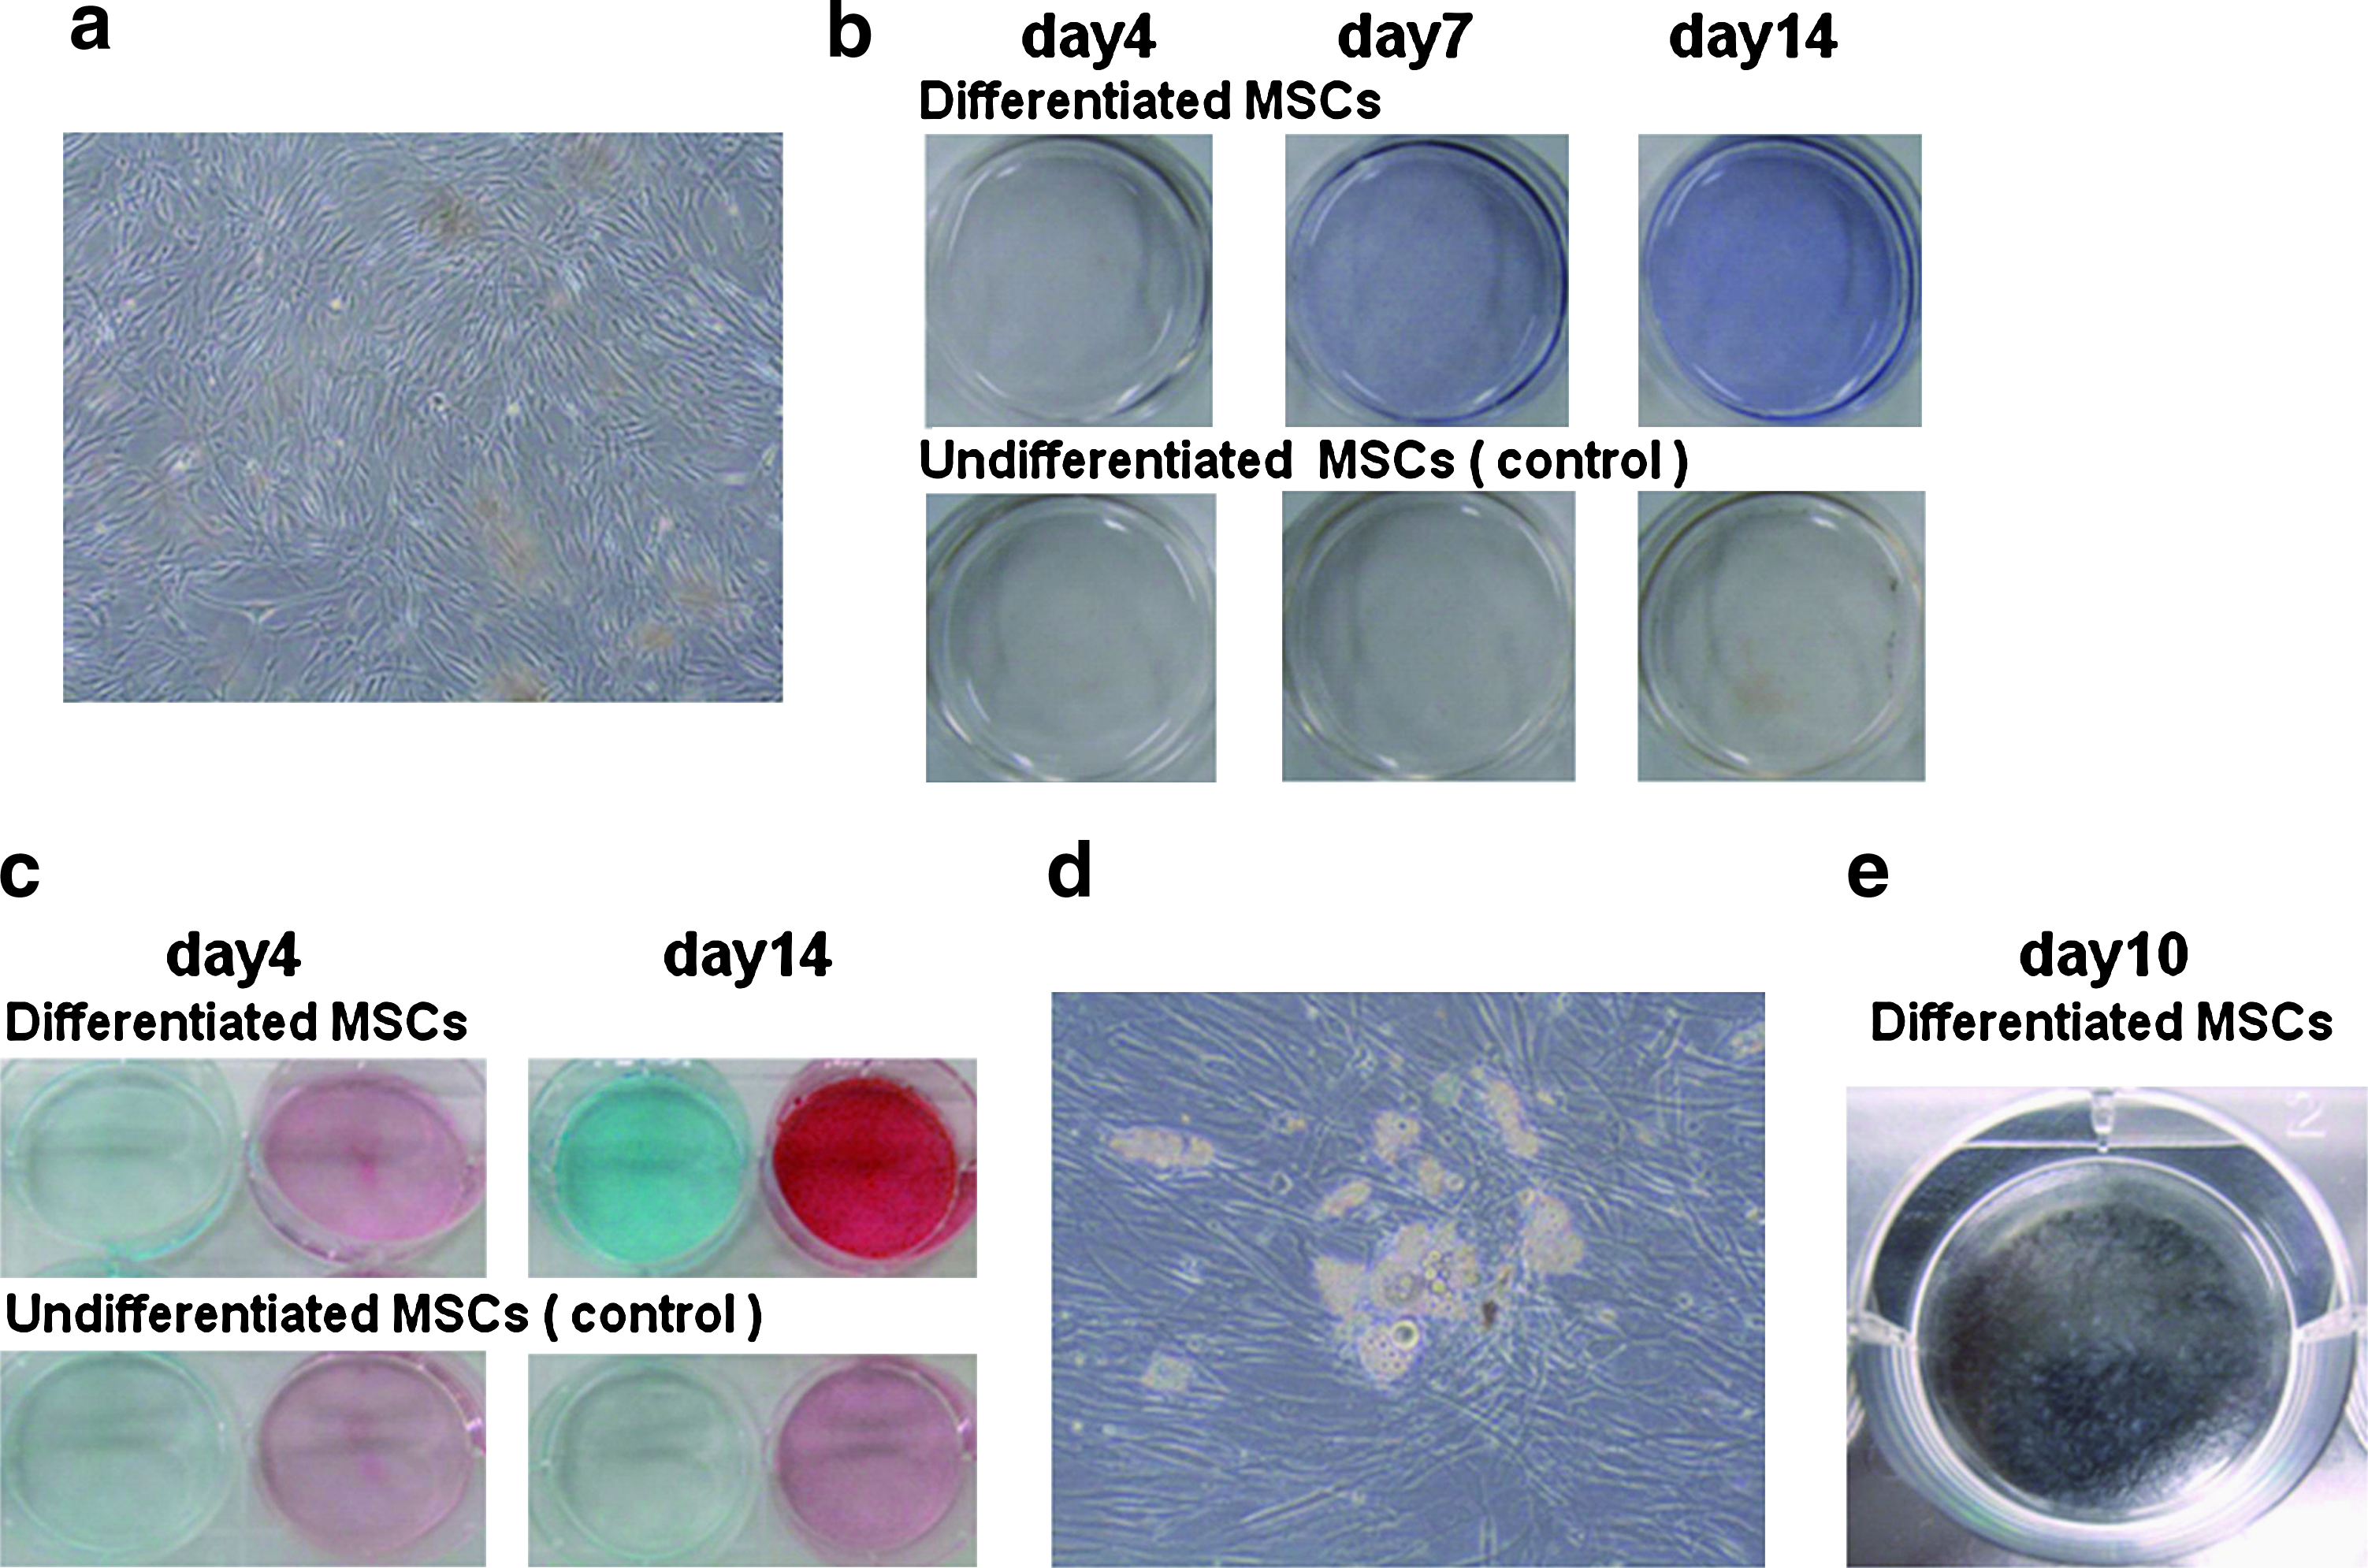
Picture of cells with microscopic or direct observation. (
We defined the following cells as on-specification model cells, according to a modified culture protocol of Pittenger et al. Bone marrow samples (ABM001; AllCells) from 11 donors were suspended in MSC medium (i.e., Dulbecco's modified Eagle medium [Invitrogen, Carlsbad, CA] containing 10% fetal bovine serum, an antibacterial agent, 50 μg/mL ascorbic acid-2-phosphate, and 10 ng/mL basic fibroblast growth factor) and subsequently seeded into tissue flasks, and the remaining bone marrow was harvested as stage 1 (bone marrow). To raise the purity of MSCs, MSC medium of approximately 3/4 was changed 4 days after seeding, and some bone marrow-derived cells in almost fresh medium were harvested as stage 2 (MSCs with low quantities of other bone marrow-derived cells). MSCs were cultured for two passages after the extra MSC medium was changed, and some of them were harvested per passage as stages 3 and 4, respectively, when they reached subconfluence and were subsequently induced to differentiate into osteoblasts. MSCs of stages 3 and 4 showed uniform spindle-shaped adhesion cells (Fig. 2a). Some differentiated MSCs that were uniform and spindle shaped were harvested as stage 5 (osteoprogenitor cells) at 1 day after the induced differentiation. MSCs began to change to a polygonal shape at approximately 3 days after the induced differentiation and were subsequently harvested as stages 6 (early stage of differentiation), 7 (middle), and 8 (late) after 4, 7, and 14 days had passed. Differentiated MSCs of stages 6, 7, and 8 were confirmed with alkaline phosphatase staining (Fig. 2b). Cells were incubated at 37°C in a 5% CO2 incubator.
Preparation of off-specification model cells
We defined the following cells as off-specification model cells: (1) differentiated cells other than osteoblasts such as chondroblasts or adipocytes, (2) different kinds of cells such as skin-derived fibroblasts, (3) cells contaminated by viruses or bacteria, and (4) undesirable cells derived under different culture conditions such as extra passaging.
MSCs differentiated into chondroblasts and adipocytes were prepared as follows: bone marrow-derived MSCs from a donor were cultured for two passages, retrieved when they reached subconfluence as same as the on-specification model cells, and were subsequently induced to differentiate into chondroblasts and adipocytes. Cells were harvested at 4 and 14 days after induced differentiation. Chondrogenic differentiation was confirmed with microscopic observation and alcian blue and safranin-O staining (Fig. 2c). Adipogenic differentiation was confirmed with microscopic observation of the accumulation of neutral lipid vacuoles (Fig. 2d, e).
Fibroblasts were prepared as follows: skin-derived fibroblasts (CC-2511; Lonza Walkersville) were cultured with the Fibroblast Growth Medium-2 Bullet Kit (CC-3132; Lonza Walkersville) and MSC medium. These cells were harvested when they reached subconfluence.
MSCs contaminated by herpes simplex virus-1 (HSV-1) and undesirable MSCs derived from extrapassage cultures were prepared as follows: a solution containing about 107 copies of HSV-1 was mixed with 5 mL MSC medium with bone marrow-derived MSCs from a donor in passage 2 culture (Fig. 1). Seventy-two hours later, MSCs contaminated by HSV-1 exhibited cytopathic effects and were subsequently harvested. To produce undesirable MSCs (MSC I), bone marrow-derived MSCs from a donor were cultured from passage 2 (Fig. 1) to 6 in MSC medium without inducing differentiation into osteoblasts. MSC I were harvested when they reached subconfluence. The cells were incubated at 37°C in a 5% CO2 incubator.
Microarray analysis
Total RNA was extracted at eight stages during cell culture using the RNeasy Mini Kit (Qiagen, Hilden, Germany). Total RNA mix (Becton Dickinson, Franklin Lakes, NJ) of bone marrow was prepared as a reference. Complementary mRNA of samples and reference were amplified using the Amino Allyl MessageAmp aRNA Kit (Ambion, Austin, TX). Five micrograms of amplified mRNA of samples was labeled with Cy5, and that of the reference was labeled with Cy3. The Cy5-labeled sample and Cy3-labeled reference were mixed, which was followed by competitive hybridization on a commercially available DNA microarray, the AceGene Human Oligo Chip 30K 1 Chip Version (Hitachi Software Engineering, Tokyo, Japan), performed according to the manufacturer's instructions. The slides were scanned using a ScanArray express (PerkinElmer, Boston, MA). For further statistical analysis, the data were converted from Cy5- and Cy3-detected TIFF images to signals using ImaGene software (BioDiscovery, El Segundo, CA). The Cy5 (sample)/Cy3 (reference) ratio for each mRNA signal was calculated after global Lowess normalization.
Decision-tree method for statistical tests
Statistical tests were performed for the expression ratios per gene for five donors across groups according to a decision tree (Fig. 3). If both Bartlett's test for equality of variance and the one-way analysis of variance were significant (p < 0.05), the Tukey-Kramer multiple comparison test was performed. If Bartlett's test was not significant and the Kruskal-Wallis analysis of variance was significant (p < 0.05), the Steel-Dwass multiple comparison test was performed.
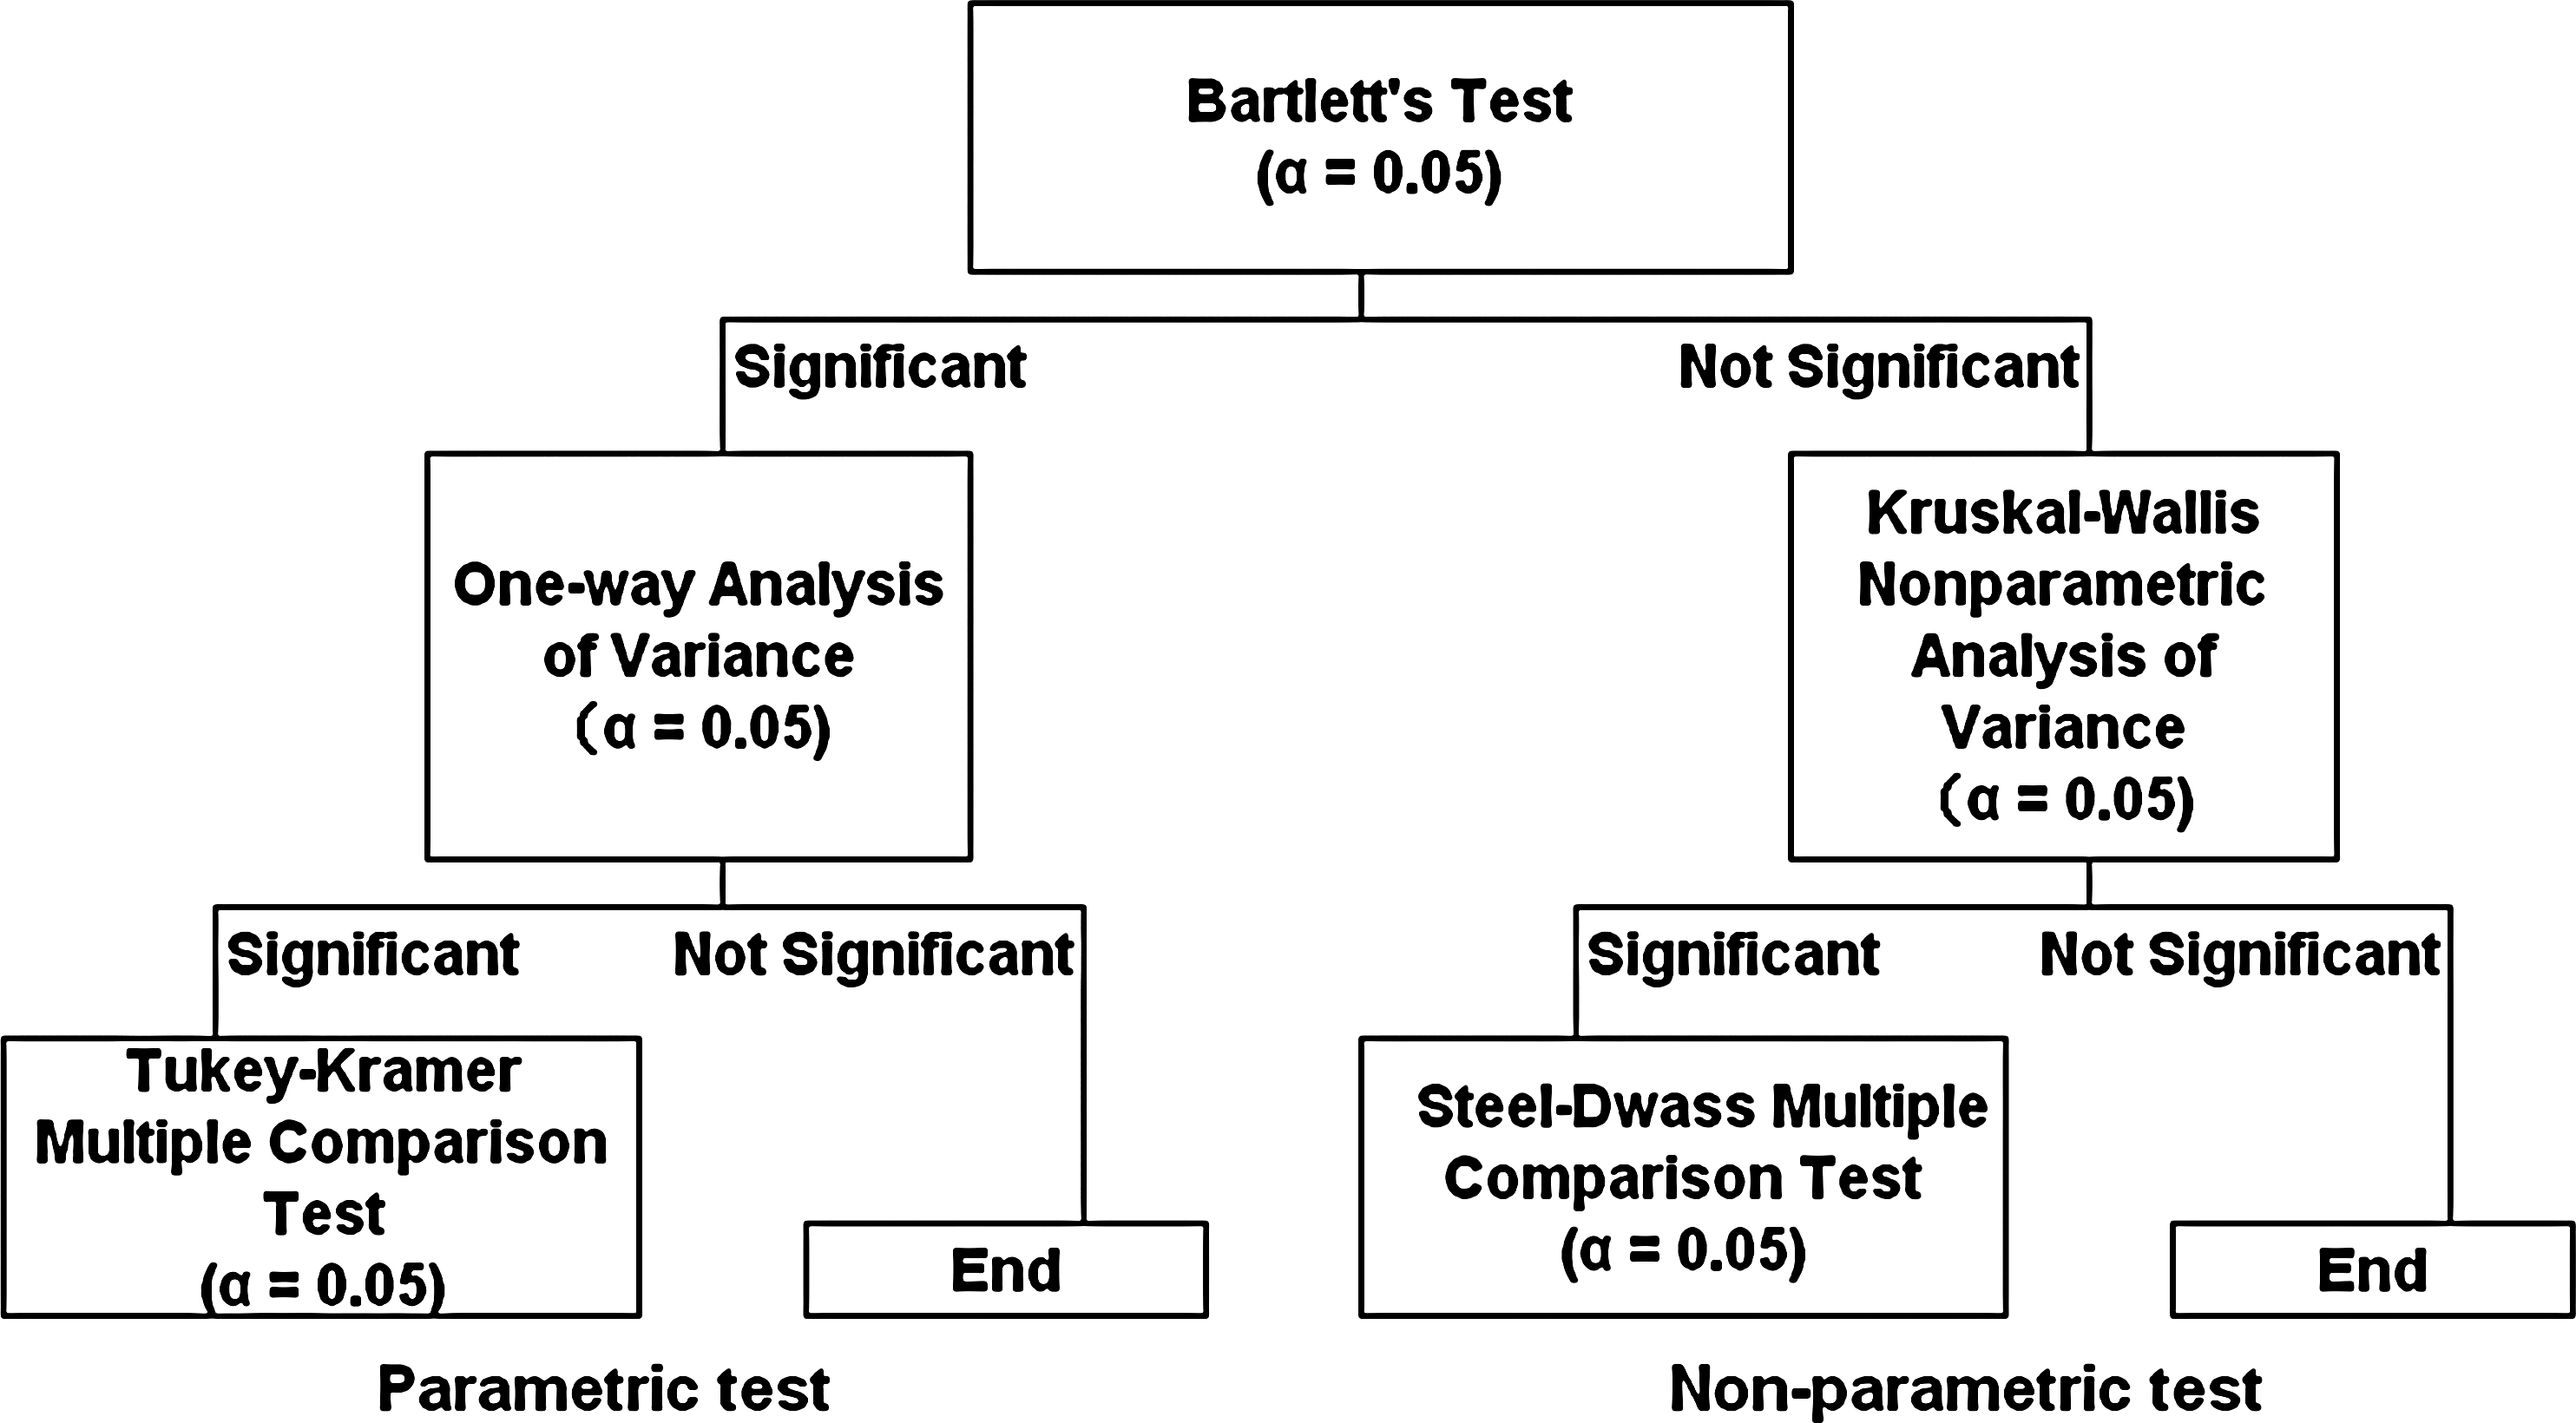
Decision tree of multiple comparison tests. Statistical tests for five donors' expression ratios per gene across groups were performed according to a decision tree. If both Bartlett's test and the one-way analysis of variance were significant (p < 0.05), the Tukey-Kramer test was performed. If Bartlett's test was not significant and the Kruskal-Wallis analysis of variance was significant (p < 0.05), the Steel-Dwass test was performed.
Real-time quantitative polymerase chain reaction
Total RNA was extracted using the RNeasy Mini Kit (Qiagen). As a template for cDNA synthesis, 1 μg of extracted total RNA was used. cDNA synthesis was performed using Super Script II Reverse Transcriptase (Invitrogen) and Random Primer (hexamer) (TaKaRa, Kyoto, Japan) according to the manufacturer's instructions. The synthesized cDNA was used as a template of real-time quantitative polymerase chain reaction (PCR). Real-time PCR was performed by probe-based (TaqMan probe method) or intercalator-based (SYBR Green method) PCR using the ABI PRISM 7700 Sequence Detector (ABI, Foster City, CA). The TaqMan probe method was performed using TaqMan® Universal PCR Master Mix (ABI) and TaqMan Gene Expression Assays (ABI). The SYBR Green method was performed using the SYBR® Green PCR Master Mix (ABI) with the following originally designed primers: pIFI27-like protein (forward: 5′-TGGCTACTCTGCAGTCCGTG-3′, reverse: 5′-GCCAGGAGGATGTTGGATGA-3′), similar to P311 protein (forward: 5′-TGCTGCCACAGGACCTGA-3′, reverse: 5′-GGAGCATGTTGAAAGTCCAAAAT-3′), high-mobility group box 2 (forward: 5′-TGCCGGGAAGAGCACAAG-3′, reverse: 5′-TTCCGCGAAATTGACGGA-3′), and HLA-DP (forward: 5′-CAGTCTGATTCTGCCCGGA-3′, reverse: 5′-ATGAGCCCCAGCACGAAG-3′). Ct values of each gene were calculated after 40 PCR cycles, after which the ΔCt (40-Ct) values were calculated (Fig. 4a-4k).

Expression profiles of representative genes by microarray and real-time quantitative polymerase chain reaction (PCR) analyses. (
Hierarchical clustering by the classical method
We compared multiple ΔCt values per cell using hierarchical clustering because we were interested in distinguishing the cell culture group and cellular status on the basis of multiple gene expression profiles. Hierarchical clustering was carried out using the Euclid distance and the average linkage method with TM4 MeV software (www.tm4.org/). The hierarchical clustering dendrograms, which were adjusted with a distance threshold of 13.0, permitted us to distinguish five groups of cell culture (Fig. 5a), to distinguish five groups of cell culture from MSCs that had differentiated into chondroblasts, adipocytes, or skin-derived fibroblasts, and to distinguish MSCs from those contaminated by HSV-1 or undesirable MSCs derived from extrapassage (Fig. 5b).

Hierarchical clustering. (
Results
Screening of genes for quality control
Screening of candidate genes
To obtain standard on-specification model cells, five groups of cells cultured, including eight stages (Fig. 1) derived from five donors (A-E), were harvested according to our protocol, and gene expression profiles were analyzed by microarray. The averages of the five donors' expression ratios per gene were compared across stages. Then the genes that exhibited more than twofold change in temporal expression were selected. Pearson's correlation coefficient was calculated for each gene by comparing the temporal gene expression pattern of five donors in the following combinations: A versus B, A versus C, A versus D, and A versus E. The average correlation coefficient per gene was calculated, and 2080 candidate genes with an average correlation coefficient of >0.4 were selected.
Screening of genes with characteristic profiles in culture
We tried to screen genes exhibiting characteristic profiles for certain groups such as MSCs or osteoblasts and to demonstrate significant changes between two adjacent groups from 2080 candidate genes. Statistical tests were performed for the expression ratios per gene for five donors across groups according to a decision tree (Fig. 3). As a result, we selected 32 genes exhibiting characteristic profiles for certain groups (p < 0.01), and 9 genes demonstrating significant changes between two adjacent groups. Thirty-eight genes were selected in all, as the group of 32 genes and that of 9 genes had 3 genes in common.
The 32 genes included 30 genes that exhibited specifically up- or downregulation in certain groups and 11 genes that exhibited in the middle expression of certain alternating groups. The 30 genes that showed up- or downregulation were as follows: 3 upregulated genes in Group 1 (MMP9 [Fig. 4a], CCNL1, ARG1), 6 in Group 2 (CD163 [Fig. 4b], AIF1, LGMN, CTSC, CD14, IFI30), 2 in Group 3 (LXN [Fig. 4b], TSC22D1 [Fig. 4c]), 1 in Group 4 (similar to P311 protein; Fig. 4e), and 4 in Group 5 (COL11A1 FBLN5 [Fig. 4f ], FRZB, NUPR1 [Fig. 4g]); 8 downregulated genes in Group 1 (ANXA2 [Fig. 4a], PRDX1, DBI, PRDX4, ATP5H, NDUFB3, MGST3, pIFI27-like protein), 1 in Group 3 (IRS2, Fig. 4c), 1 in Group 4 (SLC40A1, Fig. 4e), and 4 in Group 5 (HLA-DRA [Fig. 4h], HLA-DP, high-mobility group box 2, HNRPA1). The 11 genes comprised 8 genes that exhibited in the middle expression of Groups 1 and 3 (ANXA2 [Fig. 4a], PRDX4, ATP5H, NDUFB3, MGST3, pIFI27-like protein, MMP9 [Fig. 4a], ARG1), 2 in the middle expression of Groups 2 and 4 (SPARC [Fig. 4d], CTGF), and 1 in the middle expression of Groups 3 and 5 (COL11A1, Fig. 4f ).
The nine genes that exhibited and significantly increased and decreased between two adjacent groups were as follows: CTSB (Fig. 4h) and MMP9 (Fig. 4a) significantly increased and decreased between Groups 1 and 2, COL1A2 (Fig. 4i) and IL8 between Groups 2 and 3, PTX3 (Fig. 4j) and LXN (Fig. 4b) between Groups 3 and 4, and COL11A1 (Fig. 4f), APOD (Fig. 4j), and TGFBI (Fig. 4k) between Groups 4 and 5.
Confirmation of the temporal expression pattern of 38 genes with real-time quantitative PCR
In general, an independent gene expression profiling method such as real-time PCR is required to confirm all microarray results; real-time PCR provides a wide linear dynamic range, demonstrates high sensitivity, and is highly quantitative when compared with the microarray method. The expression profiles of the selected 38 genes from standard on-specification model cells were analyzed with real-time PCR. The temporal expression patterns of these 38 genes were found to be similar in the microarray and real-time quantitative PCR analyses (Fig. 4a-k), thus confirming the validity of the temporal expression patterns of these genes.
Verification of the ability to distinguish cells on the basis of the expression profiles of 38 genes
Dividing groups of cell culture
We compared 38 ΔCt values per standard on-specification cell derived from five donors (A-E) and tried to classify different groups of cell culture such as MSCs and osteoblasts using hierarchical clustering. As a result of adjusting the distance threshold to 13.0 so that the terminal nodes of the dendrogram became 5, it was possible to divide 38 ΔCt values per cell into five classes. The five classes divided by 38 ΔCt values corresponded to the type of cells such as MSCs or osteoblasts. To verify these results, additional on-specification model cells derived from six donors (F-K) were analyzed using real-time PCR. As a result, all ΔCt values per cell derived from the six donors were the same as those from the original five donors (Fig. 4a-k). In addition, the hierarchical clustering of on-specification model cells derived from 11 donors (the standard 5 donors plus the additional 6 donors) indicated that it was also possible to divide multiple ΔCt values per cell into five classes (Fig. 5a).
ΔCt averages of the 11 donors' expression per gene, which exhibited (1) specific upregulation in MSCs or osteoblasts, (2) upregulation in MSCs and osteoblasts in common, and (3) significant expression changes between MSCs and osteoblasts, were analyzed. First, the ΔCt averages of LXN (Fig. 4b) and TSC22D1 (Fig. 4c) exhibited specific upregulation in Group 3 (MSCs); LXN was 12.6 and TSC22D1 was 13.9 in Group 3. In contrast, in the other groups, the ΔCt range of LXN was 7.2-9.6 and of TSC22D1 was 9.4-11.8. The difference in ΔCt averages of LXN between Group 3 and the other groups (3.9) was greater than the difference in TSC22D1 (3.0). The ΔCt averages of COL11A1 (Fig. 4f), FBLN5, FRZB (Fig. 4g), and NUPR1 exhibited specific upregulation in Group 5 (osteoblasts); COL11A1 was 14.6, FBLN5 was 14.5, FRZB was 13.4, and NUPR1 was 13.9 in Group 5. On the other hand, in the other groups, the ΔCt range of COL11A1 was not detected −11.4, FBLN5 was 8.5-13.3, FRZB was 1.6-9.8, and NUPR1 was 2.6-13.0. It was in COL11A1 that the difference in ΔCt averages between Group 5 and the other groups (9.7) was the greatest, with the next being FRZB (7.2). Second, the ΔCt averages of expression were more than 14.0 in MSCs and osteoblasts, with 10 genes in common (SPARC, ANXA2, CTSB, CTGF, COL1A2, similar to P311 protein, pIFI27-like protein, ATP5H, high-mobility group box 2, and MGST3). Further, only SPARC (Fig. 4d) and CTGF exhibited a more than 1.4 ΔCt increase before and after differentiation. Third, the following genes exhibited significant expression changes between MSCs and osteoblasts: APOD (Fig. 4j) exhibited the largest ΔCt increase (7.7) before and after differentiation, and next was COL11A1 (6.6) (Fig. 4f). In contrast, HLA-DRA (Fig. 4h) exhibited the largest ΔCt decrease (−6.5) before and after differentiation.
Distinction between on-specification and off-specification model cells
Bone marrow-derived MSCs that were induced to differentiate into osteoblasts, chondroblasts, and adipocytes were harvested at 4 and 14 days after induction. Fibroblasts were cultured with the Fibroblast Growth Medium-2 Bullet Kit (fibroblasts I) and MSC medium (fibroblasts II) and were harvested when they reached subconfluence. Their gene expression profiles were analyzed using real-time PCR (Fig. 4a-k). We compared 38 ΔCt values of these off-specification model cells with on-specification model cells derived from 11 donors (A-K) and tried to distinguish on- and off-specification model cells using hierarchical clustering. As a result of adjusting the distance threshold to 13.0, 38 ΔCt values of two additional osteoblasts clustered with the on-specification osteoblast models (Fig. 5b), whereas 38 ΔCt values of MSCs that differentiated into chondroblasts, adipocytes, and also fibroblasts I and II formed different clusters from on-specification model cells. Thus, it was possible to distinguish five groups of cell cultures from MSCs that had differentiated cells other than osteoblasts, including chondroblasts, adipocytes, or skin-derived fibroblasts by comparing multiple gene expression profiles per cell. Contaminated MSCs by HSV-1 and undesirable MSCs (MSC I) cultured from passage 2 (Fig. 1) to 6 in MSC medium without inducing differentiation into osteoblasts were harvested, and their gene expression profiles were analyzed using real-time PCR (Fig. 4a-k). As a result, gene expression profiles between contaminated MSCs and on-specification MSC models were significantly different. We compared 38 ΔCt values of these off-specification model cells with on-specification model cells derived from 11 donors (A-K) and tried to distinguish on- and off- specification model cells using hierarchical clustering. As a result of adjusting the distance threshold to 13.0 so that terminal nodes of the dendrogram became 10, 38 ΔCt values of contaminated MSCs and MSC I formed different clusters from on-specification model cells (Fig. 5b). Thus, it was possible to distinguish desirable MSCs from undesirable MSCs contaminated by HSV-1 or derived under different culture conditions such as extra passaging by comparing multiple gene expression profiles per cell.
The ΔCt averages of 11 donors' expression per gene, which exhibited specific upregulation in MSCs or osteoblasts, were compared with ΔCt values of off-specification model cells. As a result, only LXN (Fig. 4b) in Group 3 (MSCs) was higher than any other off-specification model cells except for MSC I. On the other hand, only FRZB (Fig. 4g) in Group 5 (osteoblasts) was higher than any other off-specification model cells.
Discussion
We compared the gene expression profiles of five cell culture groups (Fig. 1) using microarray analyses. We subsequently selected 32 genes exhibiting characteristic expression profiles for certain groups (p < 0.01) such as MSCs or osteoblasts, and 9 genes demonstrating significant changes between two adjacent groups. Thirty-eight genes were selected, as the groups of 32 and 9 genes had 3 genes in common. Comparing the 38 ΔCt values of each cell permitted us not only to distinguish five cell culture groups using multivariate statistical analysis, but also permitted us to distinguish five cell culture groups from MSCs that had differentiated into chondroblasts, adipocytes, or different kind of cells such as skin-derived fibroblasts. HLA-DRA and APOD have been reported to be molecular markers to distinguish MSCs from fibroblasts (Ishii et al., 2005). The expression profiles of APOD and HLA-DRA, which showed a significant difference between MSCs and fibroblasts in our results, corresponded to a previous report. These genes therefore seem to be effective in distinguishing MSCs from fibroblasts. Comparing 38 ΔCt values of each cell also permitted us to distinguish desirable MSCs from those contaminated by HSV-1, and from undesirable MSCs derived from extrapassage culture, despite a report that few genes exhibit significant expression changes between different MSC culture passages (Kulterer et al., 2007). We found that it is possible to distinguish not only groups of cell culture, but also cellular status on the basis of multiple gene expression profiles. These findings suggest that it is not only possible to standardize cultured cells such as MSCs and osteoblasts on the basis of multiple gene expression profiles, but also to check whether the cultured cells satisfy the requirements of on-specification by using multivariate statistical analysis or not.
We compared our result with previous reports regarding genes exhibiting characteristic profiles of MSCs before and after differentiation. SPARC, CTGF, COL1A2, and ANXA2 exhibited upregulation in MSCs, corresponding to the previous reports of human EST sequencing analysis and mouse cDNA microarray analysis (Tremain et al., 2001; Jia et al., 2002). It might be that these four genes exhibited upregulation in MSCs. Further, these four genes also exhibited upregulation in osteoblasts. SPARC (osteonectin), which is well known as an osteogenic marker, shows increased expression before and after osteogenic differentiation, and SPARC has an important function in bone formation (Delany et al., 2000). SPARC exhibited a more than 1.4 ΔCt increase before and after osteogenic differentiation, which corresponds to previous reports. Further, SPARC exhibited a more than 2.4 ΔCt increase before and after chondrogenic differentiation. On the other hand, it has been indicated that CTGF displays multiple functions in MSCs, including the promotion of proliferation and normal osteogenic and chondrogenic differentiation (Yoshimichi et al., 2002; Luo et al., 2004). In our results, CTGF exhibited a more than 1.7 ΔCt increase before and after osteogenic differentiation, but a slight increase (0.5) before and after chondrogenic differentiation. Interestingly, CTGF exhibited a significant decrease (−4.3) before and after adipogenic differentiation. APOD and HLA-DRA, which exhibited significantly increased and decreased expression before and after osteogenic differentiation, respectively, corresponded to previously reported results (Ishii et al., 2005). Further, these significant expression changes resulted in not only differentiation into osteoblasts, but also differentiation into chondroblasts and adipocytes. These genes are also known as molecular markers distinguishing MSCs from fibroblasts (Ishii et al., 2005). Therefore, APOD and HLA-DRA may become molecular markers of MSCs before and after several kinds of differentiation. LXN in MSCs and FRZB in osteoblasts were significantly higher than in any other cell. We therefore believe that these genes may function as molecular markers of MSCs or osteoblasts. LXN (latexin) was originally discovered in the lateral neocortex of rats and acts as a marker of regionality and development in both the central and peripheral nervous systems (Arimatsu, 1994; Hatanaka et al., 1994). LXN is the only known carboxypeptidase inhibitor in mammals. It has recently been shown that LXN regulates the size of the hematopoietic stem cell population in mice (Liang et al., 2007). It may also have the potential to eliminate abnormal stem cells that induce age-related cancer or neurological conditions such as Alzheimer's or Parkinson's disease (Liang and Van Zant, 2008). Based on our findings, we presume that LXN has some regulatory functions in MSCs as well as hematopoietic stem cells, and we would like to elucidate such regulatory mechanisms in MSCs. On the other hand, it has been shown that secreted frizzled-related proteins, including FRZB (sFRP3), bind and act as decoy receptors for Wnt proteins, which promote osteoblast differentiation (Kawano and Kypta, 2003). However, another report has demonstrated that FRZB itself is a potent stimulator of osteoblast differentiation (Chung et al., 2004). It has been proposed that FRZB might stimulate differentiation through a β-catenin-independent pathway in addition to its previously known function as a decoy receptor for Wnts. Our findings support this proposal.
We selected 38 genes exhibiting characteristic profiles for the type of cell, and we found that it is possible to check the quality of cells cultured on the basis of multiple gene expression profiles. Several selected genes, which corresponded to previous reports, might become common molecular markers of cells such as MSCs and osteoblasts. However, genes corresponding to previous reports are not many. We think that differences between our results and previous reports are due to several factors, including the methodology of the cell culture or components of the culture medium. However, we believe that our approach of selecting genes exhibiting characteristic profiles for the type of cell and our method of checking the quality of cells cultured based on multiple gene expression profiles can be applied to any kind of cell culture.
Footnotes
Acknowledgment
We thank the Olympus Corporation for supporting this study.
Disclosure Statement
No competing financial interests exist.