




Abstract
Aims: We earlier identified a novel gene human CAP10-like protein 46 KD (hCLP46) from human acute myelogenous leukemia (AML) transformed from myelodysplastic syndrome CD34+ cells, but the function of this gene remains unclear. In this study, a real-time polymerase chain reaction-based assay was developed to quantify expression of hCLP46 in the peripheral blood of AML and T-acute lymphoblastic leukemia (T-ALL) primary samples and in six leukemic cell lines. Also, we investigated expression of CDKN2A/B and the apoptosis in U937 cells when hCLP46 is downregulated in vitro. Results: Our findings showed that hCLP46 was overexpressed in AML, T-ALL, and the leukemic cell lines. Suppressing hCLP46 overexpression had no effect on expression of CDKN2A/B and apoptosis of U937 cells. Conclusion: Considering that hCLP46 has the capability of modifying the Notch pathway, our finding adds weight to the importance of Notch signaling in hematopoiesis and suggests that overexpression of hCLP46 might be an early event in the pathogenesis of AML and T-ALL.
Introduction
W
Leukemia is characterized by an abnormal proliferation of blood cells, usually leukocytes. hCLP46, identified in our earlier study, possesses the ability of promoting cell proliferation (Teng et al., 2006). Cell growth arrest is usually accompanied by increase of CKIs and/or decreases of cyclins or cyclin-dependent kinases (CDKs), and CDKN2A (p16) and CDKN2B (p15) proteins are two cell cycle regulators involved in the inhibition of G1 phase progression (Serrano and Hannon, 1993). Inactivation of CDKN2A and CDKN2B is frequently observed in AML and ALL, especially in T-acute lymphoblastic leukemia (T-ALL) (Sherr, 1996; Drexler, 1998; Rosu-Myles and Wolff, 2008). Therefore, it is possible that hCLP46 promotes cell proliferation or apoptosis by the blocking of expression of CDKN2A and/or CDKN2B.
hCLP46 was speculated to be an enzyme for glycosylation of proteins (putative lipopolysaccharide-modifying enzyme, www.smart.embl-heidelberg.de with the SMART accession number of SM00672). Rumi, a homolog of hCLP46, was recently mapped to CG31152 in Drosophila melanogaster (Acar et al., 2008). Rumi shares 52% identity with hCLP46 and also encodes a conserved protein with a signal peptide, a CAP10 domain, and a C-terminal KDEL ER retention motif (Acar et al., 2008). Rumi, an O-glucosyltransferase, is capable of adding glucose to serine residues in Notch epidermal growth factor (EGF) repeats with the consensus C1-X-S-X-P-C2 sequence; by O-glucosylating Notch in the ER, Rumi regulates Notch folding and/or trafficking and allows signaling at the cell membrane (Acar et al., 2008). Considering that hCLP46 and Rumi have similar sequence, identical structure and subcellular location, the evolutionary conservation of the Notch signaling pathway, and presence of O-glucosylation in Notch proteins, we can arrive at the suggestion that hCLP46 might have activity similar to Rumi and that it might be responsible for adding glucose to serine residues in Notch EGF repeats. Haltiwanger et al. (Prof. Robert S. Haltiwanger, personal communication) expressed both the mouse and human forms of the Rumi gene (hCLP46) and demonstrated that the expressed proteins contain protein O-glucosyltransferase activity.
In the present study, we investigated the expression patterns of hCLP46 in primary leukemic cells isolated from peripheral blood mononuclear cells (PBMC) of normal subjects and patients with AML or T-ALL and in six cultured leukemic cell lines. We also examined the alteration of expression of two CDK inhibitors (CDKN2A and CDKN2B) and the apoptotic rate when hCLP46 was suppressed in U937 cells.
Materials and Methods
Blood samples and cell cultures
Twelve patients with primary AML and eight patients with primary T-ALL were recruited from a single institution (Fujian Institute of Hematology, Fujian, China). Six patients with autoimmune-mediated thrombocytopenia and six healthy volunteers acted as controls. All subjects had given their consent to the study. Diagnoses were made according to standard morphological, immunological, and molecular genetic criteria. PBMC were separated using Ficoll-Urografin gradients, frozen as viable cells, and kept at −80°C.
The following leukemic cell lines were used: K562, Raji-1, KG-1, HL-60, U-937, and THP-1. They were cultured, as previously reported (Chiaramonte et al., 2003), in complete RPMI-1640 medium supplemented with 5% fetal calf serum and incubated in humidified air with 5% CO2.
U937 cells transfection
U937 cells were grown in 1640 medium supplemented with 5% fetal bovine serum at 37°C in a humidified 5% CO2 atmosphere. To suppress expression of hCLP46, we designed and synthesized an Hairpin siRNA (siRNA6) targeted to the opening reading frame of hCLP46, with the sequences 5′-CACCGGCGTAGCTGCAAGTTTCCGGTTTATTCAAGAGATAAACCGGAAACTTGCAGCTACGCCTTTTTTG-3′ and 3′-CCGCATCGACGTTCAAAGGCCAAATAAGTTCTCTATTTGGCCTTTGAACGTCGATGCGGAAAAAACCTAG-5′ and inserted the oligonucleotides into the pGPU6/GFP/Neo-siRNA expression vector (GenePharma, Shanghai, China) to generate the pGPU6/GFP/Neo-siRNA6 expression vector according to the user's manual. Transfections were performed using Lipofectamine™ 2000 Reagent (Invitrogen, Auckland, New Zealand). Transfection cells were replated at a low density to isolate single colonies 24 h later. The clonal cell lines derived from the transfectants were maintained in selective medium containing 400 μg/mL geneticin disulfate (G418; Sigma, St. Louis, MO).
Retrotranscription and amplification
Total RNA was extracted by Trizol (Invitrogen) according to the user's manual. The RNA samples were retrotranscribed by Sensiscript Reverse Transcriptase in the conditions suggested (Qiagen, Valencia City, CA). For relative quantification of hCLP46, CDKN2A, and CDKN2B, a real-time polymerase chain reaction (PCR) was performed using a 96-well tray and optical caps (Applied Biosystems) with a 25 μL final reaction mixture containing 250 nM each primer, 2 μL of cDNA, and 12.5 μL Power SYBR® Green PCR Master Mix (Applied Biosystems, Foster City, CA) and the housekeeping gene β-actin was used for normalization. The primers for real-time PCR are specified in Table 1. Amplifications for relative quantification were performed in a 7500 real-time PCR System (Applied Biosystems) according to the following regime: preheated at 95°C for 15 min, followed by 45 cycles at 95°C for 15 s, and at 60°C for 1 min. The final results expressed as N-fold differences in target gene expression relative to the calibrator (β-actin) using the 2−ΔΔCT method (Livak and Schmittgen, 2001).
hCLP46, human CAP10-like protein 46 KD; PCR, polymerase chain reaction.
All primer pairs were intron spanning and gave no PCR product using 50 ng genomic DNA as the template. Also, all RT reactions (cDNA synthesis without reverse transcriptase) gave no PCR product.
When the amplifications were completed, a standard option for melting curve (Tm) analysis was carried out to validate the results of amplification. Amplified cDNAs were separated by 2% agarose gel (Biowest, Nuaillé, France) electrophoresis in the presence of 0.01% Gel-red (Biotium, Hayward, CA). The results of electrophoresis were acquired by the image acquisition system EDAS 2400 (Kodak, Rochester, NY) and further analyzed by Kodak 1D image analysis system. PCR products were purified by Agarose Gel DNA Purification Kit Ver.2.0 (TaKaRa, Dalian, China), cloned into pMD18-T Simple Vector (TaKaRa), and sequenced with an ABI PRISM 3730 DNA Sequencer according to the user's manual (Applied Biosystems).
Western blotting analysis for CDKN2A (p16) and CDKN2B (p15) expression
The cloned cells were then washed twice with cold phosphate-buffered saline (PBS) (pH 7.4) and lysed with lysis buffer containing 50 mM Tris-HCl (pH 7.5), 150 mM NaCl, 0.5% Nonidet P-40, 50 mM NaF, 1% Triton-X-100, 1 mM dithiothreitol, and 1 mM phenylmethylsulfonyl fluoride. For western blot analysis, protein concentrations were determined and an equal amount of each sample was resolved by 10% sodium dodecyl sulfate-polyacrylamide gel electrophoresis and transferred to a polyvinylidene fluoride (PVDF) membrane. The process was blocked using PBS containing 5% bovine serum albumin and 0.1% Tween-20, and the membrane was incubated with anti-CDKN2A monoclonal antibody or anti-CDKN2B monoclonal antibody at room temperature for 2 h. This was followed by a second incubation with an horseradish peroxidase-linked secondary antibody at room temperature for 2 h. The signals were detected using a chemiluminescent substrate (ECL; Amersham, Milwaukee, WI). The experiment was performed in triplicate.
Apoptosis analysis of hCLP46 downregulated U937 cells
Apoptosis was assessed using annexin V, a protein that binds to phosphatidylserine residues which are exposed on the cell surface of apoptotic cells. The clonal cell lines derived from the transfectants and the controls (u937 cells) were washed twice with PBS and stained with propidium iodide (PI) and fluorescent isothiocyanate-labeled annexin V (Annexin V-fluorescein isothiocyanate [FITC] Apoptosis Detection Kit; Keygen, Nanjing, China) for 15 min in the dark. The cells were immediately analyzed by fluorescence-activated cell sorting (BD, Franklin Lakes, NJ) for PI+, PI−, annexin V+, and annexin V− cells and duplicated for accuracy. The experiment was performed in quadruplicate to confirm the results.
Statistical analysis
Differences of hCLP46 expression in PBMC between the controls and the patients were assessed using the nonparametric Mann-Whitney test. hCLP46 expression between PBMC of the control and cell lines was assessed using Dunnett's test. The differences of CDKN2A and CDKN2B expression between two groups and hCLP46 expression in U937 cells transfected with empty vector and siRNA expression vector were determined by a Student's t-test. p < 0.05 was considered statistically significant.
Results
A real-time PCR-based assay for relative quantification
A real-time PCR-based assay was developed for the quantification of hCLP46, CDKN2A, and CDKN2B. Transcript levels were initially normalized to the housekeeping gene β-actin. Analysis of the amplification plots, the melting curves, the results of electrophoresis, and sequencing of amplification fragments revealed equal amplification efficiencies and specific amplification for hCLP46 transcripts, the endogenous control β-actin, and CDKN2A and CDKN2B (data not shown). This enabled application of the real-time PCR-based assay for calculation of relative transcript levels.
Overexpression of hCLP46 in AML, T-ALL, and leukemic cell lines
Overexpression is defined as an mRNA level above the mean of the control plus two standard deviation. hCLP46 was overexpressed in the majority of patients' samples (5 of 12 in AML and 6 of 8 in T-ALL) (Fig. 1) and in most of the leukemic cell lines except for Raji-1 (Fig. 2). With regard to hCLP46, expression of two groups of leukemia samples and most of the cell lines (except for Raji-1) showed a highly statistically significant difference when compared with that of control (p < 0.01 of all compare). hCLP46 was overexpressed in U937 cells, and its overexpression could promote cell proliferation in U937 cells (Teng et al., 2006). We, therefore, chose only U937 cells for further investigation in this study.
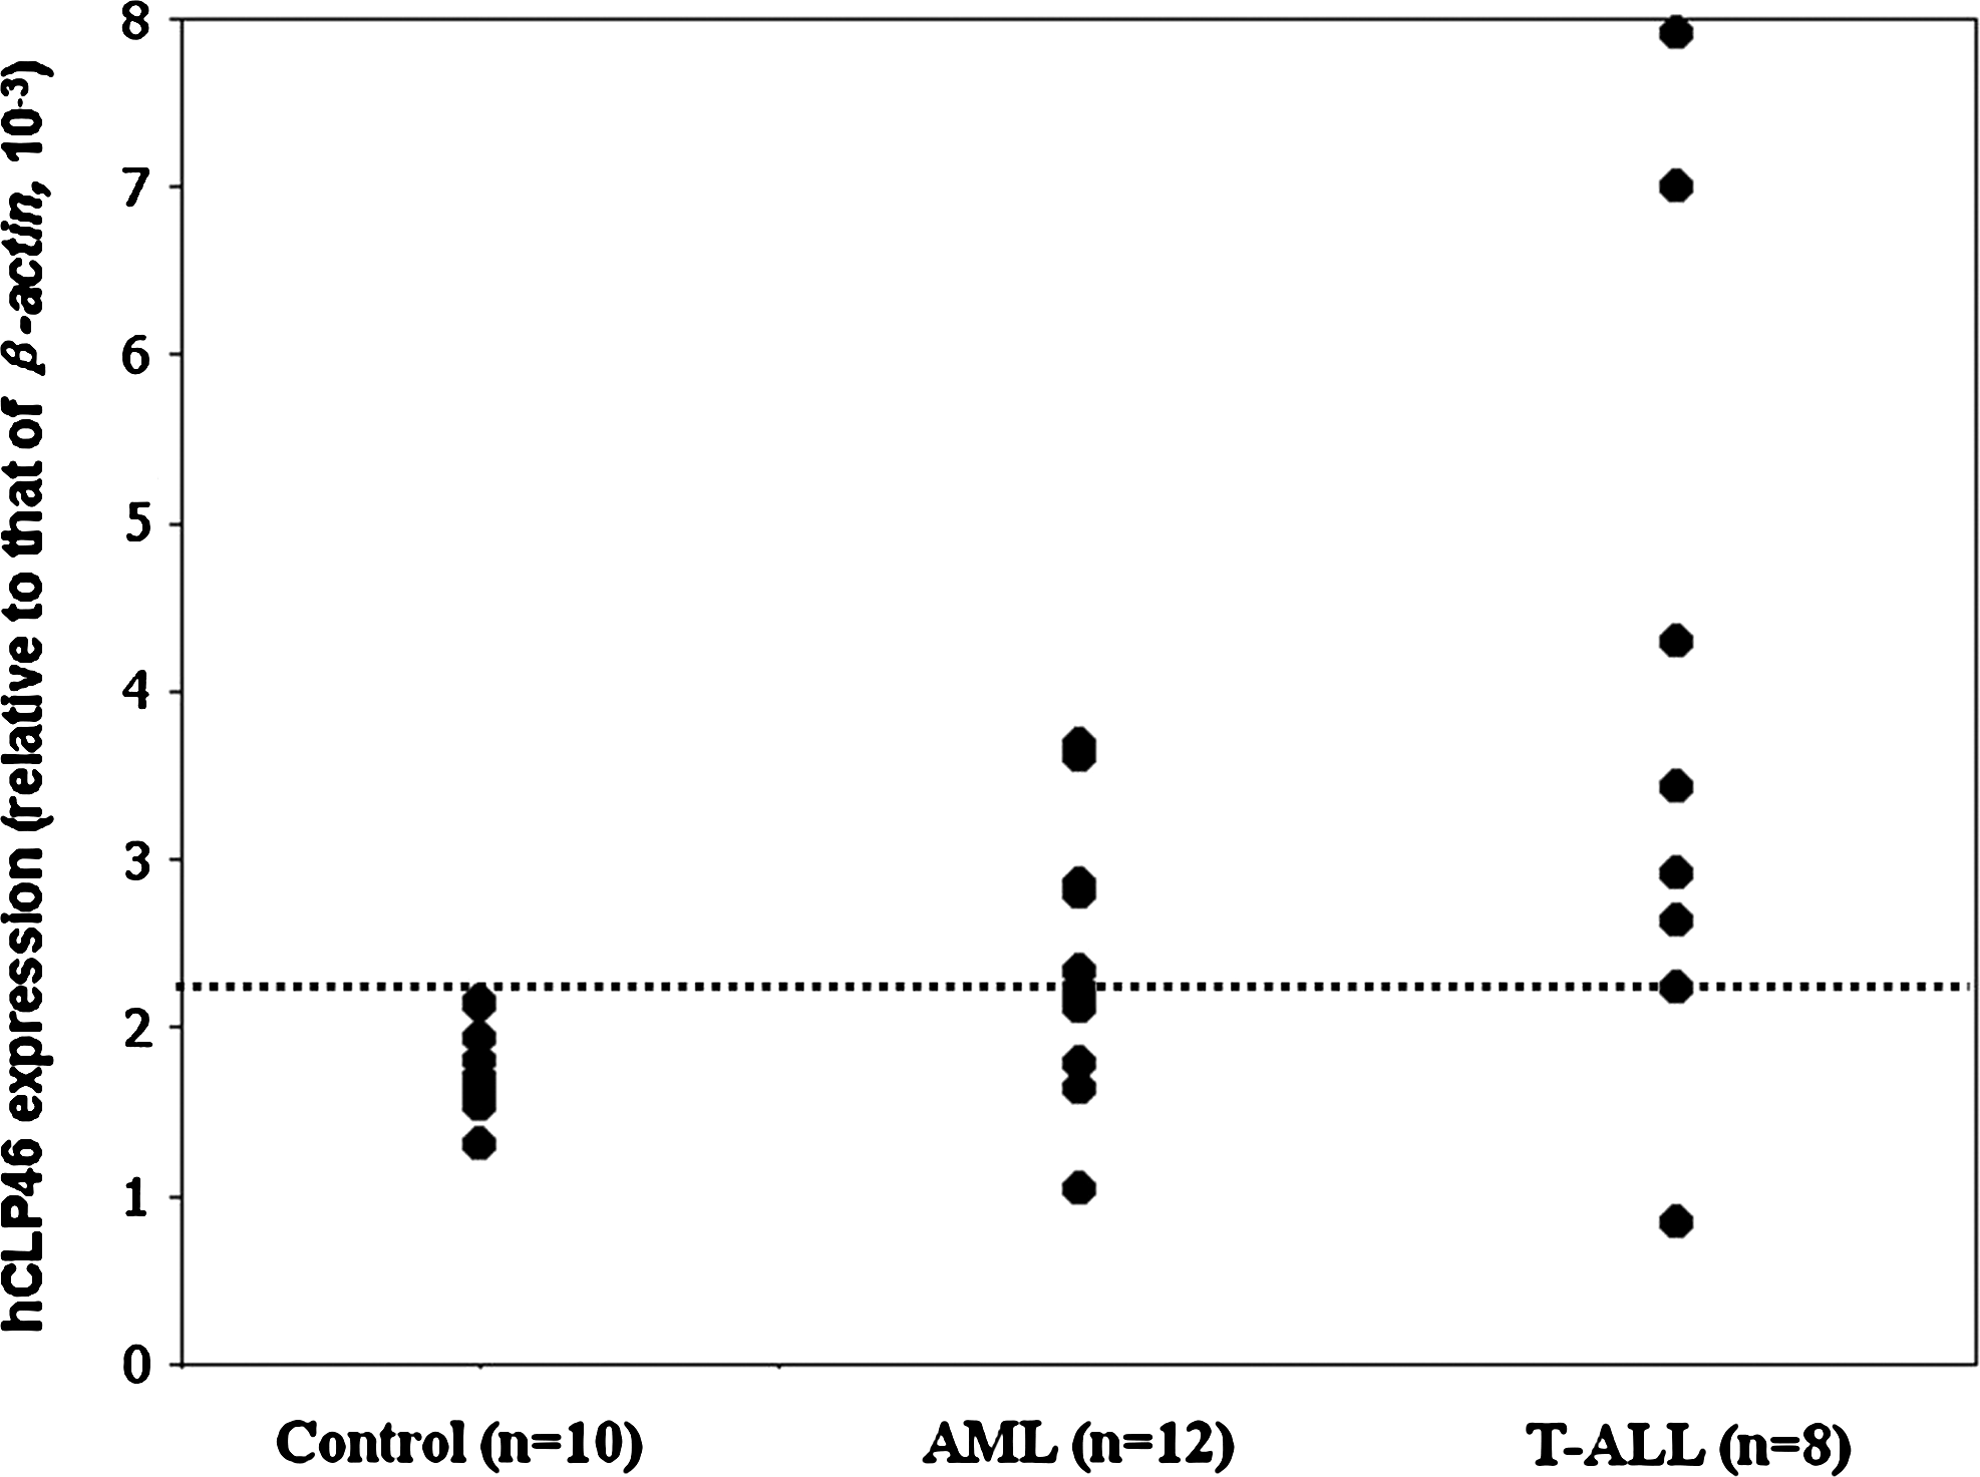
mRNA expression of hCLP46 in AML, T-ALL, and the control employing quantitative real-time PCR method. The expression levels shown were normalized to housekeeping transcript β-actin. The mean expression level of the control group plus two SD (threshold for overexpression) is indicated by a dotted line. AML, acute myelogenous leukemia; hCLP46, human CAP10-like protein 46 KD; PCR, polymerase chain reaction; SD, standard deviation; T-ALL, T-acute lymphoblastic leukemia.

mRNA expression of hCLP46 in six cell lines and the control measured by quantitative real-time PCR method. The expression levels shown were normalized to housekeeping transcript β-actin. Mean ± SD (n = 3). Statistical significance was determined by Dunnett's test:. *p < 0.01, statistically significant difference compared with the control.
hCLP46 did not alter expression of CDKN2A and CDKN2B
Downregulated hCLP46 expression in U937 cells was achieved by transfection with pGPU6/GFP/Neo-siRNA6 expression vector (U937 cells transfected with empty pGPU6/GFP/Neo-siRNA expression vector as a control). After transfection by pGPU6/GFP/Neo-siRNA6 expression vector, hCLP46 expression decreased significantly to 5% of control (Fig. 3, p < 0.01).
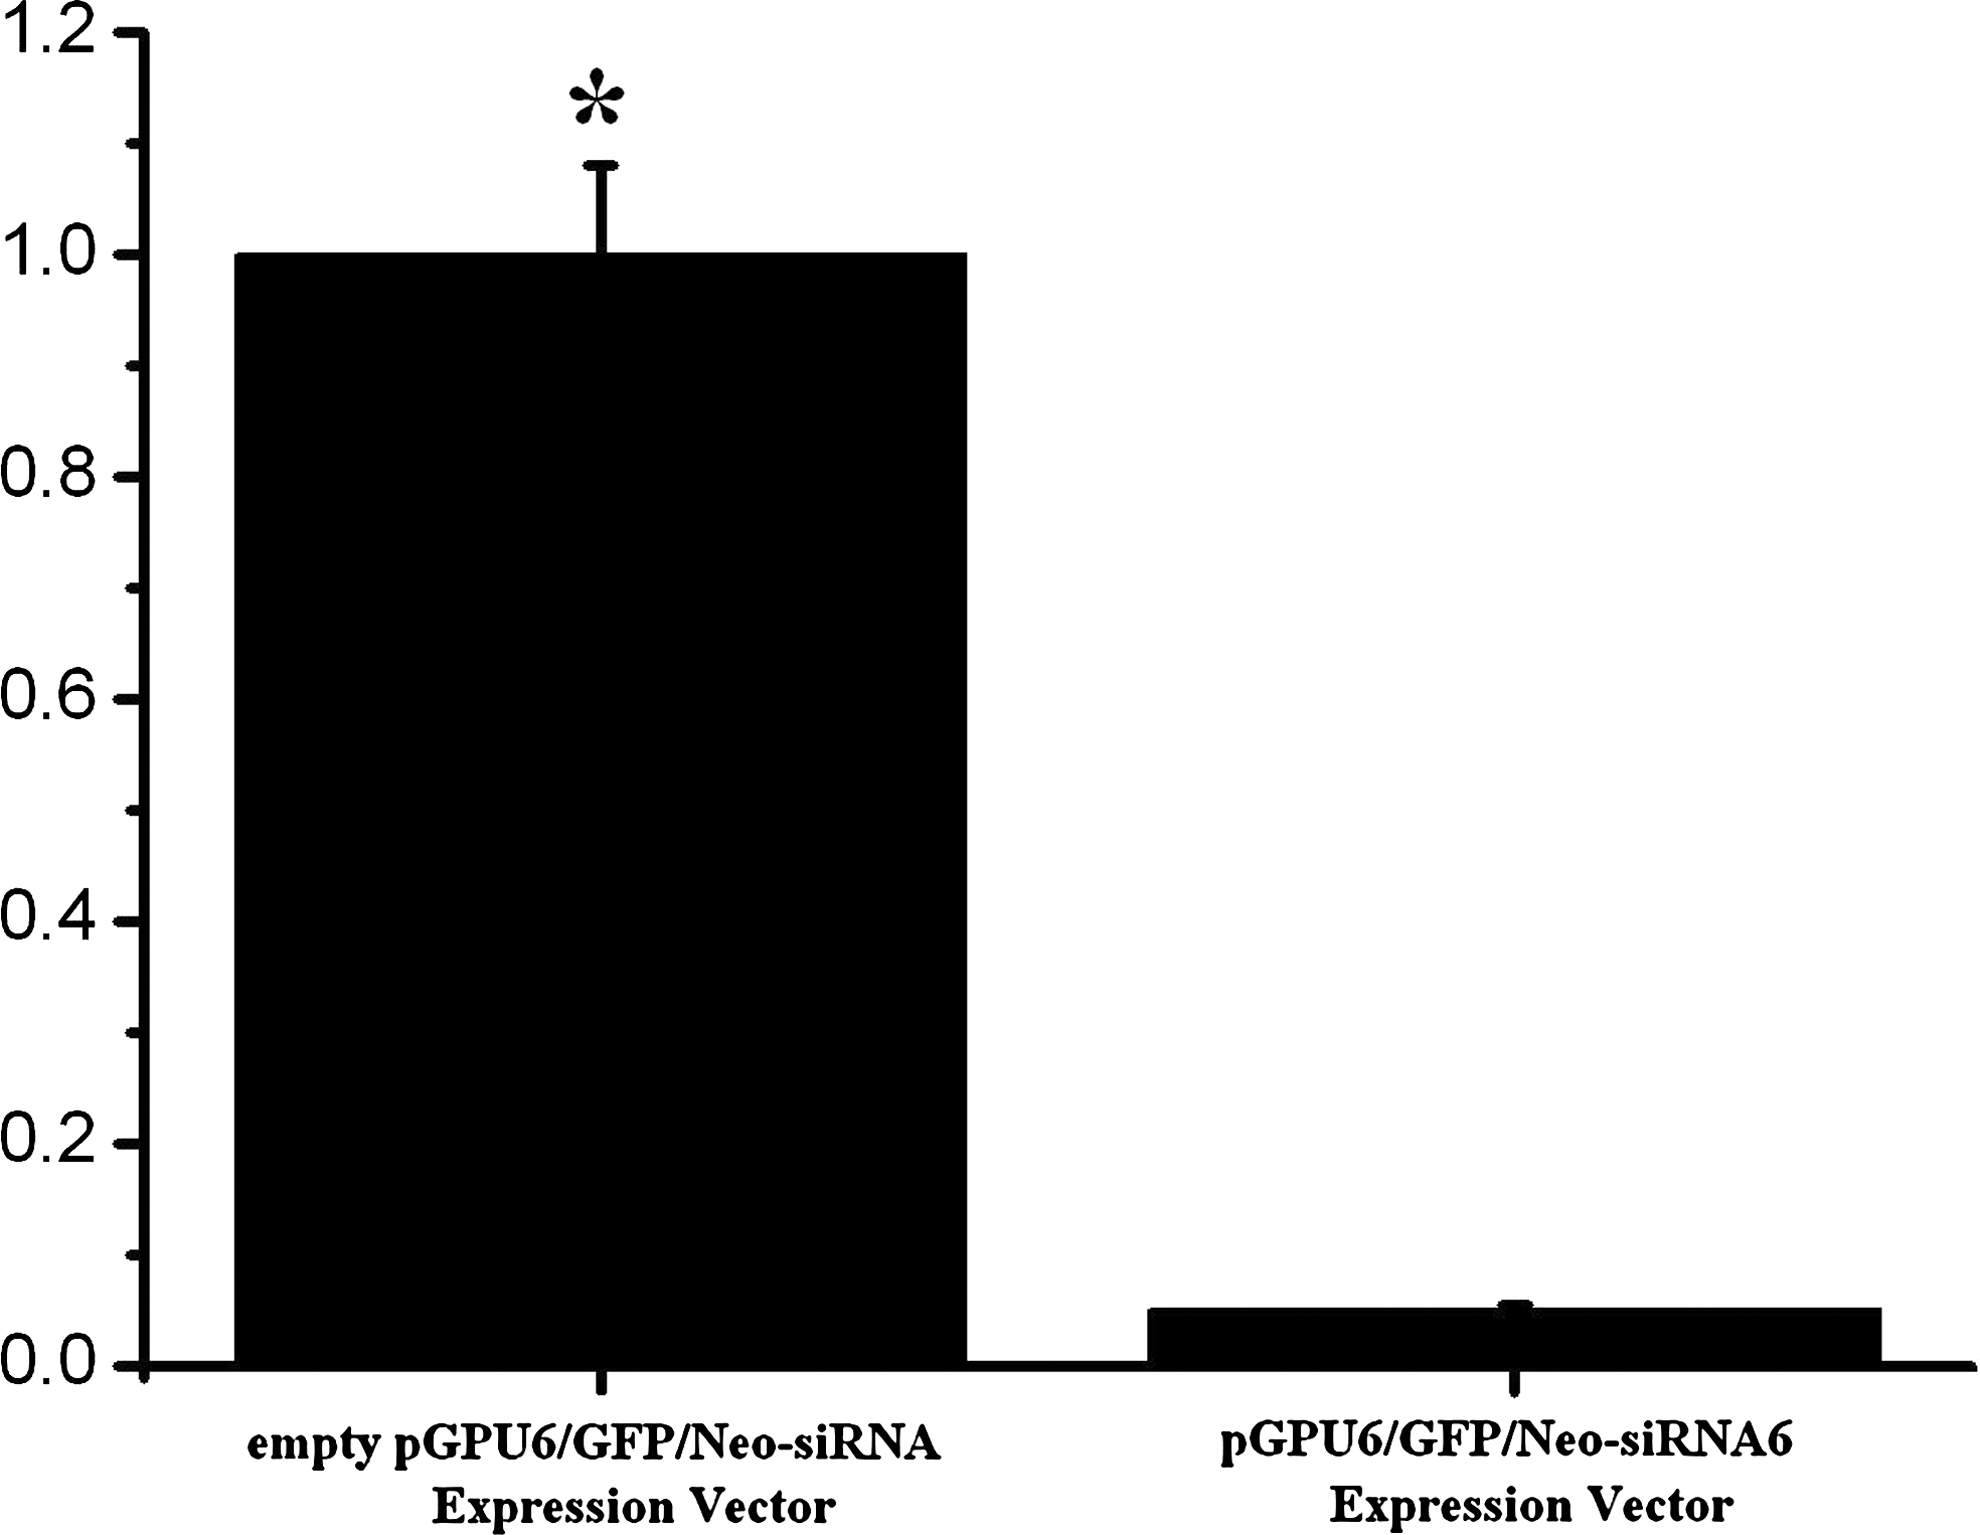
hCLP46 expression alteration in U937 cells after transfection with pGPU6/GFP/Neo-siRNA6 expression vector. Expression of hCLP46 in U937 cells was measured by quantitative real-time PCR methodology. The expression levels shown were normalized to housekeeping transcript β-actin. Mean ± SD (n = 3). Statistical significance was determined by two-way Student's t-test: *p < 0.01, statistically significant difference compared with the control (transfected with empty vector).
The expression patterns of CDKN2A and CDKN2B in U937 cells were determined using real-time PCR technique and western blot when hCLP46 was downregulated. The results of both real-time PCR and western blots showed that expression of CDKN2A and CDKN2B in U937 cells did not alter when hCLP46 was downregulated (Fig. 4).
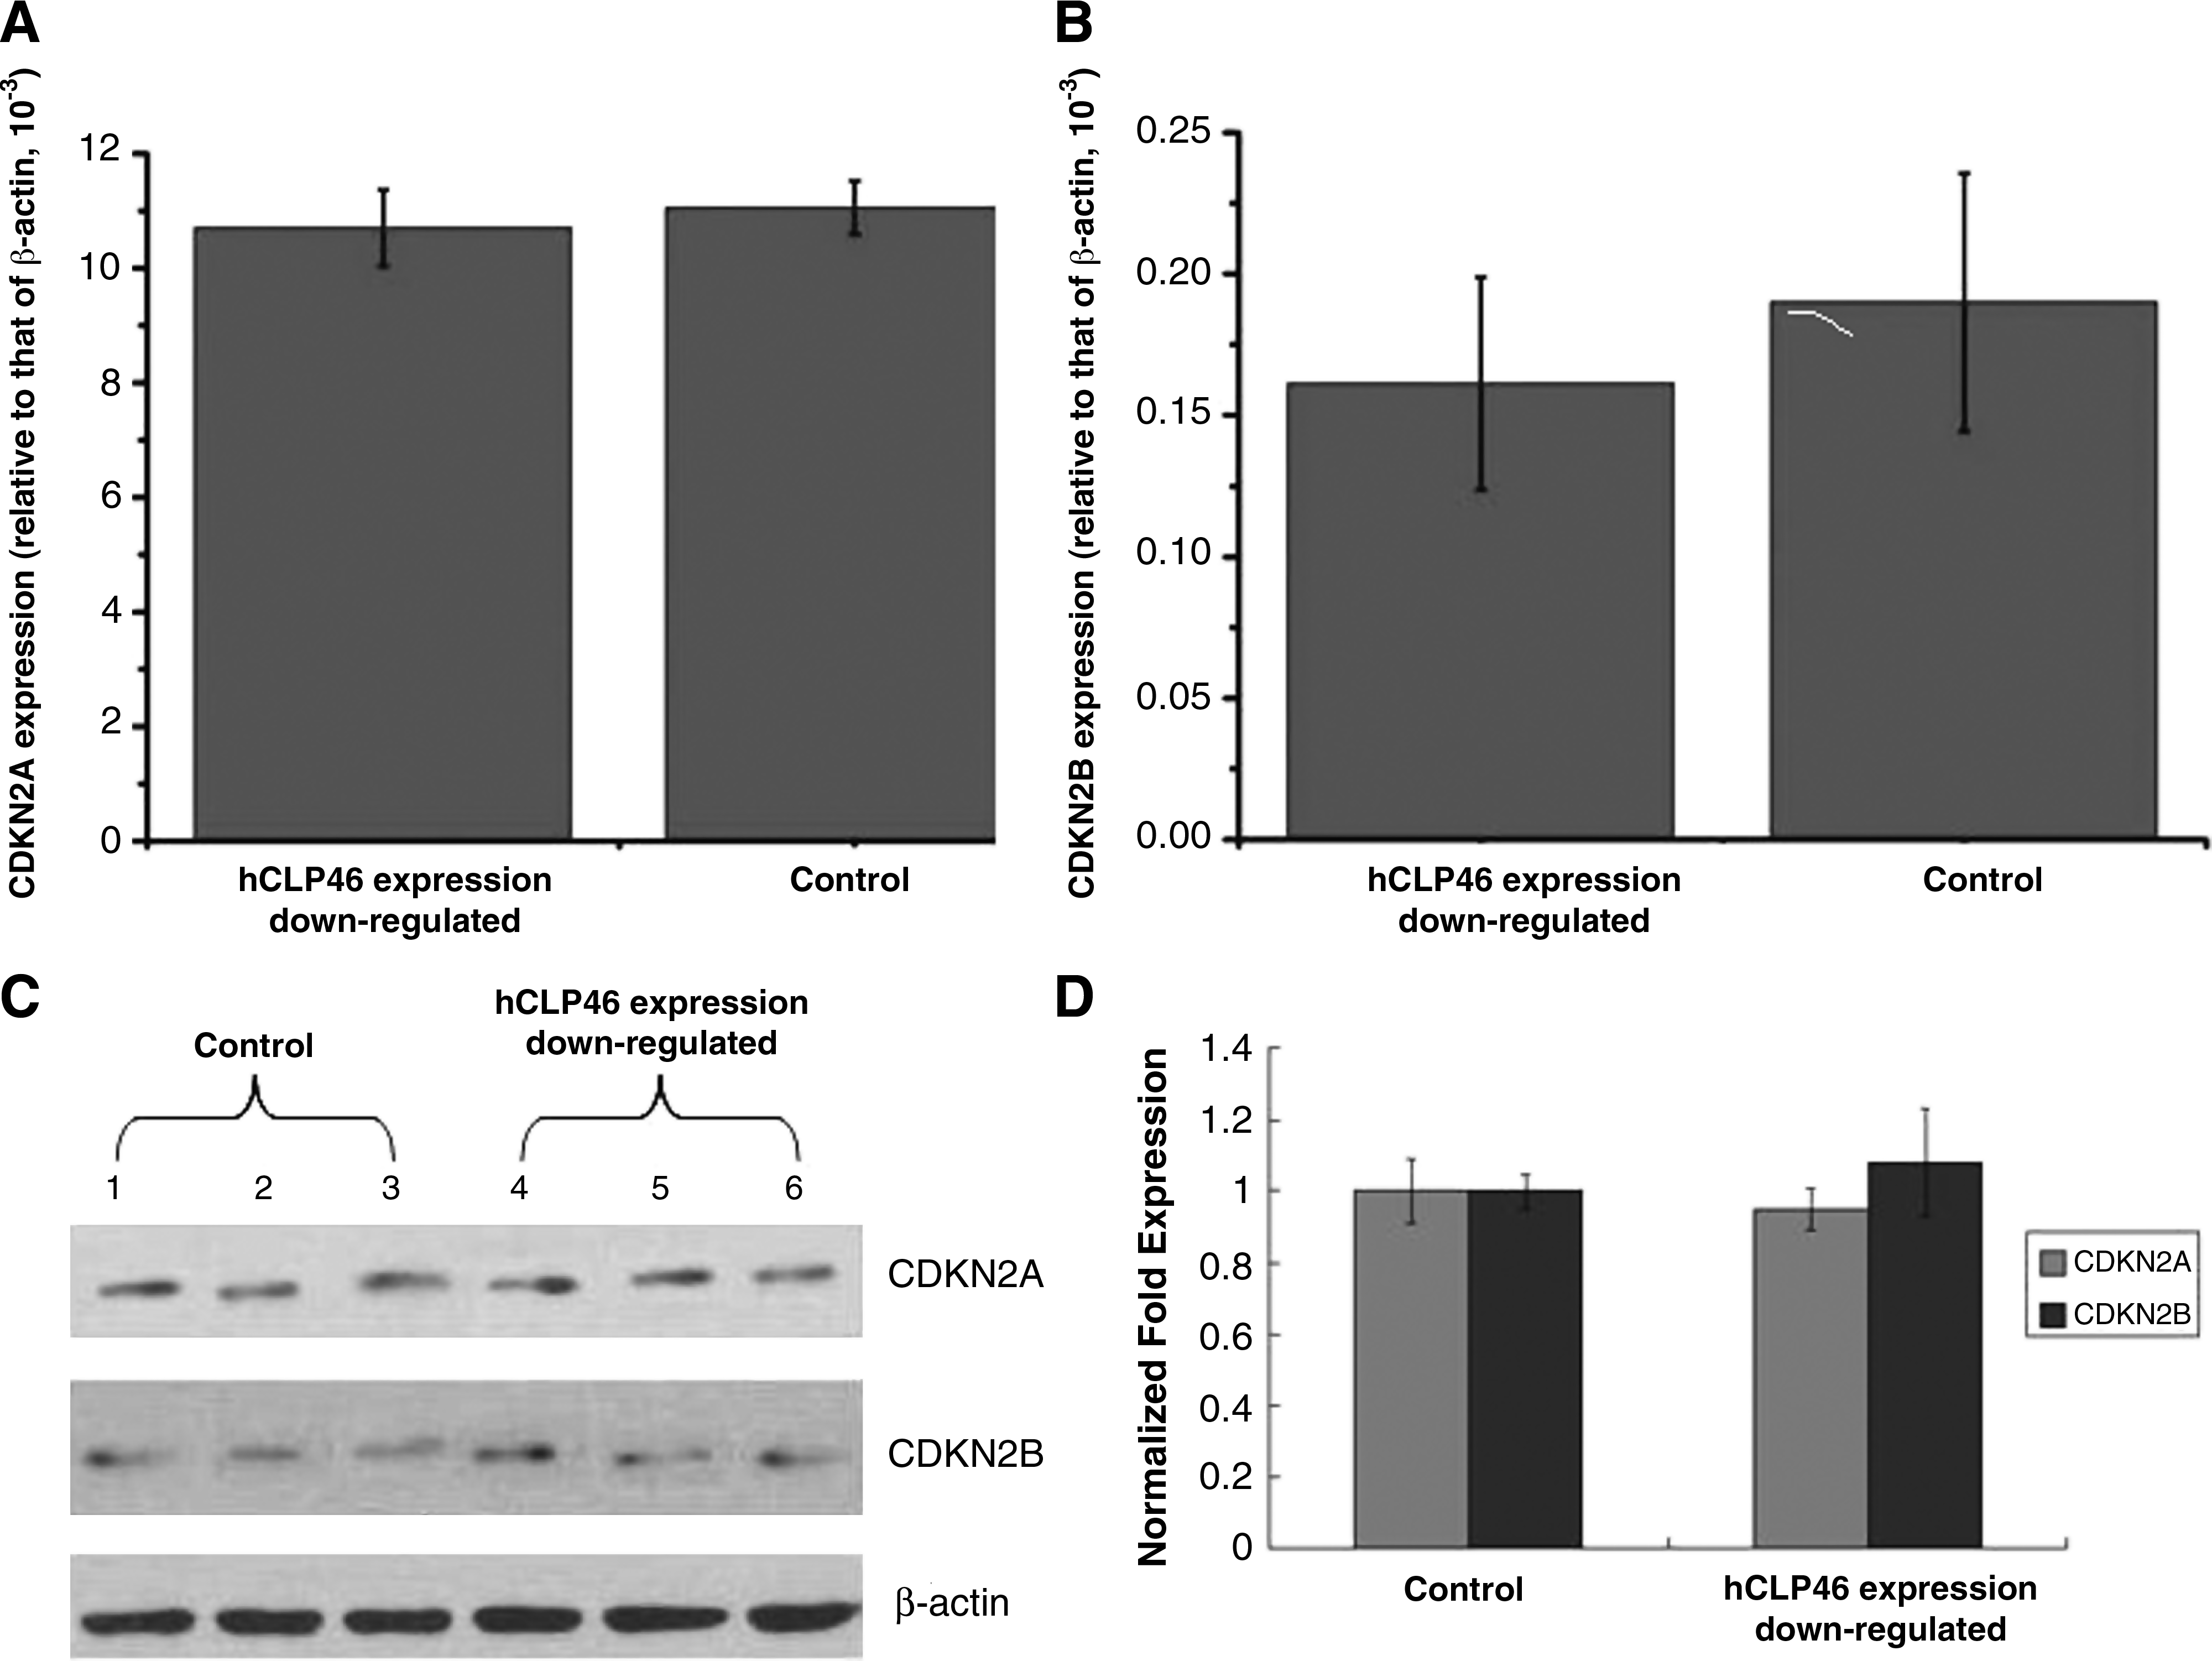
Expression of CDKN2A and CDKN2B in U937 cells when hCLP46 is downregulated. (
hCLP46 did not influence cell apoptosis
To determine the possible influence of hCLP46 on cell apoptosis, the apoptosis of U937 cells treated with pGPU6/GFP/Neo-siRNA6 expression vector was analyzed by fluorescence-activated cell sorting. Figure 5 shows that no alteration of apoptosis occurred when hCLP46 expression was downregulated (p > 0.05).

Apoptosis of U937 cells when hCLP46 expression was downregulated. Apoptosis was measured by annexin-V and propidium iodide (PI) double staining. The 1st fluorescence-fluorescein isothiocyanate (FL1-FITC) axis denotes annexin-V, while the FL3-PI axis denotes PI. The difference of apoptotic rate between hCLP46 downregulated group and control was not statistically significant (p > 0.05).
Discussion
We have developed a real-time PCR-based assay for the quantification of hCLP46. Our study demonstrated that hCLP46 was overexpressed in AML, T-ALL, and leukemic cell lines and that downregulation of its overexpression affected neither expression of CDKN2A and CDKN2B nor the apoptosis in U937 cells. The abnormal overexpression of hCLP46 in AML, T-ALL, and leukemic cell lines is consistent with the suggestion that hCLP46 possesses the ability of promoting cell proliferation (Teng et al., 2006) and that it might contribute to the abnormal proliferation of leukemia cells.
CDKN2A (p16) and CDKN2B (p15) have roughly equivalent capacities of binding CDK4 and CDK6 and inhibit cellular proliferation by preventing entry into the S phase of the cell cycle (Serrano and Hannon, 1993; Nobori et al., 1994). This study demonstrated that downregulation of hCLP46 had no effect on expression of CDKN2A and CDKN2B and suggested that hCLP46 might function through a pathway not involving CDKN2A and CDKN2B.
Our studies showed that overexpression of hCLP46 was associated with AML and T-ALL, but the real function of hCLP46 remained unclear until one of its homologs (Rumi) was recently mapped in D. melanogaster (Acar et al., 2008). hCLP46 has similar sequence, identical structure, and subcellular location to Rumi, suggesting that hCLP46 might have similar activity as Rumi, responsible for adding glucose to serine residues in Notch EGF repeats.
The Notch pathway is an evolutionarily conserved mechanism that plays a fundamental role in regulating cell-fate decisions of various types of progenitors in both vertebrates and invertebrates (Greenwald 1998; Artavanis-Tsakonas et al., 1999). Numerous cellular functions and microenvironmental cues associated with tumorigenesis are regulated by Notch signaling, including proliferation, apoptosis, adhesion, epithelial-tomesenchymal transition, and angiogenesis (Leong and Karsan, 2006). It is well known that Notch signaling plays an important role in hematopoiesis (Milner and Bigas, 1999). Notch signaling is involved in the maintenance of a pool of self-renewing hematopoietic stem cells (HSCs), is active in HSCs in vivo, and is downregulated as HSCs differentiate (Duncan et al., 2005). Considering its important role in normal hematopoiesis, Notch signaling must be precisely regulated, as dysregulation of Notch signaling can lead to the development of hematological malignancies. In humans, aberrant NOTCH1 expression is identified as a causative factor in the development of T-ALL. The t (7; 9) translocation can constitutively activate Notch, thus leading to leukemia (Ellisen et al., 1991). Activating mutations in NOTCH1 have been observed among more than 50% of human T-ALL patients (Lee et al., 2005). Activating mutations in NOTCH1 are mostly restricted to T-ALL and are rare in AML (Palomero et al., 2006), and both NOTCH1 and Jagged1 (the ligands of Notch) are overexpressed in AML (Tohda and Nara, 2001; Chiaramonte et al., 2005).
Besides the aberrant expression and activated mutations of NOTCH1, the disorders of posttranslational regulation, involving proteolytic processing, glycosylation, ubiquitination, and endocytic trafficking, could destroy the function of Notch. Both the Notch receptors and ligands are single-pass transmembrane proteins with multiple tandem EGF-like repeats required for ligand binding (Rebay et al., 1991; de Celis et al., 1993; Weinmaster, 1997). N-linked glycosylation is common in extracellular protein, but Notch is subject to two unusual types of O-linked glycosylation, O-glucosylation, and O-fucosylation (Moloney et al., 2000). O-fucosylation is catalyzed by O-fucosyltransferase 1 (Ofut1), which is also an ER protein (Haines and Irvine, 2003). O-fucosylation is essential for Notch function in many contexts (Stanley, 2007), and recently Zhou et al. (2008) reported that Notch O-fucosylation plays an important role in the suppression of myelogenesis, that is, unsweetened Notch leads to myeloproliferation (Haltiwanger, 2008). O-glucosylation of Notch is catalyzed by hCLP46; however, the function of Notch O-glucosylation remains unclear. Our studies demonstrated that overexpression of hCLP46 is associated with AML and T-ALL, possibly implying that excessive O-glucosylation of Notch leads to myeloproliferation or cell fate decision. Given that both AML and T-ALL are usually considered to be disorders of HSC origin (Lapidot et al., 1994; Bonnet and Dick, 1997; Cobaleda et al., 2000; Matsuoka et al., 2008), it is likely that overexpression of hCLP46 might be one of the early events in the pathogenesis of AML and T-ALL.
In summary, we demonstrated that hCLP46, a gene possessing capability of modifying the Notch pathway, was overexpressed in AML and T-ALL. This finding extends the notion of Notch pathway in hematopoiesis and suggests that overexpression of hCLP46 might be an early event in the pathogenesis of AML and T-ALL. In addition, hCLP46 might turn out to be a useful biomarker for selected leukemias.
Footnotes
Acknowledgments
The authors thank Dr. Gilbert Shia for the language editing of this manuscript. The project was financially supported by Beijing Municipal Natural Science Foundation (5072007 and KZ200610025014), National Natural Science Foundation of China (30771193, 30670889, and 30600690), Doctoral Program of Higher Education of China (20050025002), Major State Basic Research Program-973 of China (2005CB522804), and National High Technology Research and Development Program-863 of China (2006AA02Z434).
Disclosure Statement
We declare that we have no conflict of interest.