




Abstract
Background: Polymorphisms in HSD11B1, the gene encoding 11β-hydroxysteroid dehydrogenase type 1 enzyme, have been associated with obesity, metabolic syndrome, and type 2 diabetes. In this study, we present an optimized high-resolution melting (HRM) method for genotyping two common polymorphisms of the HSD11B1 gene: rs846910: G>A and rs45487298: insA. Methods: One hundred DNA samples from patients with polycystic ovary syndrome and healthy controls were genotyped by HRM. The results were compared with those obtained with classic polymerase chain reaction followed by restriction fragment length polymorphism analysis. Results: Various approaches were used during HRM specificity optimization. With the optimized method, genotyping accuracy of 100% was achieved. Conclusions: HRM analysis is a fast, simple, and cost-effective method compared with the alternative genotyping approaches. The work required for optimizing the method (improvement of specificity) is minor compared to the advantages.
Introduction
High-resolution melting (HRM) curve analysis is a new method for fast genotyping and mutation scanning of disease-related genes (Wittwer, 2009). It is a closed-tube, post-polymerase chain reaction (PCR) technique based on thermodynamic differences between DNA fragments. HRM is enabled by use of novel saturation dyes and high-resolution instruments (Wittwer et al., 2003; Herrmann et al., 2006; Reed et al., 2007). The target sequence is amplified by PCR in the presence of a saturating fluorescent dye. Melting curve analysis is then performed in the same tube or plate without any extra post-PCR sample manipulation. The melting behavior of PCR products is monitored by plotting the changes in fluorescence that occur by dissociation of double-stranded DNA upon heating. These melting profiles depend on GC content, length, sequence, and heterozygosity of PCR products. Heterozygous DNA samples form heteroduplexes and show significantly different shapes of melting curve compared with homozygous samples. Mutant homozygous samples are detected by a melting temperature (Tm) shift compared with wild-type samples (Wittwer et al., 2003; Herrmann et al., 2006; Montgomery et al., 2007; Reed et al., 2007).
Detection of homozygous variants is a potential weak point of HRM. Differences for some variants (e.g., A-T to T-A changes) are subtle and can be easily missed (Vossen et al., 2009). There are different approaches to addressing this problem. One is the use of unlabeled probes. These are small oligonucleotides blocked at the 3′ end to prevent extension by DNA polymerase. They are designed to complement either the wild-type or the mutant sequence (Erali et al., 2008). Using optimized asymmetric PCR (asymmetric ratios of primers), a sufficient signal is produced for both amplicon and unlabeled probe melting (Erali et al., 2008). Homozygous variants can then be detected by analyzing additional melting peaks in the region under the probe (Reed et al., 2007; Erali et al., 2008).
Another approach is to spike all samples with a known amount of wild-type DNA. First, samples are melted to obtain a standard melting profile. Then a fixed amount (10%-20%) of the wild-type DNA is added, prior to PCR, to all unknown samples and a second melting curve is generated. Spiked homozygous mutants will form heteroduplexes and can be easily differentiated from wild-type samples. Heterozygotes can be detected from the standard melting curves without spiking (Vossen et al., 2009).
In this study, we present optimized HRM methods for genotyping two polymorphisms within the HSD11B1 gene (rs846910: G>A and rs45487298: insA). The genotyping accuracy (sensitivity and specificity) of the method was determined by comparing the results with the classic PCR and restriction fragment length polymorphism (RFLP) assay. Different approaches for discriminating the three genotypes are described and suggested as solutions of the challenges encountered during HRM genotyping. HRM analysis was performed on the LightCycler®480 Real-Time PCR System.
Materials and Methods
DNA samples
DNA samples were selected randomly from 100 patients with polycystic ovary syndrome (PCOS) and healthy subjects. PCOS patients (n = 64) were recruited according to the National Institutes of Child Health and Human Development criteria (Zawadski and Dunaif, 1992). Thirty-six healthy subjects without clinical or laboratory evidence of PCOS were included as controls. The study was conducted according to the Declaration of Helsinki and approved by the National Medical Ethics Committee. Subjects' written informed consents were obtained before entering the study. Genomic DNA was extracted from whole blood using Miller's protocol and diluted to 10 ng/μL.
Classic PCR and RFLP method
Polymorphism rs846910: G>A was genotyped using the following primers: F: 5′-TGCCACCTTCTAAATGACAGG-3′ and R: 5′-GAAAATTGCTGTCTTCCTGGAG-3′. PCR products (600 bp) were digested with HphI restriction enzyme at 37°C overnight. Restriction fragments were separated by 12% polyacrylamide gel electrophoresis.
Polymorphism rs45487298: insA was genotyped using the following primers: F: 5′-GACTGATGCCATTTCTGCTGTA-3′ and R: 5′-CAGAGAGGAGACGACAACAATG-3′. PCR products (447 bp) were digested with XcmI at 37°C overnight. Restriction fragments were analyzed by 2% agarose gel electrophoresis.
Primer design and PCR optimization for HRM analysis
Primers and unlabeled probes were designed using Primer 3 (v.0.4.0) software according to the guidelines recommended by the LightCycler 480 Real-Time PCR System manufacturer, Roche Diagnostics (Table 1). The absence of polymorphisms in the primers and the whole amplicon was verified with the Ensembl genomic sequence database. Unlabeled probes were designed to target major alleles following criteria by van der Stoep et al. (2009). Probes were blocked at their 3′ end by phosphate to prevent extension during PCR. Folding characteristics of primers, probes, and amplicons were checked using the DINAMelt Server (www.bioinfo.rpi.edu/applications/hybrid/twostate-fold.php) and the IDT web software (eu.idtdna.com/analyzer/Applications/OligoAnalyzer/Default.aspx). Primer specificity was evaluated using BLAST software (www.ncbi.nlm.nih.gov/BLAST) and the University of California Santa Cruz in silico PCR program (genome.csdb.cn/cgi-bin/hgPcr).
Asymmetric PCR was performed in a 10 μL reaction volume containing 1× LightCycler® 480 High Resolution Melting Master (Roche Diagnostics; with LightCycler® 480 ResoLight Dye) and 10 ng of genomic DNA. The reaction mixture for the rs846910: G>A polymorphism included 3.5 mM MgCl2, 0.15 μM forward primer, 0.5 μM reverse primer, and 0.75 μM unlabeled probe. For the rs45487298: insA polymorphism, the final concentrations were 3 mM MgCl2, 0.15 μM forward primer, 1.0 μM reverse primer, and 0.75 μM unlabeled probe.
PCR amplifications for both polymorphisms were performed in a 384-well plate in the LightCycler® 480 Real-Time PCR System under the same conditions. The PCR was initiated with a 10-min denaturation at 95°C. Thermal cycling (60 cycles) consisted of denaturation at 95°C for 10 s, then 10 s annealing with a touchdown protocol covering a range of annealing temperatures from 68°C to 58°C (decreasing 1°C per cycle), and elongation at 72°C for 10 s.
HRM acquisition and analysis
After amplification, PCR products were denatured at 95°C for 1 min and cooled (2.5°C/s) to 40°C to form heteroduplexes. HRM was performed by heating from 55°C to 90°C, with 25 acquisitions per 1°C.
The LightCycler® 480 Tm Calling Analysis software module was used to identify characteristic melting profiles of amplicons and amplicon-probe hybrids (Tm analysis). Further melting curve analysis was performed using the LightCycler® 480 Gene Scanning software version 1.5. Genotyping was based on normalized and temperature-shifted melting curves. Pre- and post-Tm ranges used for normalization were 78.8°C-79.8°C and 85.3°C-86.3°C for rs846910: G>A and 78.8°C-79.8°C and 83.4°C-84.4°C for rs45487298: insA. The temperature shift value was 5 for both analyses.
Samples with late amplification or distinguishable low fluorescence were excluded from the analysis because, in our experience, their melting profiles could be unreliable. Analysis of both polymorphisms was repeated for 10% of all samples.
Results
Genotyping of HSD11B1 gene rs846910: G>A and rs45487298: insA polymorphisms by PCR/RFLP analysis
All samples were previously genotyped for both HSD11B1 gene polymorphisms (rs846910: G>A and rs45487298: insA) by classic PCR/RFLP method (results of restrictions after gel electrophoresis are shown in Fig. 1 and Fig. 2). From 100 analyzed samples, there were 81 wild-type, 17 heterozygous, and 2 homozygous mutant samples for rs846910: G>A polymorphism. For rs45487298: insA polymorphism, 67 were classified as wild-type, 28 as heterozygous, and 5 as homozygous mutant-type samples.

PCR/restriction fragment length polymorphism analysis of rs846910: G>A polymorphism: Separation of restriction fragments by 12% polyacrylamide gel electrophoresis after digestion of PCR products (600 bp) with HphI enzyme. Wild-type allele is cleaved to 353 and 247 bp, whereas mutated allele yields 353-, 220-, and 27-bp fragments. 905, 837: Wild-type; GA, 909: heterozygous; 51, K8: homozygous mutant samples; NC: PCR product; M: molecular weight marker. PCR, polymerase chain reaction.
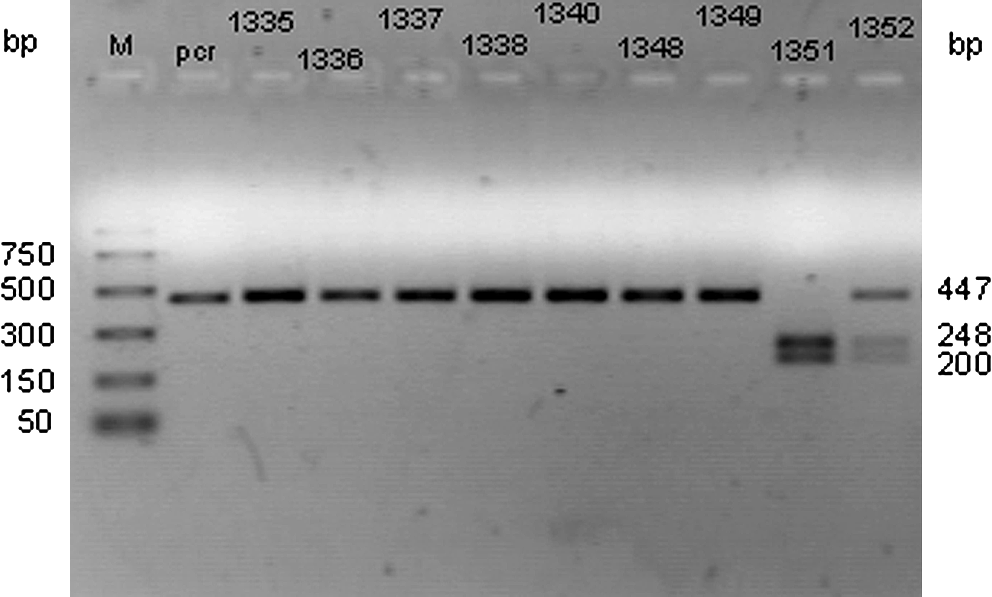
PCR/restriction fragment length polymorphism analysis of rs45487298: insA polymorphism: Separation of restriction fragments by 2% agarose gel electrophoresis after digestion of PCR products (447 bp) with XcmI enzyme. Mutated allele PCR product is cleaved to 248- and 200-bp fragments, whereas in the wild-type there is no cleavage. 1335, 1336, 1337, 1338, 1340, 1348, 1349: Wild-type; 1352: heterozygous; 1351: homozygous mutant sample; pcr: PCR product; M: molecular weight marker.
HRM genotyping of HSD11B1 gene rs846910: G>A polymorphism
Results of melting curve analysis by Gene Scanning software are presented in Figure 3. As the rs846910: G>A polymorphism is rare (with A allele frequency of 0.08), we had only two homozygous mutant samples in our experiment. Gene Scanning analysis differentiated these samples from wild-type and heterozygous ones. However, as can be seen from normalized and temperature-shifted difference plots, the software misclassified one heterozygous sample. Thus, grouping of heterozygotes was only 94% accurate (16 of 17 heterozygous samples).
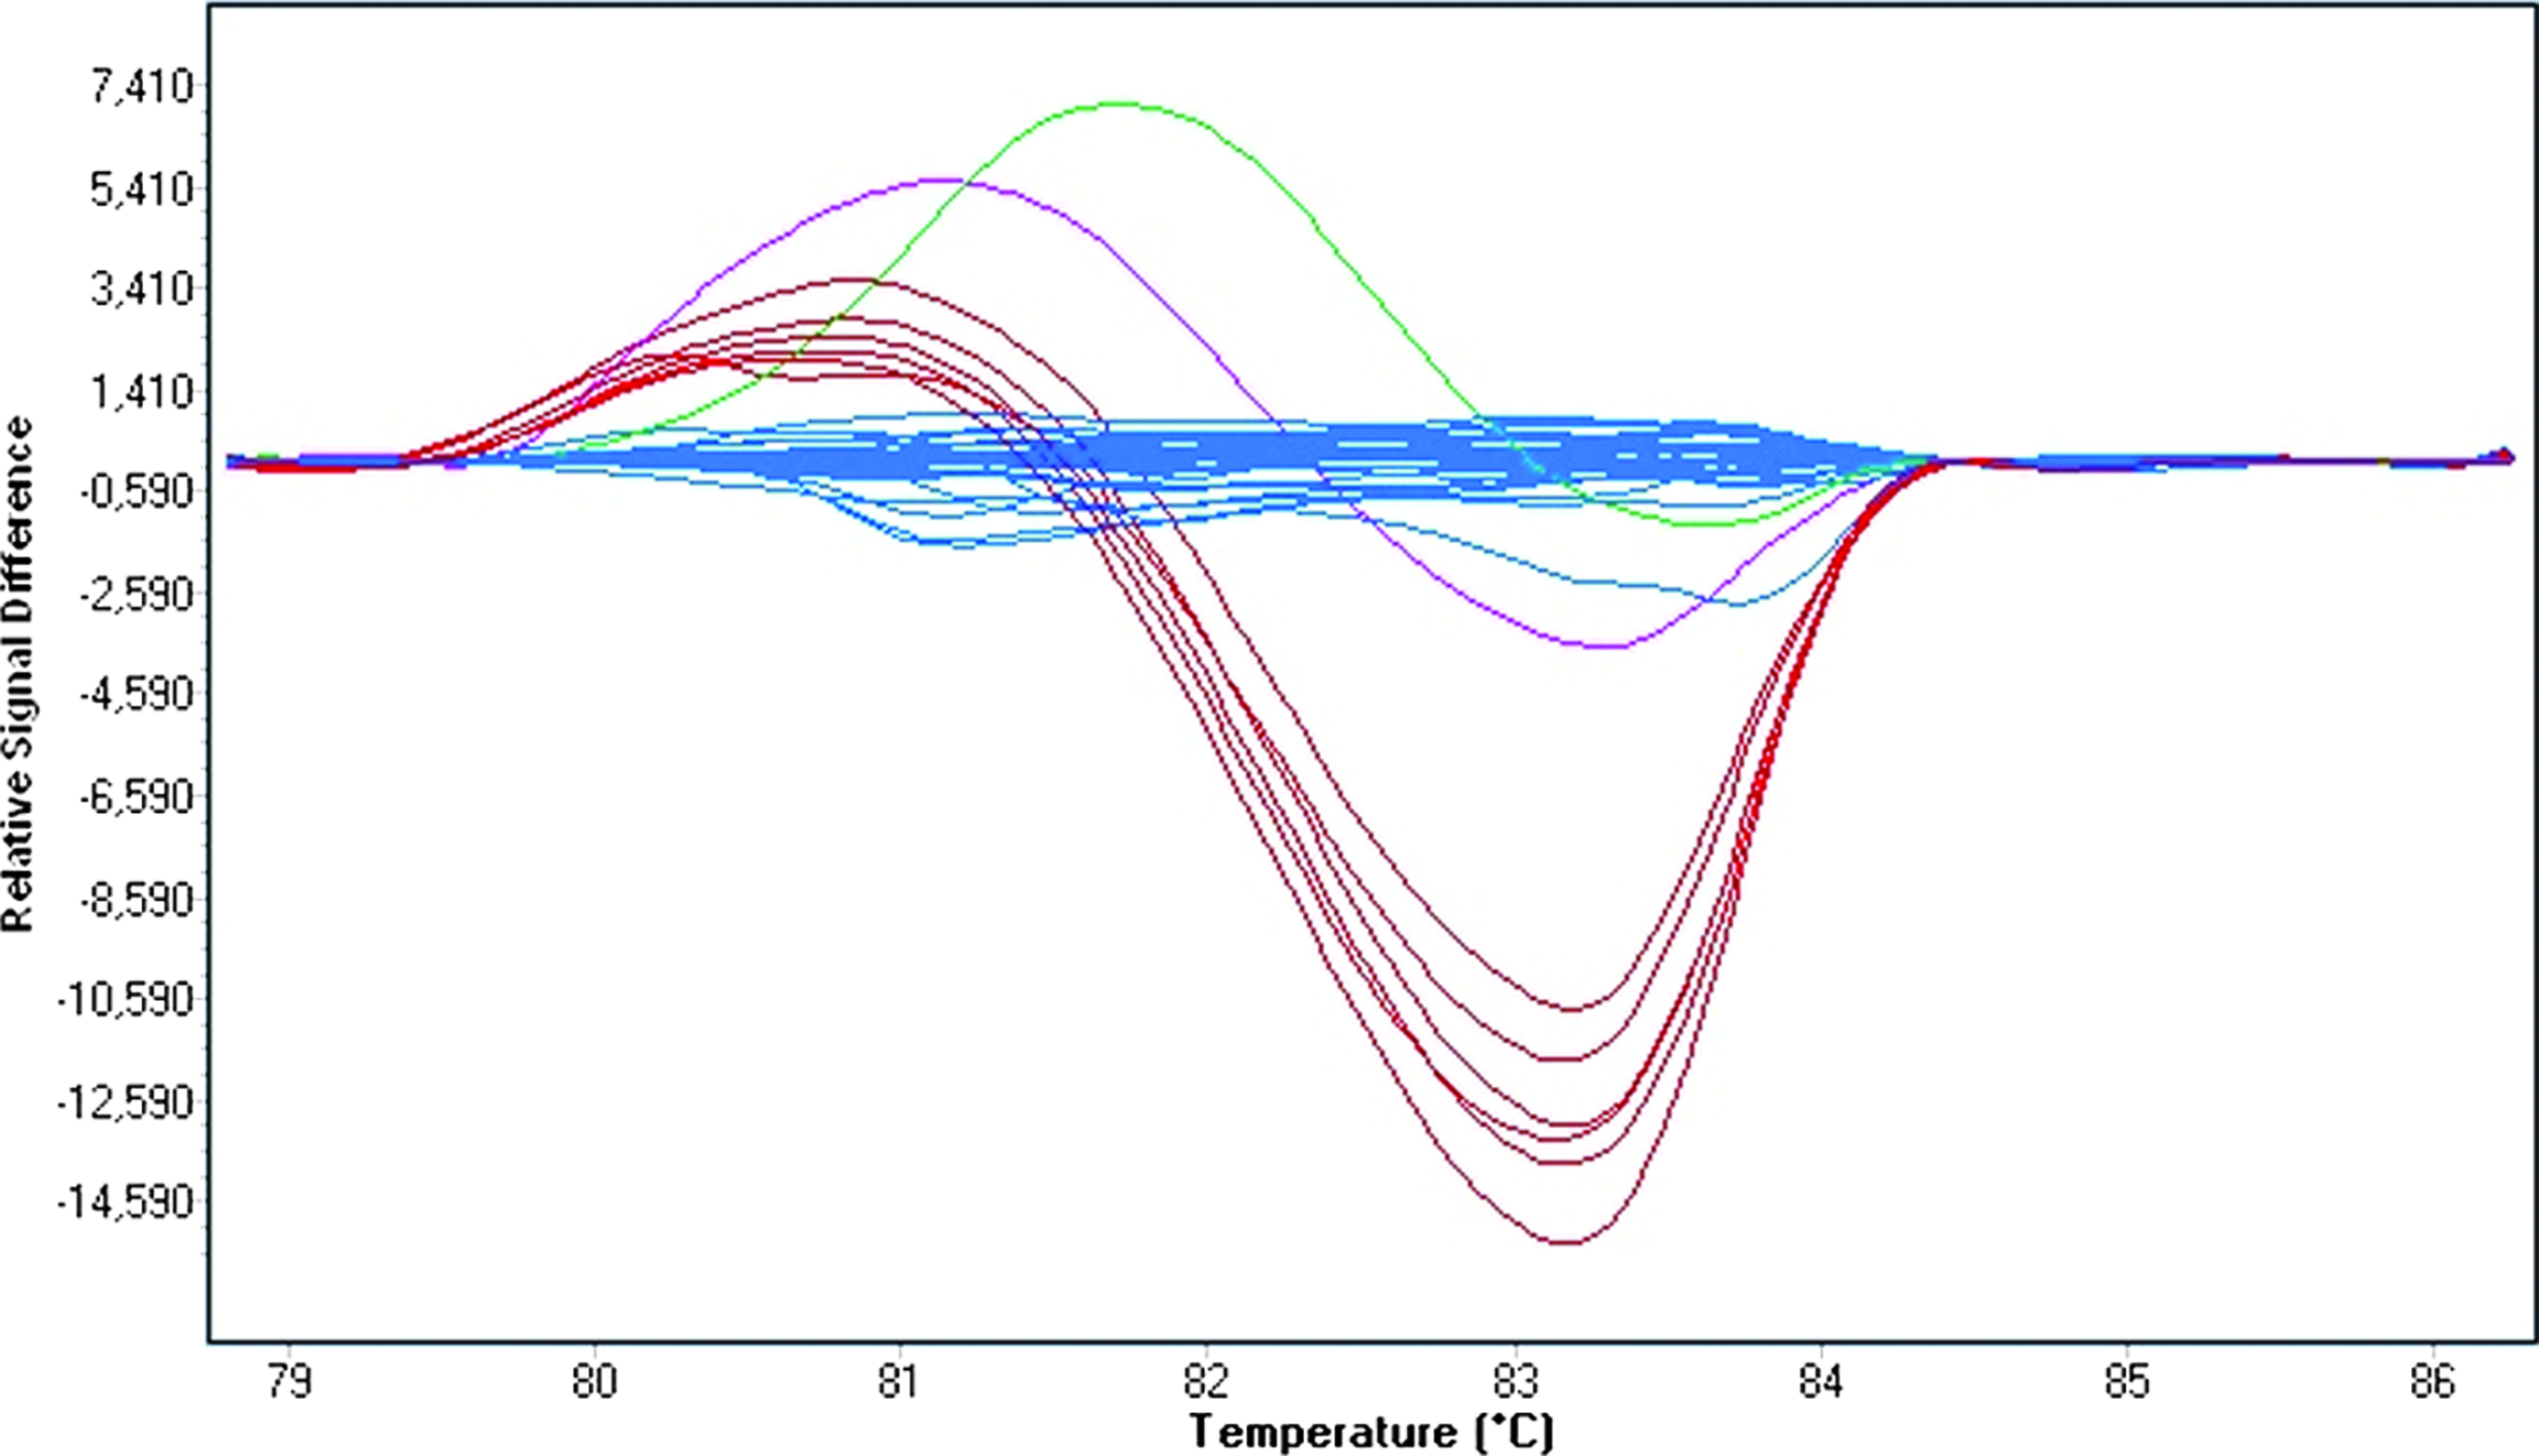
Normalized and temperature-shifted difference plots for the rs846910: G>A polymorphism genotyping (blue: wild-type; red: heterozygous; green: homozygous mutant samples; violet: misclassified heterozygous sample). Color images available online at www.liebertonline.com/gtmb.
Nevertheless, we were able to distinguish all three genotypes clearly from the shape of the amplicon melting peaks by Tm Calling Analysis (Fig. 4). All derivative amplicon melting curves showed a major peak between 83.8°C and 84.5°C. Derivative plots for heterozygotes showed an additional peak at 81.2°C. However, the wild-type and mutant homozygous samples each had a smaller, additional shoulder peak next to the major peak, at 82°C and 81.5°C, respectively. The shoulder peak did not result from unspecific PCR byproducts, because only one band was detected after 3% agarose gel electrophoresis of PCR products.
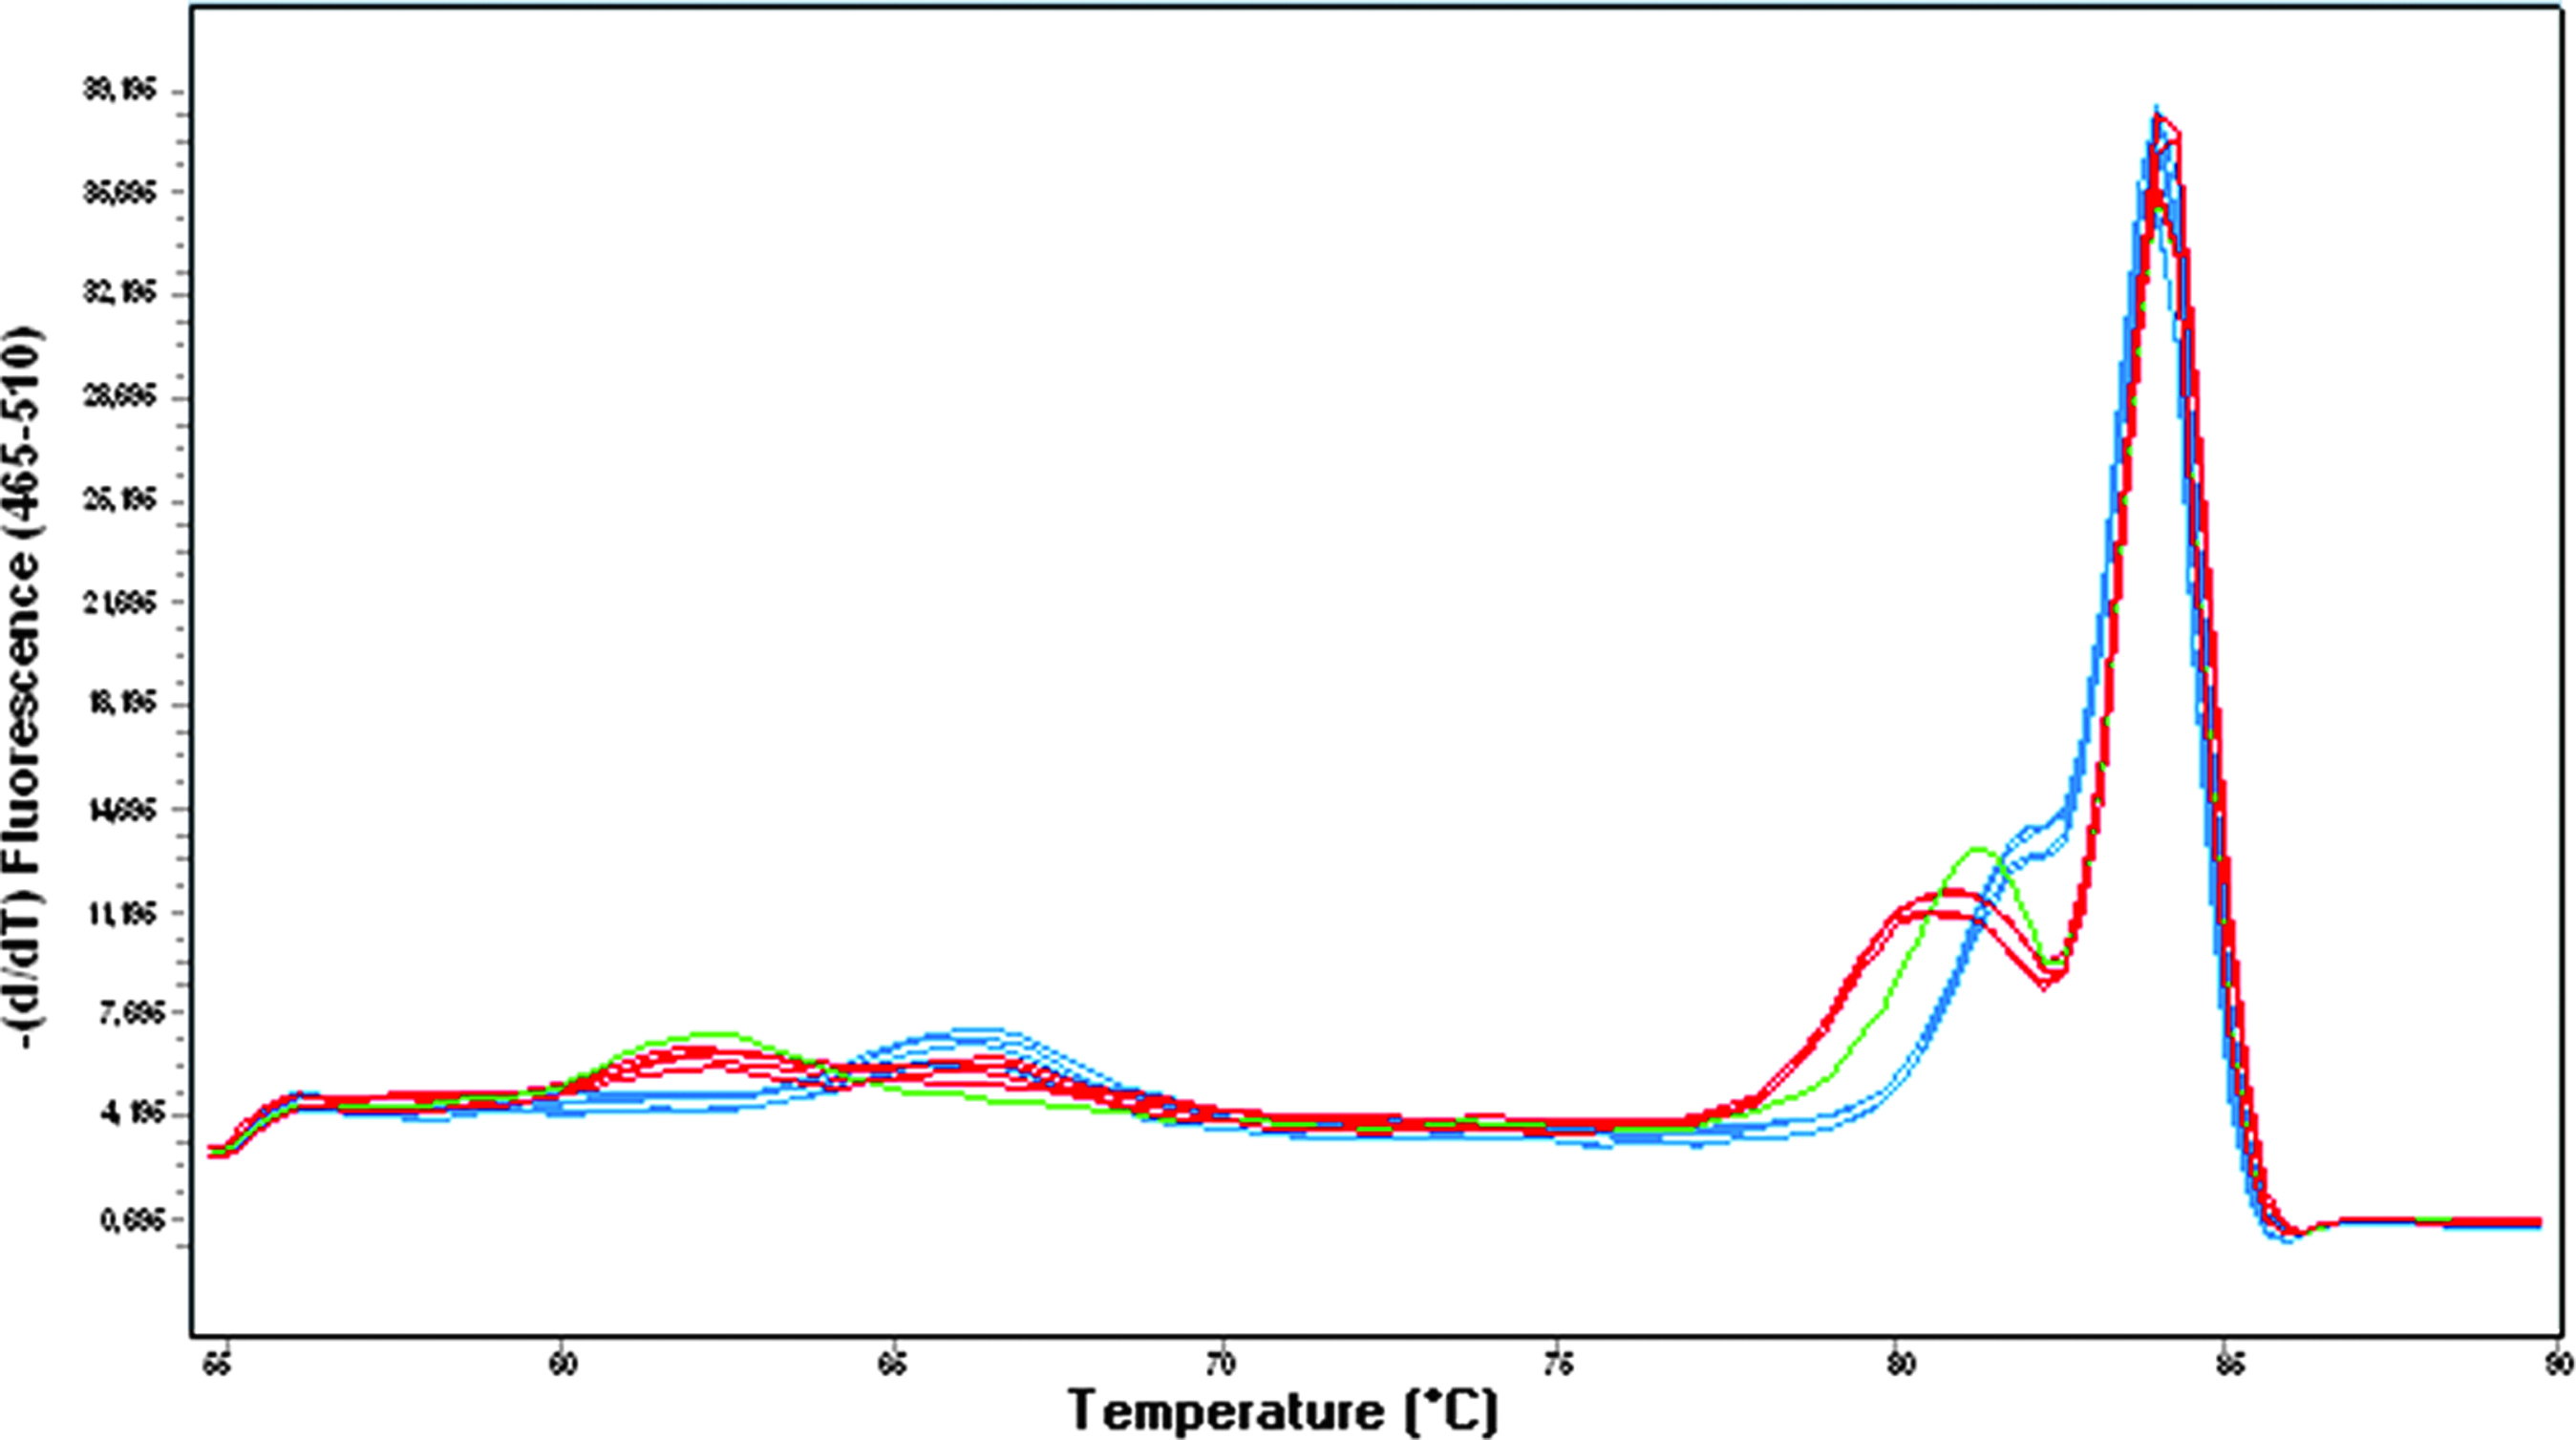
Derivative melting plots for the rs846910: G>A polymorphism genotyping: Combined unlabeled probe and amplicon melting analysis (blue: wild-type; red: heterozygous; green: homozygous mutant samples). Color images available online at www.liebertonline.com/gtmb.
Genotyping accuracy was confirmed by unlabeled probe assay. Each homozygous sample showed its own probe melting peak, whereas heterozygous samples had two peaks (at 62.5°C and 66.4°C), corresponding to the two alleles (Fig. 4).
HRM genotyping of HSD11B1 gene rs45487298: insA polymorphism
Gene Scanning analysis for the rs45487298: insA polymorphism discriminated heterozygous from homozygous samples with 100% accuracy (Fig. 5). However, wild-type and mutant homozygous samples could not be differentiated.
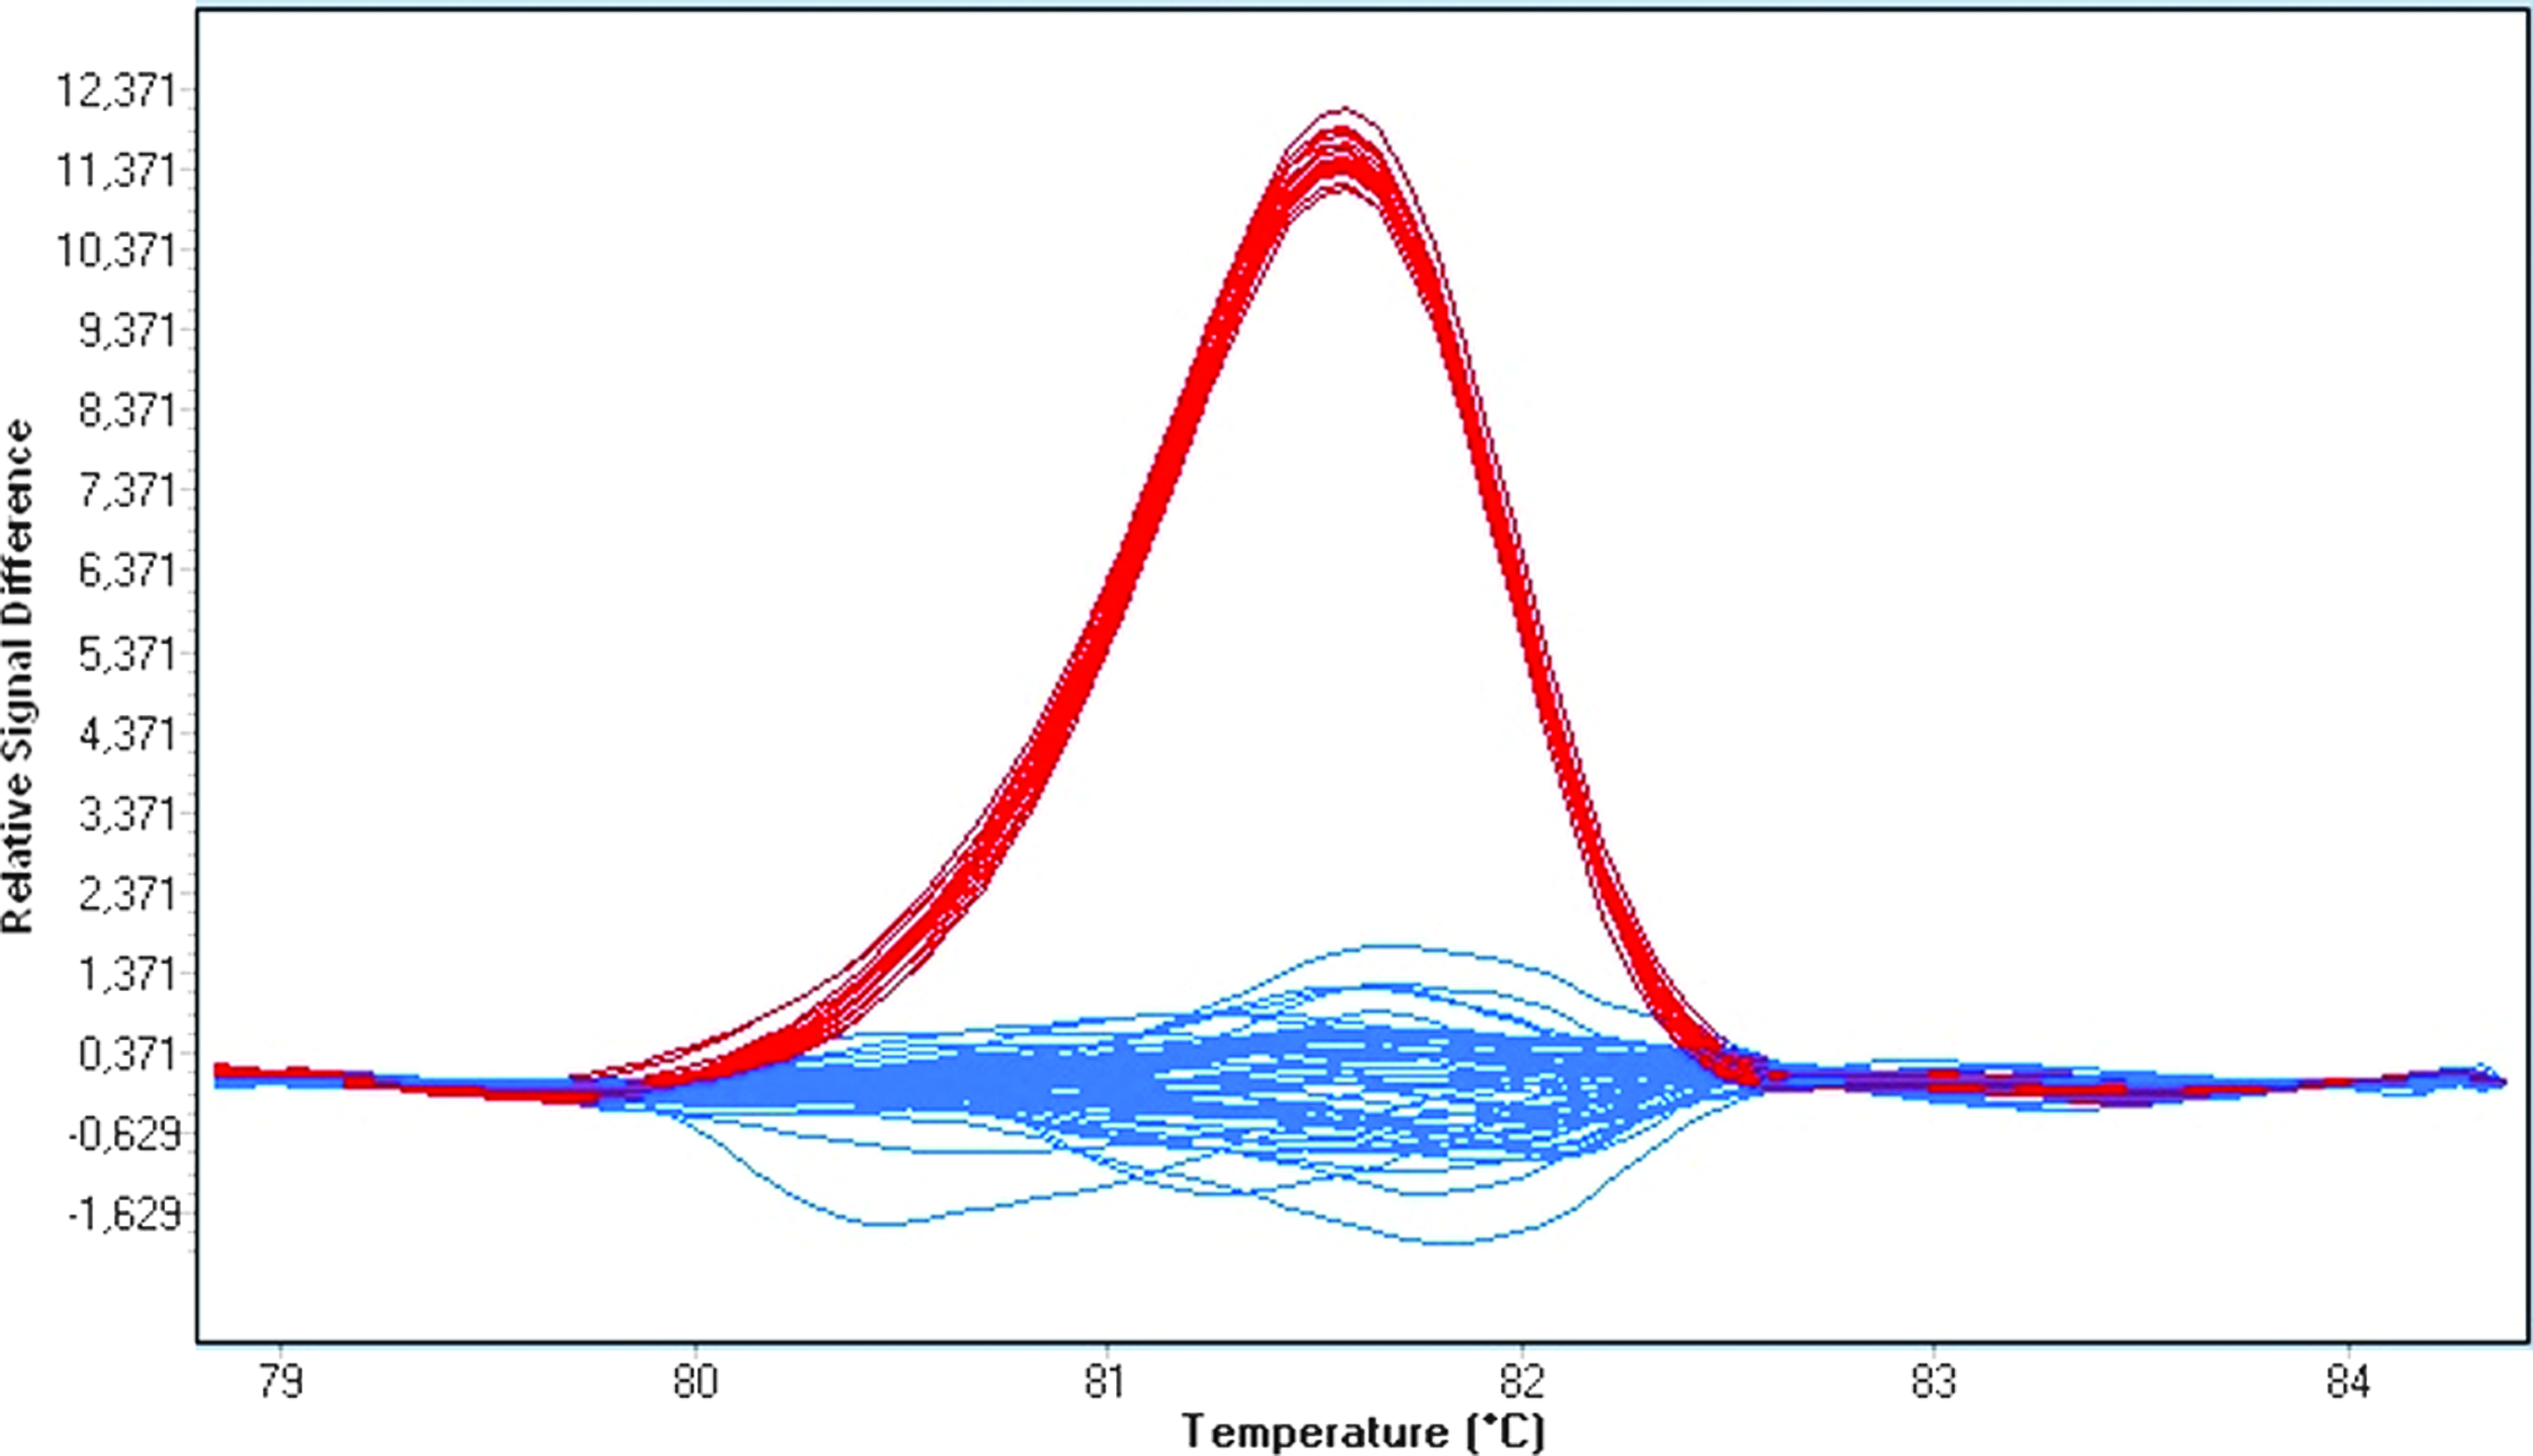
Normalized and temperature-shifted difference plots for the rs45487298: insA polymorphism genotyping before spiking: Heterozygous samples (red) were distinguished from wild-type and homozygous mutant samples (blue). Color images available online at www.liebertonline.com/gtmb.
As direct detection of homozygous variants is the exception rather than the rule in HRM analysis, this was expected, and we initially included an unlabeled probe in the assay. Yet the three genotypes still could not be clearly distinguished by probe melting analysis. The melting temperature difference between two probe melting peaks was only 2.9°C and heterozygous samples showed one broad instead of two separate peaks (data not shown).
Finally, to achieve accurate differentiation, after the experiment we spiked all samples, that is, PCR products, except heterozygous ones, with 20% of standard wild-type PCR products from the same plate. After additional HRM analysis, the three genotypes were readily distinguished from each other by normalized melting curves and difference plots (Fig. 6).

Normalized and temperature-shifted difference plots for the genotyping of rs45487298: insA after spiking with 20% of wild-type PCR product (blue: wild-type; red: heterozygous; green: homozygous mutant samples). Color images available online at www.liebertonline.com/gtmb.
Sensitivity and specificity of HRM method
As there were no false-negative or false-positive results (all samples were correctly classified) with the optimized method, we achieved sensitivity and specificity of 100% for both HSD11B1 gene polymorphisms (19 true positive/[19 true positive + 0 false negative] and 81 true negative/[81 true negative + 0 false positive] for rs846910: G>A and 33 true positive/[33 true positive + 0 false negative] and 67 true negative/[67 true negative + 0 false positive] for rs45487298: insA polymorphism) (Norambuena et al., 2009).
Discussion
HRM is a fast, simple, and cost-effective method that is used for both mutation scanning and genotyping. It is a high-throughput method that can be used in a small laboratory. Sensitivity and specificity of 100% are reported for this method (Wittwer, 2009). By achieving accuracy of 100% in HRM genotyping of two polymorphisms within HSD11B1 gene, we were able to confirm these observations.
The method is only mildly constrained by primer design and optimization. As a single-base variation affects the melting behavior of a shorter amplicon more than that of a longer one, short amplicons (<150 bp) are preferable for known polymorphism genotyping (Reed et al., 2007). Our amplicon sizes were 146 bp for rs846910: G>A and 89 bp for rs45487298: insA.
As reported, a disadvantage of HRM analysis can be the inability to distinguish between different homozygous samples (Wittwer, 2009). In the case of rs846910: G>A genotyping, Gene Scanning software was able to correctly distinguish homozygous variant from wild-type samples (Fig. 3). However, as the number of homozygous mutant samples was small (only 2 of 100 samples) and as the software wrongly classified one heterozygous sample into group 4, we included an unlabeled probe in the assay to achieve better accuracy. This step, however, appears to be unnecessary because the three genotypes could be readily distinguished by derivative melting curve profiles (Fig. 4). Melting curve profiles for homozygous samples showed a shoulder peak next to the major peak (Fig. 4). These peaks did not result from unspecific PCR byproducts, because PCR product agarose gel electrophoresis gave only a single band. The explanation could be an uneven distribution of G/C nucleotides through the length of the 146-bp amplicon. As DNA melting domains are usually ∼50-300 bp long, larger amplicons, 100-800 bp, may have multiple melting domains (Wittwer et al., 2003). Therefore, we presume that shoulder peaks were the result of two melting domains in the amplicon. Indeed, the 5′ end of the amplicon region (1-73 bp, the first half of the amplicon) had a GC content of 44% and the 3′ end (74-146 bp, the second half of the amplicon) a GC content of 51%. The Tm of the major peak (83.8°C-84.5°C) may be attributed to the second half domain and the lower Tm of the smaller peak (81.2°C-82°C) to the first half domain of the amplicon that harbors the polymorphism. The presence of the shoulder peak and its combination with the major peak contributed to the distinct melting profiles of both types of homozygotes. This actually improved the power of both our and previously reported HRM genotyping (Wittwer et al., 2003; Jeffery et al., 2007; Steer et al., 2009).
The Gene Scanning program readily differentiated heterozygous samples for the rs45487298: insA polymorphism from homozygous ones (Fig. 5). The amplicon was shorter in this case (89 bp) and the derivative melting plots showed only one peak. To achieve discrimination between homozygous samples, we first used an unlabeled probe assay. However, the signal of the probe melting peak was low and the Tm difference between the two probe peaks was only 2.9°C. The manufacturer recommends that melting peaks should have a Tm difference (ΔTm) of at least 4°C to achieve reliable resolution. In the case of the rs846910: G>A probe assay, ΔTm was 4°C and the three genotypes could be readily discriminated based on the probe melting peaks (Fig. 4). The length of the designed probe was 27 bp for the rs846910: G>A polymorphism and 23 bp for rs45487298: insA. To obtain higher probe melting signals and to achieve better resolution, a longer probe should have been used for rs45487298: insA genotyping. However, in this particular sequence region this was not possible. Instead, we tried to differentiate genotypes by adding, after the reaction, 20% of wild-type PCR product to all samples except heterozygous ones. Samples were melted again and homozygous mutant samples could then be clearly distinguished from each other by normalized melting curves (Fig. 6).
We used two different approaches to overcome a potential disadvantage of HRM analysis, that is, poor differentiation of homozygous wild-type and mutant samples. The assay with the unlabeled probe did not give satisfying results in our experiment of rs45487298: insA genotyping. We found that, if heterozygous samples are accurately recognized and classified, the easiest, and actually no cost, solution is post-PCR spiking of homozygous samples with wild-type PCR product. This can be performed in the same plate and, as there is no need to amplify the region of interest again, requires only an additional HRM analysis, which takes 15-30 min. We can also infer that, although genotype differences are more easily observed with melting of shorter amplicons (Norambuena et al., 2009), derivative melting curve profiles of various genotypes can, in the case of larger amplicons, be distinctly different, because of multiple melting domains with different GC contents. The latter can actually improve the power of HRM genotyping.
In comparison with HRM, RFLP analysis has a number of disadvantages. It is a time-consuming and labor-intensive method that offers low throughput. It takes weeks to perform RFLP analysis because of the overnight incubation with restriction endonuclease and lengthy preparation of gels. Preparation of a polyacrylamide gel required for rs846910: G>A analysis is specially difficult. On the other hand, HRM analysis of 96 or 384 DNA samples can be performed in a few hours.
In conclusion, we have successfully optimized HRM assays for analysis of two polymorphisms within the HSD11B1 gene. An accuracy of 100% was achieved. Both polymorphisms can be analyzed concurrently, because the conditions of amplification and HRM are the same. Although primer design and optimization of specificity pose slight limitations, compared with the time-consuming conventional RFLP method, HRM has minimal post-PCR requirements and is a rapid, less-labor-intensive, easy-to-use, and high-throughput method.
Footnotes
Disclosure Statement
No competing financial interests exist.