




Abstract
Introduction: The FcγRIIa receptor is responsible for the clearance of large immune complexes and recently has been proved to be a C-reactive protein (CRP) receptor as well. A polymorphism in the corresponding FCG2RA gene resulting in an amino acid change (R131H) has been implicated, with conflicting results in the pathogenesis of various autoimmune or inflammatory disorders (e.g., atherosclerosis and coronary artery disease [CAD]). Methods: We recently developed a real-time polymerase chain reaction and melting curve analysis method for the genotyping of the above polymorphism. We further looked at its validity with bioinformatics study and DNA sequencing. Then we genotyped 134 CAD patients and 45 angiographically normal controls and determined serum high-sensitivity CRP by nephelometry (Dade-Behring). Also, we used apparently healthy platelet donors (n = 206) as a larger control group. Results: Our method is accurate and devoid of problems with homologs and copy number variants. The need for reference materials is stressed. There were statistically significant differences (p < 0.05) between the CAD patients and each of the two other control groups, with the percentage of RR genotype rising from 6.5% and 11% in the control groups to an average of 19% in all CAD patients (17%, 24%, and 18.5% in stable angina, unstable angina, and myocardial infarction, respectively). In a logistic regression model that included known risk factors for CAD including CRP, the RR genotype remained a significant predictor for CAD (odds ratio: 6.3 [1.1-36.3]). Also after linear regression analysis, CRP levels were reduced in the RR carriers (vs. HH + HR), controlling for age, sex, and disease (marginal p = 0.07). Conclusions: With our accurate genotyping method, the RR genotype was correlated with atherothrombotic CAD events. The inverse correlation found between CRP levels and genotype supports the in vitro data of RR cells binding CRP stronger than HH.
Introduction
C
The FcγRIIa receptor, a member of a large family of analogous molecules, is another such marker with multiple biological roles in the atherogenic process. First of all, it is the low-affinity receptor of the Fc portion of IgG antibodies, immune complexes, or opsonized bacteria, resulting in their clearance by phagocytes. Past infections and corresponding host defense have been also implicated as the immune component of atherosclerosis. Second, it is the only such molecule expressed in platelets and its activation by various mechanisms or its increased expression has been implicated in atherothrombosis (Calverley et al., 2002). Last but not least, its association with CRP, a member of the pentraxin family, is involved in innate immunity and inflammation. A decade ago, FcγRIIa receptor was proposed to be the major CRP receptor (Bharadwaj et al., 1999) but that was questioned intensively (Hundt et al., 2001) till its final proof very recently with the demonstration of the crystal structure of the associated molecules (Lu et al., 2008). CRP has a direct role in the atherosclerotic process and its presence in the arterial intima was shown in 2001 (Torzewski et al., 2000). It binds to both endothelial cells and monocytes and therefore assists in the monocyte-endothelial cell adhesion (Devaraj et al., 2005, 2006). Subsequent to the binding of CRP to its receptor FcγRIIa, its intracellular immunoreceptor tyrosine activation motif domain is activated, resulting in a cascade of reactions favoring the production of chemokines, Th1 cytokines, matrix metalloproteinases, and reactive oxygen species and the uptake of oxidized low-density lipoprotein (Devaraj et al., 2009). The increased expression of FcγRIIa fuels the vicious cycle. All the above actions are inhibited by blocking antibodies to FcγRIIa as shown in vitro (Singh et al., 2008).
The FcγRIIa gene (FCGR2A) is located in the 1q23 region and is organized in seven exons (Denomme, 2004). It has been hypothesized that a polymorphism in the fourth exon resulting in an arginine-to-histidine change in the extracellular domain near or within the binding region for IgG Fc and CRP could be implicated in the progression of various autoimmune or inflammatory diseases (and among them atherosclerosis). This biallelic single-nucleotide polymorphism (SNP) is cataloged as rs1801274 and its accurate definition according to the new human gene nomenclature by Human Genome Organization (Den Dunnen and Antonarakis, 2000) would be c.497G>A (GenBank accession number: NM_021642.2), resulting in a p. R166H change. However, in most of the published literature it is referred as R131H (the cleaved signal peptide is not included), and to avoid confusion, this definition will be retained throughout this article. The FcγRIIa-His131 receptor has a significantly different affinity for human IgG2 than FcγRIIa-Arg131. RR homozygotes are less effective in clearing IgG2 complexes but also bind CRP stronger than HR and HH individuals, as shown in vitro (Stein et al., 2000).
Because of the fact that there is biological basis for the role of FcγRIIa receptor and its SNP relating to atherosclerosis and CVD events, there were many groups that have worked on this association albeit with conflicting arguments either for (Gardemann et al., 2003; van der Meer et al., 2004) or against this argument (Mollaki et al., 2004; Gavasso et al., 2005; Murphy et al., 2007). After the crystallographic data proved FcγRIIa to be the CRP receptor (Lu et al., 2008), there was renewed interest reflected in larger studies with superb statistical power but still with contradictory results (Karakas et al., 2009; Raaz et al., 2009).
The above confusing situation for an SNP with an established biological role cannot be simply explained by genetic heterogeneity of different ethnic groups or by patient selection bias. Correct genotyping could be also an issue. We have recently developed an easy and rapid genotyping method for the aforementioned FCGR2A polymorphism to evaluate its association with autoimmune heparin-induced thrombocytopenia syndrome in cardiac surgery patients (Kroupis et al., 2009). So far, other investigators have employed tedious conventional polymerase chain reactions (PCRs) coupled with allele-specific oligonucleotide hybridization (Burgess et al., 1995), restriction fragment length polymorphism (Arepally et al., 1997), amplification refractory mutation system (Flesch et al., 1998), or even denaturing gradient gel electrophoresis (Bachelot-Loza et al., 1998). We selected to develop an asymmetric real-time PCR coupled with melting curve analysis in the LightCycler platform based on a previous successful experience (Kroupis et al., 2008).
To investigate the correct genotyping question posed, we looked at the FCGR2A gene and the other homologs of its family: FCGR2B and FCGR2C. There is a high degree of homology between the genes, and also recently, a copy number variant (CNV) was discovered for FCGR2C (Breunis et al., 2009). The other two homologs have solely the R allele homologous to the SNP position and most of the populations studied so far—by other genotyping methods—have detected an excess of R alleles (Lehrnbecher et al., 1999).
In this study, we further validated the accuracy of our genotyping method with a DNA alignment study and DNA sequencing. Proper reference materials and external quality control are urgently needed to compare methods. Then we used our method to genotype a well-ascertained Greek coronary artery disease (CAD) patient cohort (n = 134) suffering from either stable (stable angina) or acute coronary syndrome (unstable angina or MI) and to compare results with those of an angiographically normal population (n = 45) and a second much larger healthy control group (n = 206). CRP measurements were also investigated in this study for their association with the FCGR2A SNP and disease.
Materials and Methods
Patients
During a 3-year period (from 2005 to 2008) at Onassis Cardiac Center, 134 consecutive CAD Greek patients without a previous history of MI were included in the study after obtaining their written informed consent upon hospital admission to retrieve and store their genetic material (113 men [84%] and 21 women [16%]; mean age: 62 years old). These patients belonged to three different groups: 36 patients with stable angina, 33 with unstable angina, and 65 with nonfatal MI according to established MI definition guidelines with ST elevation in the electrocardiograph and typical rise and fall of troponin I (Thygesen et al., 2007; Manginas et al., 2008). After obtaining consent, DNA was also isolated from another angiographically normal population (n = 45; 27 men [60%] and 18 women [40%]; mean age: 54 years old). This clinically relevant population proceeded in schedule with this invasive diagnostic procedure because of symptoms, family history, presence of risk factors, and increased anxiety. Traditional Framingham risk factors were also recorded. The above clinical protocols were approved by the Institutional Ethics Committee. Finally, 206 unrelated platelet donors apparently healthy (electrocardiograph negative) served as random healthy controls (age but not sex matched to the CAD patients, sex but not age matched to the angiographically normal controls) after informed consent, to increase statistical power in genotype comparisons.
CRP measurements
Sera samples were collected in BD SST gel clot vacutainer tubes (Becton Dickinson) upon admission and centrifuged within 30 min of venipuncture at 3500 rpm for 10 min and stored at −20°C until measurement. The U.S. Food and Drug Administration-approved CardioPhase high-sensitivity CRP particle-enhanced immunonephelometric assay was used in a BN Prospec nephelometer (Dade Behring Siemens). The assay was calibrated against WHO ERM-DA470 reference material.
Genomic DNA isolation and FCGR2A c.497G>A polymorphism analysis
DNA was isolated from 200 μL peripheral blood collected in EDTA-containing BD vacutainer tubes (Becton Dickinson) by the QIAamp DNA Blood Mini kit (Qiagen) according to the manufacturer's instructions. DNA purity and quantity were determined by absorbance readings at 260 and 280 nm with a GENESYS 5 spectrophotometer (Thermo Scientific).
For FCGR2A c.497G>A genotyping, we used our recently developed asymmetric real-time PCR method in the LightCycler instrument (Roche Applied Science) with the conditions described (Kroupis et al., 2009). Briefly, the method employs the dual fluorescent hybridization probe format: one sensor probe labeled with fluorescein (100% complimentary with the FCGR2A R allele) and one anchor probe labeled with LC-640 (both in the antisense strand). Primers and probes were synthesized by TIB MOLBIOL. Allele discrimination was achieved by melting curve analysis of the PCR product after the end of cycling. Average melting points for the H and R alleles were 52.71 and 62.24, respectively. The ΔTm was quite high (>9°C) and a characteristic curve is supplied in Supplementary Figure S1 (Supplementary Data are available online at www.liebertonline.com/gtmb) (Kroupis et al., 2009). The assay is simple and rapid (completed within 20 min after DNA preparation in the 32-position LightCycler) but also amenable to automation in higher-throughput platforms (e.g., LC480 platform).
Bioinformatics
The CLC DNA Workbench software 4.0.3 was used for DNA alignment of the GenBank-imported sequences of the three FCGR2 genes (CLC Bio, Inc.).
DNA sequencing
Six samples of different genotypes according to our real-time PCR method (two of each HH, HR, and RR) were subjected to bidirectional DNA sequencing. After conventional PCR with the primers used in the developed real-time method with analogous conditions, 7.5 μL of the PCR reaction product was treated with 3 μL of ExoSAP-IT (USB-Affymetrix). Then 5 μL of the treated PCR product was used as a template for the cycle sequencing reaction, using the Big Dye Terminator v1.1 kit (Applied Biosystems). The reaction consisted of 1 μL ready reaction terminator premix, 7 μL sequencing buffer, 1 μL of 5 pmol/μL PCR primer (either forward or reverse), and 6 μL of sterile water. Cycle sequencing was performed according to manufacturers' instructions and products were separated from unincorporated nucleotides with the use of NucleoSeq Columns (Macherey-Nagel). Finally, they were run in a 47-cm capillary filled with POP-6 polymer in an ABI 310 Genetic Analyzer (Applied Biosystems) and manually base-called with the Chromas Lite 2.01 software (Technelysium Pty).
Statistical analysis
Statistical analysis was performed with the SPSS version 17 statistical software package (SPSS-IBM, Inc.). Normality hypothesis for the continuous variables, age and CRP, was assessed using Kolmogorov-Smirnov test. Student's t-test or analysis of variance was employed for comparison of means between normal age populations and Mann-Whitney or Kruskal-Wallis tests for comparison of means between nonnormal CRP populations. χ2 tests were used for comparison of percentages between categorical variables (genotyping and clinical characteristics). Adequacy of the number of total samples to achieve a statistical power of 0.95 for the χ2 test was checked with the G*Power 3.0 software (written by Franz Faul at the University of Kiel, Germany). CRP was logarithmically transformed and its association as a dependent variable with other factors including genotype was examined in a multiple linear regression. All risk factors affecting CAD morbidity plus genotype and log CRP were incorporated in multivariate unconditional logistic regression analysis to produce adjusted odds ratios (ORs) and 95% confidence intervals (CIs). All tests of significance were two-sided and p-values <0.05 were considered significant. Hardy-Weinberg equilibrium in genotyping results was checked with the SNPStats program (Sole et al., 2006).
Results
FCGR2A c.497G>A genotyping validation
Besides the analytical characteristics examined in our previous publication (Kroupis et al., 2009), we decided to expand further our validation because of the fact that all three FCGR2 genes are highly homologous throughout the entire gene area. However, to focus in the area of the tested c.497G>A polymorphism—which is around the middle of exon 4—and to avoid intronic areas not being under selective pressure, we present the DNA alignment bioinformatics data solely for exon 4. It was performed with the use of the GenBank sequences with accession numbers NM 021642, 004001, and 201563 (for the corresponding FCGR2A, FCGR2B, and FCGR2C genes). Only eight nucleotide differences were observed between FCGR2A and the other two homologs. As shown in the selected 28-nucleotide area of Figure 1, five of these differences are located in the binding site of the anchor probe and—most importantly—of the sensor probe (probe sequences are antisense). The forward PCR primer also contains another difference at its 3′ end area (not shown). Although the PCR reaction is stringent enough (high annealing temperature, high magnesium concentration), still amplification of all 3 homologous gene areas occurs and this point is illustrated in Figure 2. Assuming no CNV for FCGR2C, if we have an HH FCGR2A homozygous sample we would expect two H alleles and four R alleles (ratio H/R or A/G = 1:2) in the sequencing result of the PCR product (Fig. 2a). If we have a RR FCGR2A homozygous sample we would expect only R alleles (Fig. 2b) and if we have a HR FCGR2A heterozygous sample we would expect one H allele and five R alleles (ratio H/R or A/G = 1:5) (Fig. 2c). The “pure” result obtained for the RR sample and the observed ratios in the HH and HR DNA sequencing results indicated that our genotyping method is accurate. It seems possible that although the real-time PCR reaction can amplify all three areas with less or more efficiency, the sensor probe “senses” only the FCGR2A gene area.
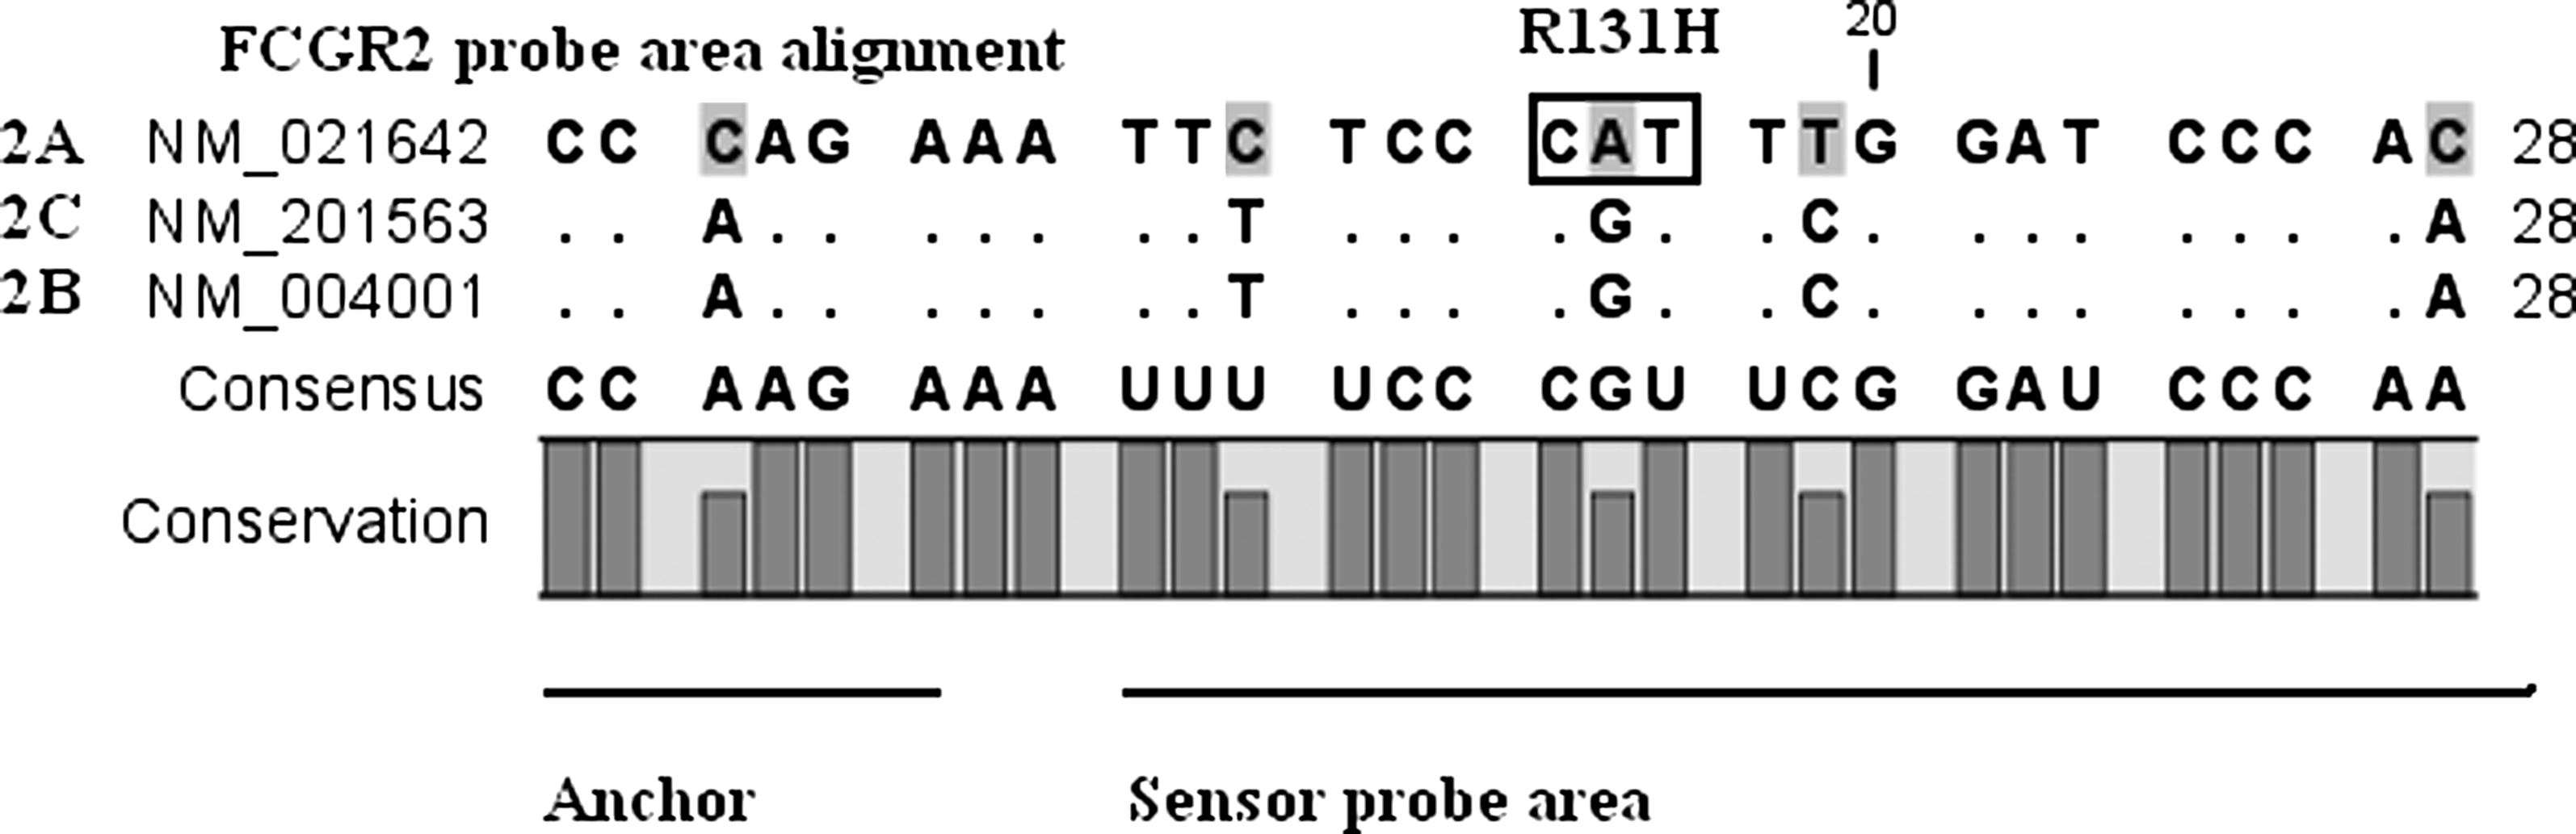
DNA alignment of a 28-nucleotide area in exon 4 of the three homologous FCGR2 genes: 2A, 2C, and 2B (sense strand). The selected area spans part of the anchor probe and the entire sensor probe. The conservation bar depicts in an elegant way the only area showing five differences in the three highly homologous genes (including the R131H).
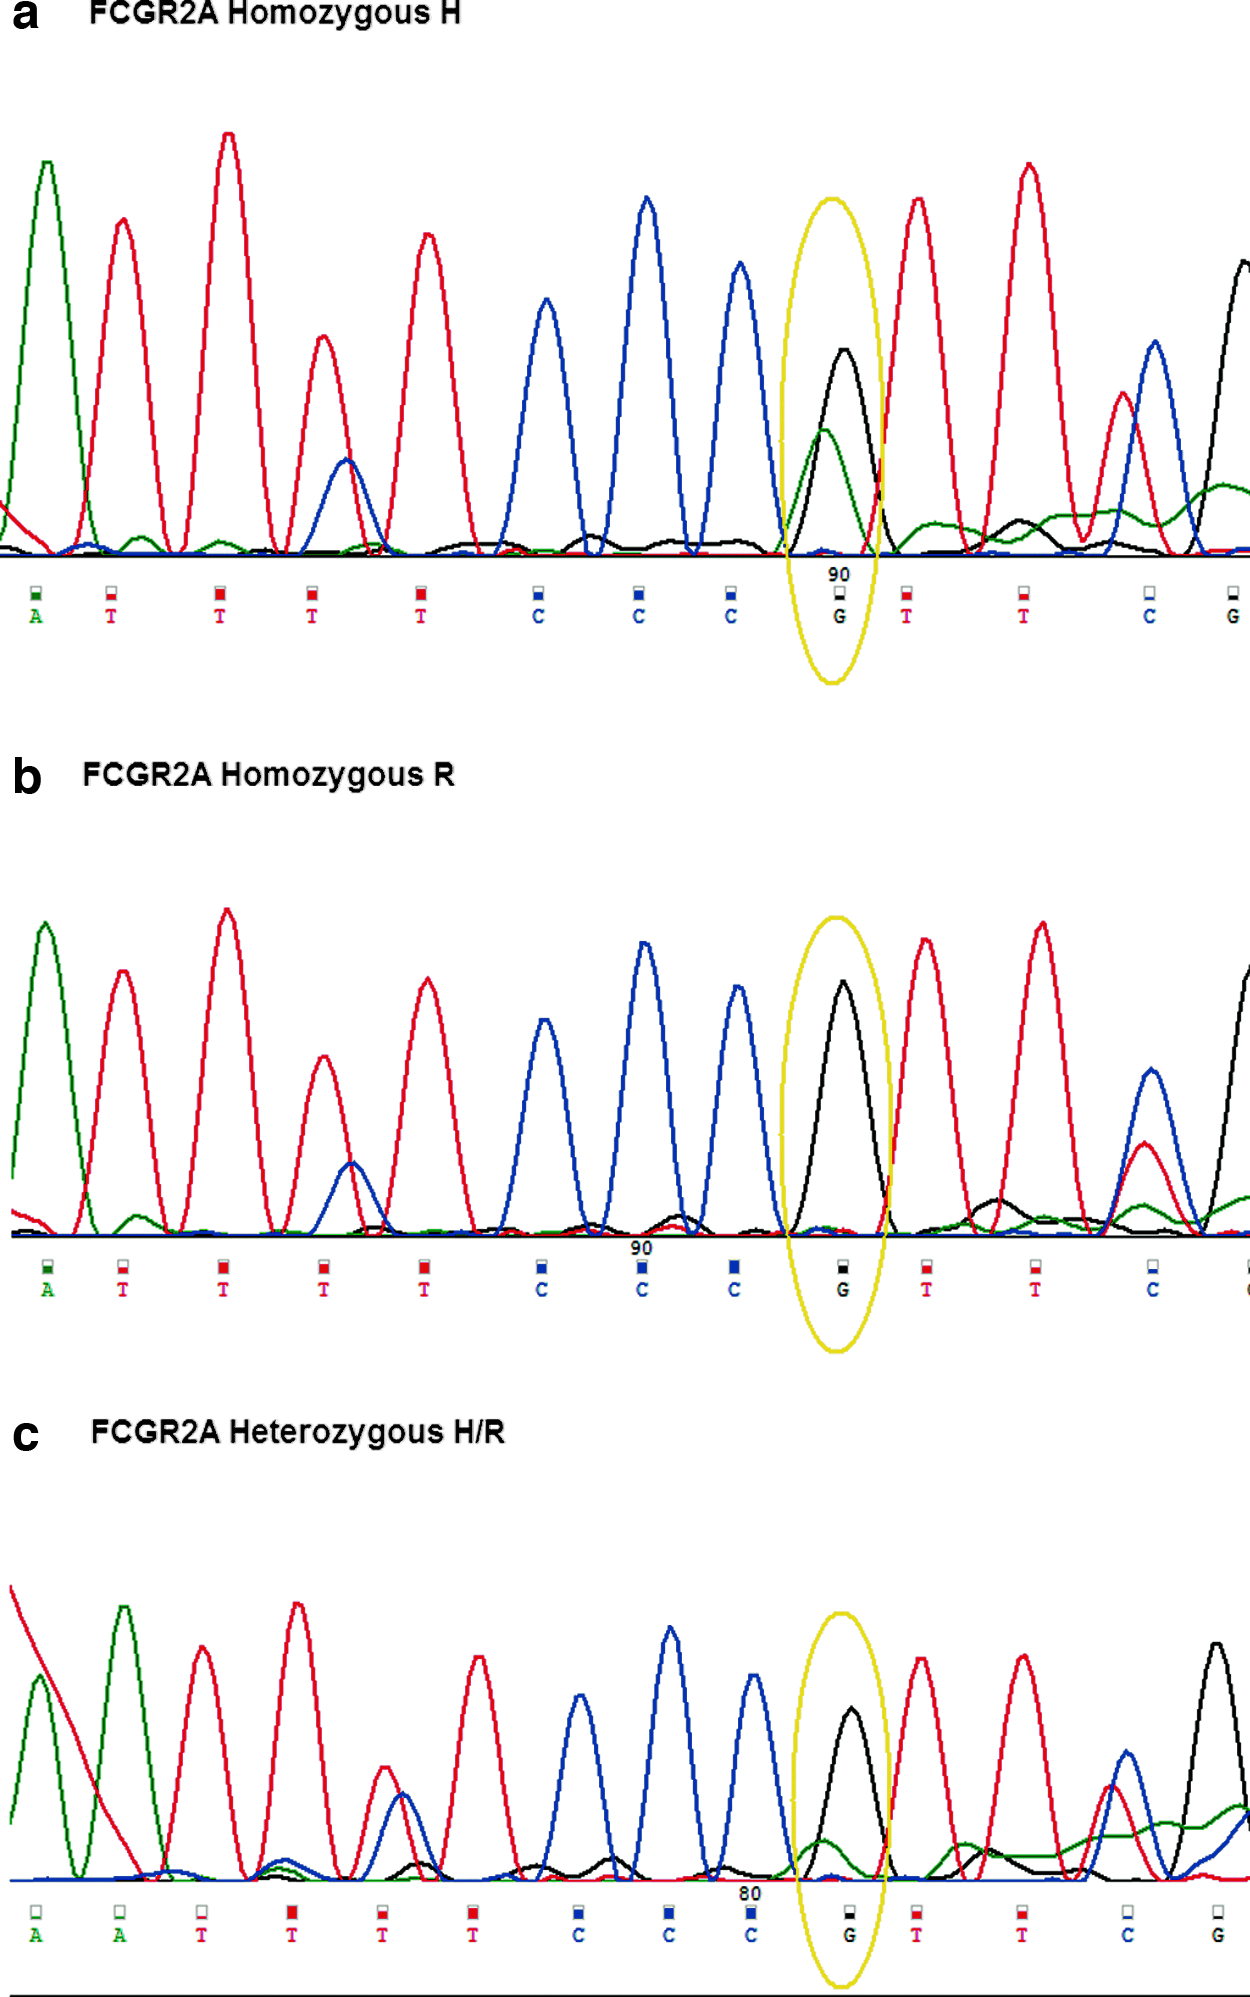
DNA sequencing result of the FCGR2A sense strand for a 10-nucleotide area (nucleotides 9-19 of Fig. 1) from
Descriptive characteristics and CRP of patients and angiographically normal controls
Between the three patient groups (stable, unstable, MI), there was no significant difference in age and traditional risk factors as shown in Table 1. Between angiographically normal controls and all CAD patients, there is significant difference in age (p < 0.001) and in percentages of male gender and dyslipidemia, whereas it is marginal in hypertension and family history, with no difference in diabetes mellitus. These results were expected as this is a group of people who underwent an invasive procedure because of risk factors but were found negative for coronary artery stenoses >50%. As far as CRP measurements are concerned, there is statistical significance between the CAD groups (<0.001), whereas it is unexpectedly less between CAD and normal controls (p = 0.035). This may be explained by the fact that these subjects were admitted to hospital in schedule, and therefore, subclinical infections affecting CRP biological variation could have occurred.
p-Value for difference between the three categories of CAD patients (stable, unstable, MI).
p-Value for difference between normal controls (angiographically) and all CAD patients.
LDL >100 mg/dL or treatment.
Blood pressure >140/90 mmHg or treatment.
Current or former smoker up to 1 month before.
CAD, coronary artery disease; CRP, C-reactive protein; MI, myocardial infarction; ns, nonstatistical significance.
FCGR2A c.497G>A genotyping results for patient and control groups
The FCGR2A genotype distribution and allele frequencies in the studied CAD patients and healthy controls are shown in Table 2. No deviation was found from Hardy-Weinberg equilibrium. There was no statistically significant difference in the prevalence of either genotype or allele frequency between the two control groups: the angiographically normals and the healthy control group. However, there were differences between the CAD patients and each of the two other control groups, with the percentage of RR genotype rising from 6.5% and 11% in the control groups to an average of 19% in all CAD patient group. Within the three CAD patient groups, there was no significant difference concerning genotype frequency (e.g., RR percentage is 17% for stable angina, 24% for unstable angina, and 18.5% for MI patients; p > 0.05). If allele frequencies are compared between the CAD and control groups, still the R allele is increased in both comparisons but in a nonsignificant fashion. If we consider through the mode of inheritance and we pick the recessive model, then R allele is strong only in its homozygosity. Then if RR versus RH + HH tests are run, there is a statistically significant difference between all CAD patients and angiographically normals (p = 0.045) and also between all CAD patients and healthy controls (p = 0.035). According to the G*Power software, there was adequate statistical power to render valid the comparisons performed (total cases are 179 and 340, respectively; >172 cases are needed according to the program when 2 degrees of freedom exist).
Associations between CRP, genotype, and CAD
When all subjects (CAD patients and angiographically normal controls) are considered, mean CRP value is reduced from HH subjects to HR then to RR (8.68-7.79-5.36 corresponding values), with the trend, however, not being significant. The same trend occurs mainly in the unstable and MI groups where CRP values are quite higher, although not statistically significant (p > 0.05). In an effort to explore the association between CRP values and FCGR2A genotype, a multiple linear regression model was performed where log CRP levels are reduced in the RR carriers (vs. HH + HR) after adjusting for variables such as age, sex, and CAD disease status (borderline statistical significance, p = 0.074). Therefore, the fact that RR monocytes bind CRP stronger than HR and RR in vitro (Stein et al., 2000) seems marginally substantiated in a clinical CAD setting with true sera samples.
Finally, Table 3 depicts multiple logistic regression-derived adjusted OR and 95% CI for association of CAD risk in relation to known risk factors for CAD (age, sex, family history of CAD, presence of diabetes, dyslipidemia, hypertension, and smoking status) along with RR genotype and log CRP values. Interestingly, controlling for the aforementioned variables including CRP, an individual with RR genotype has about 6.28 times more likely the risk to develop CAD than an individual with HR or HH genotype. The RR genotype presents a statistical significant of CAD risk predictor (p < 0.05, OR [95% CI]: 6.3 [1.1-36.3]), reinforcing the genotyping results and the statement that RR is associated with atherothrombotic CAD events.
ORs adjusted for age, CRP (continuous variables), sex, family history of CAD, presence of diabetes mellitus, dyslipidemia, hypertension, smoking status, and RR genotype.
p < 0.05, statistical significance.
95% CI, 95% confidence interval; OR, odds ratio.
Discussion
There were many reasons that prompted us to investigate further the accuracy of our recently developed genotyping method for FCGR2A c.497G>A SNP (referred commonly as R131H). First of all, the conflicting results obtained so far by many groups worldwide in every association of the aforementioned SNP with a variety of autoimmune and inflammatory diseases (including CAD), despite its solid biological basis for a different interaction of the FcγRII receptor with antibodies, immune complexes, or pentraxins (like CRP). RR homozygotes are less effective in clearing IgG2 complexes, and in addition, they do bind CRP stronger than HR and RR individuals (Stein et al., 2000). These properties affect immune complex circulation-deposition and the endothelial-monocyte cell interaction (possibly through CRP) and both events are considered critical for early steps of atherosclerosis. The long debate for FcγRII receptor being a CRP receptor as well ended recently (Lu et al., 2008). Second, there exists high homology between FCGR2A with its homologs (or in some cases pseudogenes) FCGR2B and FCGR2C and this requires careful examination of the genotyping method with the situation being even worse with the recent discovery of a FCGR2C CNV (Breunis et al., 2009). Third, our method reported the smaller RR percentage worldwide (Lehrnbecher et al., 1999) and we hypothesized reasonably that because the other two homologs contain R in the corresponding position, other methods could be “diluting” results with more RR and RH, therefore obliterating any emerging correlation between this “difficult” SNP and a disease.
Our purpose, however, was not to test the existing methods but to validate ours with further evidence obtained by bioinformatics and DNA sequencing. As mentioned in our previous publication, it was difficult to genotype with the method of comparison we used (amplification refractory mutation system) because of the presence of faint ghost bands in the gel electrophoresis result (Flesch et al., 1998; Kroupis et al., 2009). Our real-time PCR method coupled with melting curve analysis was further tested for accuracy and proved 100% correct even though the PCR reaction could generate product from the other two homologs. This was mainly due to the sensor probe, which is specific for the FCGR2A gene; it would dissociate from the other homologs because of the existing nucleotide differences. Should the interest to the SNP arises again because of recent data, it could become high throughput as it is a simple, robust, and rapid method amenable to automation. Pharmacogenetics may be the next arena for this SNP, for example, evaluating response to biological therapy (herceptin, cetuximab, etc.) (Musolino et al., 2008; Bibeau et al., 2009).
Ultimately, proper reference materials will be desperately needed to evaluate the methods in use and reexamine associations with disease syndromes or perform meta-analysis. We propose the use of vectors containing separately big genomic areas of the three homologs in a 1:1:1 ratio (in three tubes with different HH, HR, and RR genotyped FCGR2A areas) and this same approach could be applied in other pseudogenes and homolog genes (FCGR3, cytochrome, glutathione transferases, etc.). Also, the initiation of external quality assessment schemes would be quite helpful for improving genotyping accuracy worldwide.
After concluding with the validation of our method, we evaluated genotyping results from a well-ascertained CAD population (n = 134) and compared them with those of the clinical relevant group of angiographically normal population (n = 45) and a group of random healthy controls (n = 206). The percentage of RR genotype was raised from 6.5% and 11% in the control groups to an average of 19% in all-CAD patient group. There was statistically significant difference in both all CAD/angiographically normals and all CAD/controls comparisons (RR vs. RH + HH, p < 0.05). The size of our study was modest; however, we consider important the fact that the clinically relevant control group represents a truly CAD-negative population. The result from the random control group consisting of apparently healthy platelet donors is also important, although we cannot exclude the presence of subclinical atherosclerotic process. In a logistic regression model for CAD risk including most traditional Framingham risk factors (age, sex, family history of CAD, presence of diabetes mellitus, dyslipidemia, hypertension, and smoking status), the RR genotype remained a significant predictor (p < 0.05, OR [95% CI]: 6.3 [1.1-36.3]). Our results do not discredit the FCGR2A SNP at all, and in light of our bioinformatics findings, we urge for reconsideration of all negative results obtained so far by reexamining the genotyping methods' accuracy. The inclusion of only the accurate methods in a meta-analysis with a much higher statistical power would certainly clarify the issue.
Within the three CAD patient groups (stable angina, unstable angina, and MI), however, there was no statistically significant difference concerning genotype and allele frequency. Our data are supporting the idea that the FCGR2A SNP could be considered a risk factor for atherosclerosis in general as found in both basic research and clinical setting (van der Meer et al., 2004), but not a risk factor for progression to an acute coronary event as reported by others (Raaz et al., 2009). The limitation of our study is the existing survival bias (fatal acute coronary syndrome was not included).
Finally, CRP values were reduced from HH subjects to HR then to RR; however, the trend was not significant. One possible reason could be that the included CRP results of the angiographically normal controls were higher than expected because their hospital admission was scheduled and subclinical infections within the past 2 weeks cannot be excluded (main reason for the high intra-individual variability of this marker). In a multiple linear regression model, serum log CRP levels were reduced in the RR carriers (vs. HH + HR) after adjusting for variables: age, male gender, and disease status (p = 0.074). Therefore, the fact that RR cells bind CRP stronger than HR and HH in vitro (Stein et al., 2000) seems marginally substantiated in a clinical CAD setting with true sera samples. Maybe RR binding is not enough to remove in a significant way the amount of CRP continuously being produced. Local CRP concentration near or within the atheromatous plaque could be more important than systemic levels for the development of the disease.
Disclosure Statement
No competing financial interests exist.
References
Supplementary Material
Please find the following supplemental material available below.
For Open Access articles published under a Creative Commons License, all supplemental material carries the same license as the article it is associated with.
For non-Open Access articles published, all supplemental material carries a non-exclusive license, and permission requests for re-use of supplemental material or any part of supplemental material shall be sent directly to the copyright owner as specified in the copyright notice associated with the article.
