




Abstract
Aim of the Study: The present study was planned to assess whether social stratification in the Sikh population inhabiting the northwest border Indian state of Punjab has any genetic basis. Subjects and Materials: Blood samples were collected randomly from a total of 2851 unrelated subjects belonging to 21 groups of two low-ranking Sikh scheduled caste populations, viz. Mazhabi and Ramdasi, and a high-ranking Jat Sikh caste population of Punjab. Methods: The genetic profile of Sikh groups was investigated using a total of nine serobiochemical genetic markers, comprising two blood groups (ABO, RH(D)) and a battery of seven red cell enzyme polymorphisms (ADA, AK1, ESD, PGM1, GLO1, ACP1, GPI), following standard serological and biochemical laboratory protocols. Genetic structure was studied using original allele frequency data and statistical measures of heterozygosity, genic differentiation, genetic distance, and genetic admixture. Results: Great heterogeneity was observed between Sikh scheduled caste and Jat Sikh populations, especially in the RH(D) blood group system, and distribution of ESD, ACP1, and PGM1 enzyme markers was also found to be significantly different between many of their groups. Genetic distance trees demonstrated little or no genetic affinities between Sikh scheduled caste and Jat Sikh populations; the Mazhabi and Ramdasi also showed little genetic relationship. Genetic admixture analysis suggested a higher element of autochthonous tribal extraction in the Ramdasi. Conclusions: The present study revealed much genetic heterogeneity in differently ranking Sikh caste populations of Punjab, mainly attributable to their different ethnic backgrounds, and provided a genetic basis to social stratification present in this religious community of Punjab, India.
Introduction
The territorial extent of Punjab extends from 29°30′ to 32°32′ North latitude and from 73°55′ to 76°50′ East longitude, with an area of 50,362 km2. The Ravi, Beas, and Sutlej rivers of Punjab define three natural geographical regions of the state (Fig. 1A), viz. the Majha (between Ravi and Beas), Doaba (between Beas and Sutlej), and Malwa (below Sutlej). Of these, the Malwa region is the biggest and most important. As per Census of India (2001), Punjab had a population of 24,289,296.

Historically, the people of Punjab are supposed to be progeny of a mixture of several proto- and post-Harappan invaders who entered this land from the West from time to time and of original autochthonous settlers of the area (Rose, 1919). The Sikh religion arose in Punjab in the 15th century and was founded by Guru Nanak Dev, first of the 10 gurus (masters) of Sikh. The Mazhabi and Ramdasi are the two most important endogamous scheduled caste populations of Sikh. Morphologically, members of both these castes have short stature, short and broad nose, dark skin color, and black eyes and hair—features that apparently suggest a higher element of indigenous (autochthonous) extraction in them (Jammu, 1996). They were ascribed to the Aryo-Dravidian physical type by Risley (1915). On the other hand, Jat Sikh are characterized by high stature and long and sharp nose, and the predominant color of skin is very light transparent brown and that of hair and eye is brown. They belong to the Indo-Aryan physical type (Risley, 1915).
Mazhabi
Like the Chuhra representing the lowest social stratum of Hindu society, the Mazhabi are at the bottom of the Sikh caste hierarchy. Traditionally, the male Mazhabi works as an agricultural laborer on contract basis in fields with Jat Sikh landlords and the female Mazhabi is engaged in doing menial jobs such as removing cow dung and stools, etc., from homes of such upper caste people in villages. Thus, their occupations provide opportunities for mingling of Mazhabi with Jat Sikh in daily life.
Ramdasi
Although a very low occupational caste, above only perhaps the Mazhabi, the Ramdasi are an integral part of Sikh society. Like Hindu Chamar, traditionally they are leather workers—taking a carcass away from habitation, removing its hide, eating some of the flesh, tanning the hide, dyeing it, or making shoes and thongs from it.
Jat Sikh
Jat Sikh, an agricultural caste, has its origin in the Jat, a nonautochthonous tribe that entered Punjab from its home on the river Oxus in Central Asia and first occupied the Indus valley. Much before the earliest Muslim invasions, the Jat had spread into Punjab proper, where they were firmly established in the beginning of the 11th century (Ibbetson, 1916). Those of the Jat who embraced the Sikh religion are known as Jat Sikh. Numerically, they are the single largest dominant endogamous caste population of Punjab.
Barring some observations on ABO and RH(D) blood groups, scheduled caste populations of Punjab are little represented on its genetic map. Therefore, the present study was planned to investigate the genetic constitution of two major lower social strata Sikh caste populations of Punjab, viz. The Mazhabi and Ramdasi, along with the Jat Sikh, a high ranking caste population (Table 1), using original data on two serological (ABO, RH(D)) and seven biochemical (adenosine deaminase [ADA], adenylate kinase locus 1 [AK1], esterase D [ESD], phosphoglucomutase locus 1 [PGM1], glyoxalase locus 1 [GLO1], acid phosphatase locus 1 [ACP1], and glucosephosphate isomerase [GPI]) polymorphisms. Use of only blood group and enzyme marker data is a limitation of the present study.
Subjects, Materials, and Methods
After obtaining informed consent, finger prick blood samples were collected from a total of 2851 randomly chosen, unrelated, healthy male and female Sikh subjects belonging to the Mazhabi (n=501), Ramdasi (n=517), and Jat Sikh (n=1833) caste populations inhabiting the Punjab (Table 2) during 1989-2003.
Red cells were typed for ABO and RH(D) blood groups by the tube method, following standard serological techniques. Hemolysates were phenotyped for different red cell enzymes by the biochemical technique of horizontal gel electrophoresis as per protocols of Murch et al. (1986) for ADA and AK1, Wraxall and Stolorow (1986) for ESD and PGM1, Scott and Fowler (1982) for GLO1, Wraxall and Emes (1976) for ACP1, and Detter et al. (1968) for GPI.
Allele frequencies were calculated in the ABO system following Yasuda (1984), in RH(D) system by square root method, and in enzyme markers by gene counting method (Mourant et al., 1976). Deviations from Hardy-Weinberg equilibrium were studied by goodness-of-fit chi-square (χ2HW) test using phenotype data, and for this, rare variants in PGM1 system and infrequent phenotypes in ACP1 system were grouped with the respective heterozygote. Degrees of freedom (df) was calculated by subtracting the number of independent variables required to construct expected data from the number of classes of phenotypes of the genetic system. Intergroup differences were studied by the contingency χ2 test using the observed allele number data. Genetic structure was investigated using statistical measures of heterozygosity and genic differentiation as given by Nei (1973) and Weir and Cockerham (1984), respectively. To study genetic relationships, pairwise estimates of genetic distance (D) (Nei, 1972) were calculated, and dendrograms were constructed by the UPGMA and NJ methods (Sneath and Sokal, 1973) using Power Marker (Liu, 2005). Genetic admixture was estimated as described by Chakraborty (1986).
Results
The observed number of phenotypes along with goodness-of-fit chi-square (χ2HW) test values for the nine studied markers in 5 groups each of Mazhabi and Ramdasi and 11 of Jat Sikh are shown in Tables 3-5; allele frequencies are listed in Tables 6-8. Barring a few groups in ABO, ADA, AK1, PGM1, and ACP1 systems, the overall distribution of markers in Sikh samples was in Hardy-Weinberg equilibrium (Tables 3-5).
Values in parentheses are percentages.
Statistically significant (p≤0.05)
Values in parentheses are percentages.
Statistically significant (p≤0.05).
Values in parentheses are percentages.
Statistically significant (p≤0.05).
Genetic variation
The frequency of ABO*A1 varied from 0.1242 to 0.2195 in the Mazhabi (Table 6), from 0.1471 to 0.2129 in the Ramdasi (Table 7), and from 0.1115 to 0.2109 in the Jat Sikh (Table 8). The range of ABO*B frequency observed was 0.2316-0.3285, 0.2109-0.2946, and 0.1933-0.2718, respectively. ABO*A2 was found absent from one group each of the Mazhabi and Ramdasi, but it was present in every group of Jat Sikh. The χ2 comparisons between scheduled caste and Jat Sikh groups (Tables 9 and 10) revealed significant heterogeneity in about one-third of cases.
0.05>p>0.02.
0.02>p>0.01.
0.01>p>0.001.
p<0.001.
0.05>p>0.02.
0.02>p>0.01.
0.01>p>0.001.
p<0.001.
The incidence of RH(D)−phenotype was found to be much lower in both Mazhabi (range: 2.63%-5.43%; Table 3) and Ramdasi (range: 1.16%-3.88%; Table 4) compared with Jat Sikh (range: 8.14%-15.49%; Table 5). Evidently, both Sikh scheduled caste populations of Punjab are characterized by comparatively low occurrence of this phenotype. In terms of allele frequency also, great differences were observed as RH*d was found in rather low ranges in both the Mazhabi (0.1622-0.2331; Table 6) and the Ramdasi (0.1078-0.1971; Table 7) compared with the Jat Sikh (0.2853-0.3936; Table 8). The χ2 test between 11 groups of Jat Sikh and 10 of two scheduled castes was found to be statistically significant in almost all cases, save a few comparisons between the Jat Sikh of the Hoshiarpur district and the Mazhabi of the Muktsar, Bhatinda, and Sangrur districts and that between the Jat Sikh of Kapurthala district and the Mazhabi of Sangrur district. This overwhelmingly demonstrated conclusive heterogeneity in RH(D) distribution in upper- and lower-ranking Sikh caste populations of the Punjab.
As for polymorphic red cell enzyme systems, the range of ADA*2 frequency noted in Jat Sikh groups (0.0892-0.1648; Table 8) was found to be higher than that observed in groups of both Mazhabi (0.0781-0.1316; Table 6) and Ramdasi (0.0864-0.1417; Table 7). Apparently, Jat Sikh showed comparatively higher incidence of the allele than both scheduled castes, but statistically few χ2 test values showed significant differences (Tables 9 and 10). Mazhabi showed somewhat higher incidence of AK1*2 (range: 0.0978-0.1886; Table 6) compared with both Ramdasi (range: 0.0756-0.1339; Table 7) and Jat Sikh (range: 0.0828-0.1497; Table 8), albeit statistically few χ2 comparisons between groups of scheduled castes and Jat Sikh revealed appreciable differences in AK1 (Tables 9 and 10). Mazhabi showed ESD*2 frequency in a range (0.2520-0.3315; Table 6) that was much higher compared with that observed in Jat Sikh (0.1815-0.2429; Table 8), and intergroup comparisons revealed appreciable differences in half the cases (Table 9). The range observed in Ramdasi (0.1893-0.2384; Table 7) was almost identical with that of Jat Sikh and no heterogeneity was observed between them (Table 10).
In PGM1 besides three common phenotypes, three rare variants were found (Tables 3-5). Ramdasi depicted somewhat a higher frequency range of PGM1*2 (0.2621-0.3976; Table 7) compared with both Mazhabi (0.2656-0.3289; Table 6) and Jat Sikh (0.2624-0.3667; Table 8). Rare alleles PGM1*3 and PGM1*5 were confined to Mazhabi (Table 6), whereas PGM1*7 was present in both Ramdasi and Jat Sikh (Tables 7 and 8). Almost all statistically significant χ2 differences observed were between groups of Ramdasi and Jat Sikh (Tables 9 and 10). Similarly, in GLO1 it was the Ramdasi groups, which showed higher frequency range of GLO1*1 (0.2573-0.3537, Table 7) compared with the Mazhabi (0.2500-0.3177; Table 6) and the Jat Sikh (0.2500-0.3192; Table 8) groups. Few Ramdasi groups showed statistically significant differences with Jat Sikh groups for this marker (Table 10).
The Jat Sikh showed a consistently high frequency of ACP1*A (range: 0.3122-0.4124; Table 8) compared with both the Mazhabi (range: 0.2846-0.3542; Table 6) and the Ramdasi (range: 0.2317-0.3547; Table 7). Of 10 scheduled caste groups, only two Mazhabi and three Ramdasi showed presence of infrequent ACP1*C, found present in 9 of 11 Jat Sikh groups. Some significant differences were observed, especially between Ramdasi and Jat Sikh groups (Tables 9 and 10). Half of the Sikh groups studied showed presence of GPI variant 1,3, detected in all five Mazhabi, two Ramdasi, and four Jat Sikh groups (Tables 3-5), revealing that the variant was frequent in the Sikh scheduled castes rather than the Jat Sikh.
Thus, in the present Sikh samples from Punjab, besides RH(D) blood group system, which showed almost complete heterogeneity between Sikh scheduled caste and Jat Sikh populations, distribution of ESD, ACP1, and PGM1 enzyme markers was also found to be significantly different between many of their groups.
Heterozygosity
Table 11 shows that there was great interlocus variation in heterozygosity (h) estimates in different Sikh populations. This heterogeneity in heterozygosity values could simply be a genetic consequence of population structure or it may indicate an effect of natural selection operating in the biosphere of Punjab. Because h is a measure of genic variation, in Sikh of Punjab, ABO was found to be the most variable marker, followed by ACP1, PGM1, GLO1, ESD, RH(D), ADA, AK1, and GPI (Table 11). On the other hand, average heterozygosity (H) estimates by population group (Table 12) were rather homogeneous in the Mazhabi (range: 0.3331-0.3528), the Ramdasi (range: 0.3118-0.3390), and the Jat Sikh (range: 0.3282-0.3485), suggesting a similar extent of genic variation in them.
Genic differentiation
Estimates of FST in Sikh samples are presented in Table 13, which show that there was great heterogeneity in its values over loci. The average value of FST over eight diallelic loci was found to be 0.004539 in Mazhabi, 0.006618 in Ramdasi, and 0.004408 in Jat Sikh. This demonstrated that the Punjab groups of Jat Sikh as well as Mazhabi were comparatively less differentiated genetically than Ramdasi groups.
Nei's genetic distance
In the dendrogram constructed using the UPGMA method (Fig. 2), there were two distinct subclusters—one comprising solely of 11 Jat Sikh groups and other of all 10 groups of Mazhabi and Ramdasi. This bimodal clustering demonstrated that there were no genetic affinities between Jat Sikh and scheduled caste populations of Punjab, suggesting their diverse genetic compositions. In the latter subcluster, first three Ramdasi groups separate at an early stage of evolution and form a sub-sub cluster and similarly four Mazhabi groups are placed together in a sub-sub-sub cluster at the bottom of the tree. Evidently, genetic distinction between two Sikh scheduled caste populations was also discernible to a large extent from this dendrogram.
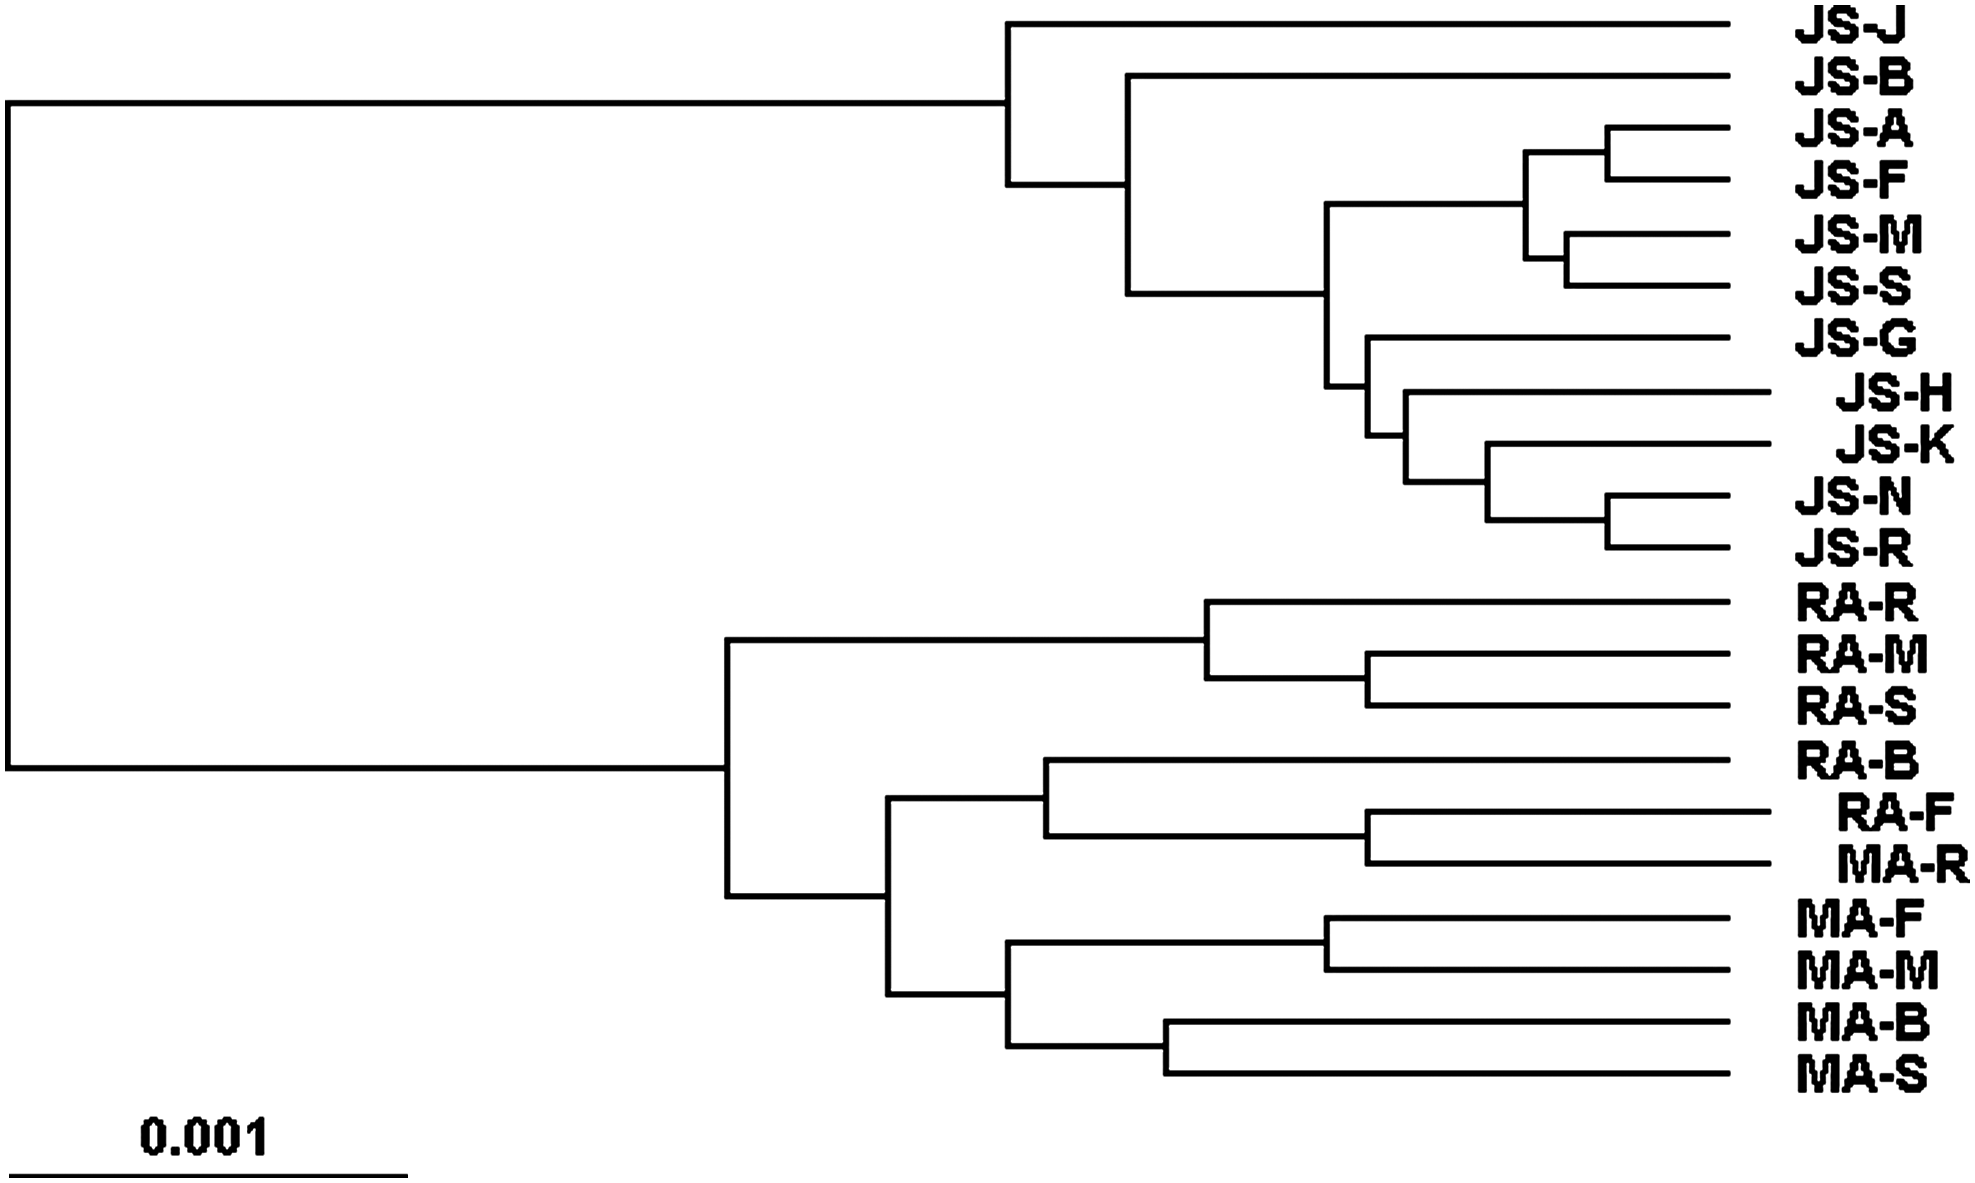
Dendrogram of 21 groups of Mazhabi, Ramdasi, and Jat Sikh populations of Punjab constructed from Nei's D matrix using the UPGMA method of clustering. JS-J, Jat Sikh, Jallandhar District; JS-B, Jat Sikh, Bhatinda District; JS-A, Jat Sikh, Amritsar District; JS-F, Jat Sikh, Ferozepur District; JS-M, Jat Sikh, Muktsar District; JS-S, Jat Sikh, Sangrur District; JS-G, Jat Sikh, Gurdaspur District; JS-H, Jat Sikh, Hoshiarpur District; JS-K, Jat Sikh, Kapurthala District; JS-N, Jat Sikh, Nawanshahr District; JS-R, Jat Sikh, Rupnagar District; RA-R, Ramdasi, Rupnagar District; RA-M, Ramdasi, Muktsar District; RA-S, Ramdasi, Sangrur District; RA-B, Ramdasi, Bhatinda District; RA-F, Ramdasi, Ferozepur District; MA-R, Mazhabi, Rupnagar District; MA-F, Mazhabi, Ferozepur District; MA-M, Mazhabi, Muktsar District; MA-B, Mazhabi, Bhatinda District; MA-S, Mazhabi, Sangrur District.
There were three subclusters in a dendrogram constructed using the NJ method (Fig. 3). First, Jat Sikh of Gurdaspur district separated in a single-line subcluster and another six groups of this caste form the second subcluster. In the third subcluster, two Jat Sikh groups delineated at an early stage of evolution, followed by the remaining two groups of this caste from Rupnagar and Hoshiarpur districts. The remainder of this subcluster encompassed all 10 groups of Mazhabi and Ramdasi. Thus, the NJ tree revealed little genetic affinity either between Jat Sikh and Sikh scheduled caste population groups or between groups of Mazhabi and Ramdasi, who tend to cluster separately.

Dendrogram of 21 groups of Mazhabi, Ramdasi, and Jat Sikh populations of Punjab constructed from Nei's D matrix using the NJ method of clustering. JS-G, Jat Sikh, Gurdaspur District; JS-A, Jat Sikh, Amritsar District; JS-B, Jat Sikh, Bhatinda District; JS-F, Jat Sikh, Ferozepur District; JS-S, Jat Sikh, Sangrur District; JS-M, Jat Sikh, Muktsar District; JS-J, Jat Sikh, Jallandhar District; JS-N, Jat Sikh, Nawanshahr District; JS-K, Jat Sikh, Kapurthala District; JS-R, Jat Sikh, Rupnagar District; JS-H, Jat Sikh, Hoshiarpur District; MA-B, Mazhabi, Bhatinda District; MA-M, Mazhabi, Muktsar District; RA-B, Ramdasi, Bhatinda District; MA-S, Mazhabi, Sangrur District; MA-F, Mazhabi, Ferozepur District; MA-R, Mazhabi, Rupnagar District; RA-F, Ramdasi, Ferozepur District; RA-R, Ramdasi, Rupnagar District; RA-S, Ramdasi, Sangrur District; RA-M, Ramdasi, Muktsar District.
Genetic admixture
The contention “the Indian lower castes are genetically more associated with the tribal populations than to the higher castes” (Thanseem et al., 2006) was evaluated in the context of Sikh lower castes of Punjab belonging to the Aryo-Dravidian physical type (Risley, 1915). For this analysis, a conglomerate of 16 autochthonous tribes of Central India, geographically nearest to Punjab, inhabiting states of Orissa, Madhya Pradesh, and Maharashtra (Fig. 1B) (Das et al., 1996), representing the Dravidian physical type and the present Jat Sikh of Punjab representing the Indo-Aryan physical type, “which approaches most closely to that ascribed to the traditional Aryan colonists of India” (Risley, 1915), were considered as parental populations of Mazhabi and Ramdasi.
Using average allele frequencies of the four common markers, viz. ABO, RH(D), ESD, and ACP1, in the Mazhabi, Ramdasi, and Jat Sikh populations of Punjab and Central Indian tribes (Table 14), genetic admixture estimates fitting a dihybrid model were calculated and the results are presented in Table 15. In case of Mazhabi, the major contribution came from Jat Sikh (67.42%), whereas in Ramdasi it was from Central Indian tribes (75.61%). Like Ramdasi, tribal contribution to Mazhabi gene pool was expected to be high, but apparently it has been offset by possible gene flow from Jat Sikh to the latter scheduled caste population because of their close proximity. Genetic admixture analysis, therefore, provided some evidence that lower strata of the Sikh population of the Punjab are more associated with Indian tribes than the Jat Sikh.
Values in parentheses are numbers tested.
Allele frequency data by Das et al. (1996).
Discussion
The Indian region as a whole is characterized by relatively high frequencies of ABO*B, usually somewhat exceeding those of ABO*A (Mourant et al., 1976). This was true also for the Punjab, for in each of the 21 Sikh groups considered, incidence of ABO*B was consistently higher than that of ABO*A. Complete absence or rather low frequencies of RH*d characterize tribes of India inhabiting its central (range: nil-0.1392) (Das et al., 1996), southern (range: 0.1459-0.1803) (Papiha et al., 1997), and eastern (range: 0.0928-0.1615) (Papiha et al., 1988) states. Indeed, there was a reflection of these values in the Mazhabi and Ramdasi populations of Punjab, both of which showed similar low incidence of the allele (combined range: 0.1078-0.2331; Tables 6 and 7), suggesting their tribal antecedents.
In comparison to the Jat Sikh, both the Mazhabi and Ramdasi were generally characterized by higher frequencies of ESD*2, PGM1*2, AK1*2, and GLO1*1 and lower frequencies of ADA*2 and ACP1*A. The frequency of ESD*2 found in the Mazhabi and Ramdasi groups of Punjab was comparatively high (combined range: 0.1893-0.3315; Tables 6 and 7) and similar to the high value of the allele recorded in tribes of central (range: 0.2448-0.3989) (Das et al., 1996), southern (range: 0.1687-0.3120) (Papiha et al., 1997), and eastern (range: 0.313-0.336) (Papiha et al., 1988) India. Likewise, there was similarity in ACP1*A frequency between the present Sikh scheduled caste groups (combined range: 0.2317-0.3547; Tables 6 and 7) and tribes of central (range: 0.1573-0.2905), southern (range: 0.1862-0.4643), and eastern (range: 0.219-0.234) India, all characterized by comparatively low value of the allele. The distribution of ACP1*C in India is essentially nontribal (Roberts et al., 1980) and the allele was not reported in any of 16 tribes of Central India (Das et al., 1996), three tribes of southern India (Papiha et al., 1997), and two tribes of eastern India (Papiha et al., 1988). Absence of ACP1*C in half of the Sikh scheduled caste groups (Tables 6 and 7) suggested their tribal affinities.
Genetic distance analysis demonstrated, first, little or no genetic affinities between the Jat Sikh and both the Mazhabi and Ramdasi and, second, little genetic relationship between the latter two Sikh scheduled caste populations, providing genetic base to the social stratification prevailing in the Sikh community of Punjab. The apparent similarities in allele frequencies noted in both serological (RH(D)) and biochemical (ESD and ACP1) markers between lower strata Sikh populations of Punjab and tribes of central, southern, and eastern India suggested some genetic affinities between them, and genetic admixture analysis indicated tribal origin of Ramdasi. Officially, presently there is no scheduled tribe inhabiting Punjab, but like the anthropometric and morphological observations, respectively, of Risley (1915) and Jammu (1996) on Mazhabi and Ramdasi suggesting a higher element of indigenous extraction in them, this study provided some genetic evidence to support the theory of aboriginal tribal signatures in the Sikh scheduled caste population of the state.
Conclusions
Social stratification in the contemporary Sikh population of Punjab has a genetic basis, primarily attributable to different ethnic backgrounds of different castes. This lends support to Risley's century-old dictum that caste has a racial basis. There is evidence also for a higher element of autochthonous tribal extraction in the lower strata of Sikh population.
Footnotes
Acknowledgments
S.M.S.C. gratefully acknowledges University Grants Commission, New Delhi, for award of a Research Scientistship “B” in Science and for funds for the project entitled “Genetic Differentiation in Punjab Populations” (grant no. F 7-28(Sc.)/88(SA-I)).
Disclosure Statement
No competing financial interests exist.