




Abstract
Autosomal recessive spinal muscular atrophy, the leading genetic cause of infant death, is due to loss of functional SMN1 genes, mainly as a result of homozygous deletions. Carrier frequency in the general population varies widely from 1/50 to 1/125 and has significant counseling implications. In a cohort of 210 patients with spinal muscular atrophy confirmed at the molecular level, 91.9% had a homozygous deletion and 14 were compound heterozygotes. Two novel point mutations were detected (c.524delC and c.734dupC) and the 11 bp duplication c.770_780dup was found at a high frequency. We describe the development of a simple and robust method for homozygous deletion detection, which enabled us to simplify the diagnostic workup. Further, carrier frequency in our population was established by direct quantification with the commercially available MLPA kit, following optimization for the use of dried blood spots as sample specimens.
Introduction
A
Survival motor neuron 1 (SMN1) is the only gene known to be implicated. It was mapped in 1990 (Brzustowicz et al., 1990; Melki et al., 1990) and identified in 1995 (Lefebvre et al., 1995).
SMN1 is located in a complex genomic area on chromosome 5q, which has a 500 kb inverted duplication. This region is very unstable and prone to intrachromosomal rearrangements such as deletions, duplications, and gene conversions. SMN1 has a highly homologous gene located in the inverted duplication, SMN2, which is unique to humans. It evolved to differ from SMN1 by five nucleotides, only one of which lies in the coding sequence (exon 7). This C>T change at position c.840 is a synonymous transition but disrupts the normal splicing of the gene, leading to an incomplete gene product, lacking exon 7, in the majority of SMN2 transcripts (∼90%). The mechanism behind this abnormal splicing is still debatable, but apparently it disrupts an exonic splice enhancer and creates an exonic splice suppressor (Cartegni and Krainer, 2002; Kashima and Manley, 2003; Cartegni et al., 2006).
The SMN1 gene is highly conserved from yeast to human and has a 1.7-kb transcript containing 9 exons (Lefebvre et al., 1995). It codes for a 38-kDa protein with 294 amino acids and is expressed in cytoplasm and nucleus of all somatic tissues, with predominance in spinal cord motor neurons (Battaglia et al., 1997; Coovert et al., 1997). It forms a complex with seven other proteins (gemins 2-8) that assembles seven Smith class core proteins on the uridine-rich small nuclear ribonuclear protein (snRNP) (Meister et al., 2001; Pellizzoni et al., 2002). Biosynthesis of snRNP is high in embryonic and postnatal phases and decreases after myogenic and neuronal differentiation. Deficient snRNP biogenesis appears to lead to motor neuron degeneration in animals (Winkler et al., 2005).
The reason behind motor neuron vulnerability remains elusive; however, at least three hypotheses have been proposed: (i) motor neurons have long axons and their unique role in neuromuscular junction interactions imply a lower threshold of SMN for normal functioning (Lunn and Wang, 2008); (ii) SMN presents an additional motor neuron-specific function, namely axonal transport of beta-actin mRNA (Todd et al., 2010); (iii) the axonal SMN isoform (a-SMN) is expressed selectively in motor neurons and its overexpression leads to increased axonogenesis (Setola et al., 2007).
About 94%-98% of clinically typical SMA cases are due to the homozygous absence of SMN1, as a result of either SMN1 gene deletions or conversions of SMN1 into SMN2 (Lefebvre et al., 1995; Ogino et al., 2002). The remaining cases are compound heterozygotes with a deletion and a point mutation (Burghes, 1997; Wirth et al., 1999) or even homozygotes for a point mutation. The normal alleles can have one or more copies of SMN1 paired with 0, 1, or more copies of SMN2. Absence of SMN2 is asymptomatic, because a single functional copy of SMN1 is sufficient for normal phenotypes (reviewed by Lunn and Wang, 2008). Disease alleles can have 0 SMN1 copies or one SMN1 with a point mutation paired with 0, 1, or more copies of SMN2. This raises the possibility of an unaffected individual with 2 SMN1 copies being a carrier, as both copies can be in cis (the 2 + 0 genotype). In some series, up to 4% of individuals with 2 SMN1 copies present this genotype (McAndrew et al., 1997).
The recurrence risk for a couple with a previous affected child is 25% and carrier cascade testing is warranted for relatives at risk. Genetic counseling issues arise for couples comprising a known carrier and an unrelated partner. It is important that specific population/ethnic carrier frequencies be used as a complement to SMN1 dosage, to estimate recurrence risk.
These counseling issues prompted the present work described herein. Details are provided on new methodologies and approaches that were introduced for SMA diagnosis and carrier frequency estimation.
Materials and Methods
Detection of homozygous SMN1 deletions
A new polymerase chain reaction (PCR)-based methodology was developed for the detection of homozygous SMN1 deletions. Initially, we conducted a search for commercially available restriction enzymes that specifically distinguish SMN1 and SMN2, recognizing sequence differences at exons 7 and 8 of these genes: c.840C/T (exon 7) and c.*237G/A (exon 8). The selected enzymes were Hpy188I (NEBiolabs, Beverly, MA) for the exon 7 assay and BfiI (Fermentas, Burlington, Canada) for exon 8. Primers were designed for genomic DNA (gDNA) amplification based on the restriction site location (Table 1). These primers, which amplify SMN1 and SMN2 simultaneously, all bind to noncoding regions—in adjacent introns (for the exon 7 PCR) and in the 3′UTR (for the exon 8 PCR). As in the vicinity of c.*237 in exon 8 there is no second restriction site for BfiI, the reverse primer included an artificial tail with a sequence recognizable by this enzyme, to serve as an internal digestion control. Forward primers were labeled with distinct fluorochromes: 6FAM (exon 7) and NED (exon 8), allowing multiplexed reactions with simultaneous detection in an automated capillary electrophoresis sequencer. In each experiment, a blank, a positive control, and a negative control were used. PCR mixture was prepared using 10 μL of PCR Master Mix (Promega, Madison, WI), 7 μL of water, 1 μL of each primer at 10 pmol/μL, and 1 μL of gDNA at 100 ng/μL. Amplification was performed according to the following settings: 95°C for 5 min; 38 cycles: 95°C, 55°C, and 72°C for 30 s each; final extension step: 72°C for 10 min. A 4 μL aliquot of the PCR mixture was digested with 5 U Hpy188I and 4 U BfiI. Digestion products were subsequently separated by capillary electrophoresis on an ABI 3130xl DNA analyzer (Applied Biosystems, Foster City, CA), according to the manufacturer's instructions.
Square brackets indicate labeled fragments.
SMN1-specific fragment.
SMN2-specific fragment.
Restriction site generated by sequence in primer tail (underlined sequence).
PCR, polymerase chain reaction.
SMN1 copy number quantification
Quantification of SMN1 copies in patients without homozygous deletions and in potential carriers was performed using the MLPA kit P021-A1 (MRC-Holland, Amsterdam, The Netherlands). An in-house validation assay consisted of individuals from previously studied families in which the SMN1 genotype had been inferred from analysis using linked microsatellite markers. Data analysis was aided by GeneMarker software V1.51 (Softgenetics, State College, PA). The population method was chosen for MLPA normalization, which allows intralane peak adjustment. The analysis method was based on T-distribution regression model using a 99.0% confidence limit. In each experiment, five DNA samples of individuals with two SMN1 copies were combined and used as a synthetic control. A previously tested control sample with one copy was also used to ensure test consistency.
Detection of c.770_780dup mutation
The screening of the c.770_780dup in exon 6 at the gDNA level was performed by fluorescence primed PCR using the following primers: forward ex6F (5′-CAAGACCTCGTCTTTGTTTAGGG-3′) labeled with HEX and reverse ex6R (5′-TCAGGAAAAGATGCTGAGTGATTAC-3). Amplification conditions were as described for the exon 7 and 8 assays. Fluorescent products were detected on an ABI 3130xl DNA analyzer (Applied Biosystems). The 11 bp duplication was readily distinguished by capillary electrophoresis. The mutation was also confirmed by direct genomic sequencing (see the next section).
Further characterization at the cDNA level was necessary to demonstrate that this change was present in the SMN1 and not the SMN2 gene. Briefly, RNA extracted from peripheral blood was subjected to reverse transcriptase-PCR (RT-PCR) using SuperScript One-Step (Invitrogen, Carlsbad, CA) and primers c.4F (5′-TGG ACC TCT TTT CTC CCT CCA CC-3′) labeled with 6FAM and c.8R (5′-TCA TTT AGT GCT GCT CTA TGC CAG-3′). The resulting PCR products were digested with Hpy188I, which specifically cuts SMN1 transcripts, and resolved by capillary electrophoresis.
SMN1/2 genomic sequencing
SMA patients with one SMN1 copy and negative for c.770_780dup mutation were subjected to SMN1 and SMN2 gene sequencing using M13 tailed primers (sequences available upon request). The eight SMN exons and the flanking intronic regions were cycle-sequenced using the BigDyeTM Terminator Cycle Sequencing Kit V1.1 and the products were resolved on an ABI PRISM 3130xl Genetic Analyzer (Applied Biosystems). Sequencing data analysis was aided by the SeqScape V2.5 software (Applied Biosystems) using the reference cDNA sequence filed under GenBank accession number NM_000344.3.
Estimation of SMA carrier frequency
A subset of 350 samples were randomly selected from an original cohort of 2000 dried blood spots (DBS), originally collected for the National Neonatal Screening Program and statistically representative of the Portuguese population (Lacerda et al., 1994).
Three different DNA extraction methods were evaluated to determine the most adequate for quantitative MLPA studies: ReadyAmp Genomic DNA Purification System (Promega), EZ1 DNA Dried Blood Card kit for BioRobot EZ1 (Qiagen, Valencia, CA) and treatment of the DBS with FTA purification reagent (Whatman, Florham Park, NJ). The ReadyAmp protocol was found to provide the best results (Supplementary Fig. S1; Supplementary Data are available online at www.liebertonline.com/gtmb) and was therefore chosen for this part of work.
MLPA kit P060 SMA carrier (MRC-Holland) was preferred over MLPA kit P021 SMA because it has fewer probes, and therefore, less DNA sample is needed to obtain satisfactory results. MLPA analysis was prevalidated for the DBS extracts using 16 controls (with known SMN1 copy number) obtained via the same DNA extraction protocol. Data analysis was aided by the GeneMarker software, using the MLPA ratio method. The results indicated a cutoff value of 0.56 ± 0.04 for one SMN1 copy (exon 7) and 1.14 ± 0.05 for two SMN1 copies (exon 7), which means that maximum values were on average 0.60 and 1.19. To have clear cutoffs and to avoid false-negative results, these values were incremented by one standard deviation (0.05). Accordingly, results for SMN1 exon 7 and 8 probes above 1.25 and below 0.65 thresholds were considered abnormal.
Assays were set up in batches with 22 test samples from the DBS collection plus three previously genotyped control samples (1 × , 2 × , and 3 × copies of SMN1 exon 7). All samples were crossed against each other as reference samples. Samples with increased or reduced signals for exons 7 and 8 were retested together with three controls with 2 SMN1 copies (used as reference samples), one control with one copy and one control with three copies. Inconsistency rates (5.1% for 1xSMN1 and 9.0% for 3xSMN1) were calculated by dividing the number of samples with discrepant results by the total number of samples tested. Only samples with consistent results in the two experiments were considered valid for frequency calculations.
Results and Discussion
New methodology for detection of homozygous SMN1 deletions
A total of 531 Portuguese patients had been referred for SMN1 gene analysis. Mutations were found only in approximately 40% (n = 209) of these patients, reflecting the presence of many cases referred without the clinical inclusion criteria for DNA studies and cases referred for diagnostic exclusion. Table 2 summarizes the molecular defects in this group of patients. Homozygous deletion of exons 7 (91.9%) and 8 (90.4%) were, as expected, the most frequent cause of SMA.
Frequency within the patient cohort.
Mutations described using nomenclature according to den Dunnen and Antonarakis (2000); reference cDNA sequence: NM_000344.3.
Considering the high prevalence of this molecular defect in SMA patients, we developed a fast and simple detection method for homozygous SMN1 deletions, based on differential enzymatic restriction of fluorescence-labeled PCR products with subsequent resolution by capillary electrophoresis. The only two base differences between the open reading frames of SMN1 and SMN2 (c.840C>T in exon 7 and c.*237G>A in exon 8) were exploited to enable their distinction using restriction enzymes Hpy188I (for exon 7) and BfiI (for exon 8), both of which specifically cut the SMN1 gene sequence (details in Materials and Methods section). Previously genotyped samples (negative and positive controls) were retested to validate this methodology (results shown in Fig. 1). Homozygous SMN1 deletion is easily recognizable by the absence of two peaks: 117 bp labeled with NED corresponding to SMN1 exon 8, and a 136 bp peak labeled with 6FAM corresponding to exon 7. Individuals with zero SMN2 copies do not have the peaks of 244 bp (exon 8) and 275 bp (exon 7). As at least one additional restriction site is present in both SMN genes, successful/complete digestion can be monitored so as to avoid false-positive or -negative results. This method was tested in DNA samples obtained from different biological sources (e.g., blood, amniotic fluid, DBS, chorionic villi) and at different concentrations (range: 20-100 ng/μL).

Novel SMA diagnostic method, which allows the detection of homozygous SMN1 gene deletions. Digestion products are shown. Smaller fragments correspond to SMN1 (117 bp for exon 8 and 136 bp for exon 7) and larger fragments correspond to SMN2 (244 bp for exon 8 and 275 bp for exon 7).
The well-established and broadly used methodologies for molecular diagnosis were reported in the SMA best practice guidelines published in 2001 (Scheffer et al., 2001). The two methods consisted in a first PCR-based amplification step followed by (i) SSCP analysis on polyacrylamide or MDE gels (Lefebvre et al., 1995) and (ii) restriction enzyme digestion using DraI or HinfI (exon 7) and DdeI (exon 8) for SMN1 and SMN2 differentiation (van der Steege et al., 1995; Wirth et al., 1999). However, as the first one is very time-consuming and the second one presents technical difficulties such as incomplete digestion, alternative methods have since been proposed, namely denaturing high-performance liquid chromatography (dHPLC) (Sutomo et al., 2002), allele-specific PCR (Simsek et al., 2003), MLPA (Arkblad et al., 2006; Scarciolla et al., 2006), liquid microbead arrays (Pyatt et al., 2007), and high-resolution melting curve analysis (Chen et al., 2009). All of these techniques have acceptable sensitivity and specificity rates and circumvent some false-positive results obtained in patients with point mutations (Eggermann et al., 2008; Kang et al., 2009). However, in general, these methods are not easily transposable to all laboratories that offer SMA diagnosis as a routine service. The homozygous deletions of SMN1 can be screened by a rapid, inexpensive, and reproducible way using the PCR-restriction fragment length analysis (PCR-RFLA) method described in the present work. This approach should be equally effective using high-resolution gels instead of capillary electrophoresis.
SMN1 gene analysis reveals novel mutations
In the majority of the remaining cases, an intragenic mutation was detected in the SMN1 gene. In particular, an 11 bp duplication in exon 6 (c.770_780dup) reported for the first time by Parsons et al. (1996) was the most frequent intragenic mutation in our group of patients (a total of 14 unrelated patients; Table 2). Given its frequency, we developed a rapid fluorescence primed PCR screening method (Fig. 2A). A complementary strategy with analysis at the cDNA level was developed for validation of this mutation, allowing SMN1/SMN2 differentiation. Amplification of SMN transcripts from exons 4 to 8 (Fig. 2B) in control and patients with c.770_780dup, generates several peaks including the normal full-length isoform (349 bp), the mutated PCR product (359 bp), and an additional peak with 290 bp corresponding to the Δ7 isoform. Using the restriction enzyme Hpy188I, which specifically cuts SMN1 at position c.840C, it is possible to demonstrate that the duplication is in the active SMN gene. Digestion of a sample from a positive case generates a 283-bp fragment corresponding to the full-length transcripts with the c.770_780dup (Fig. 2C).
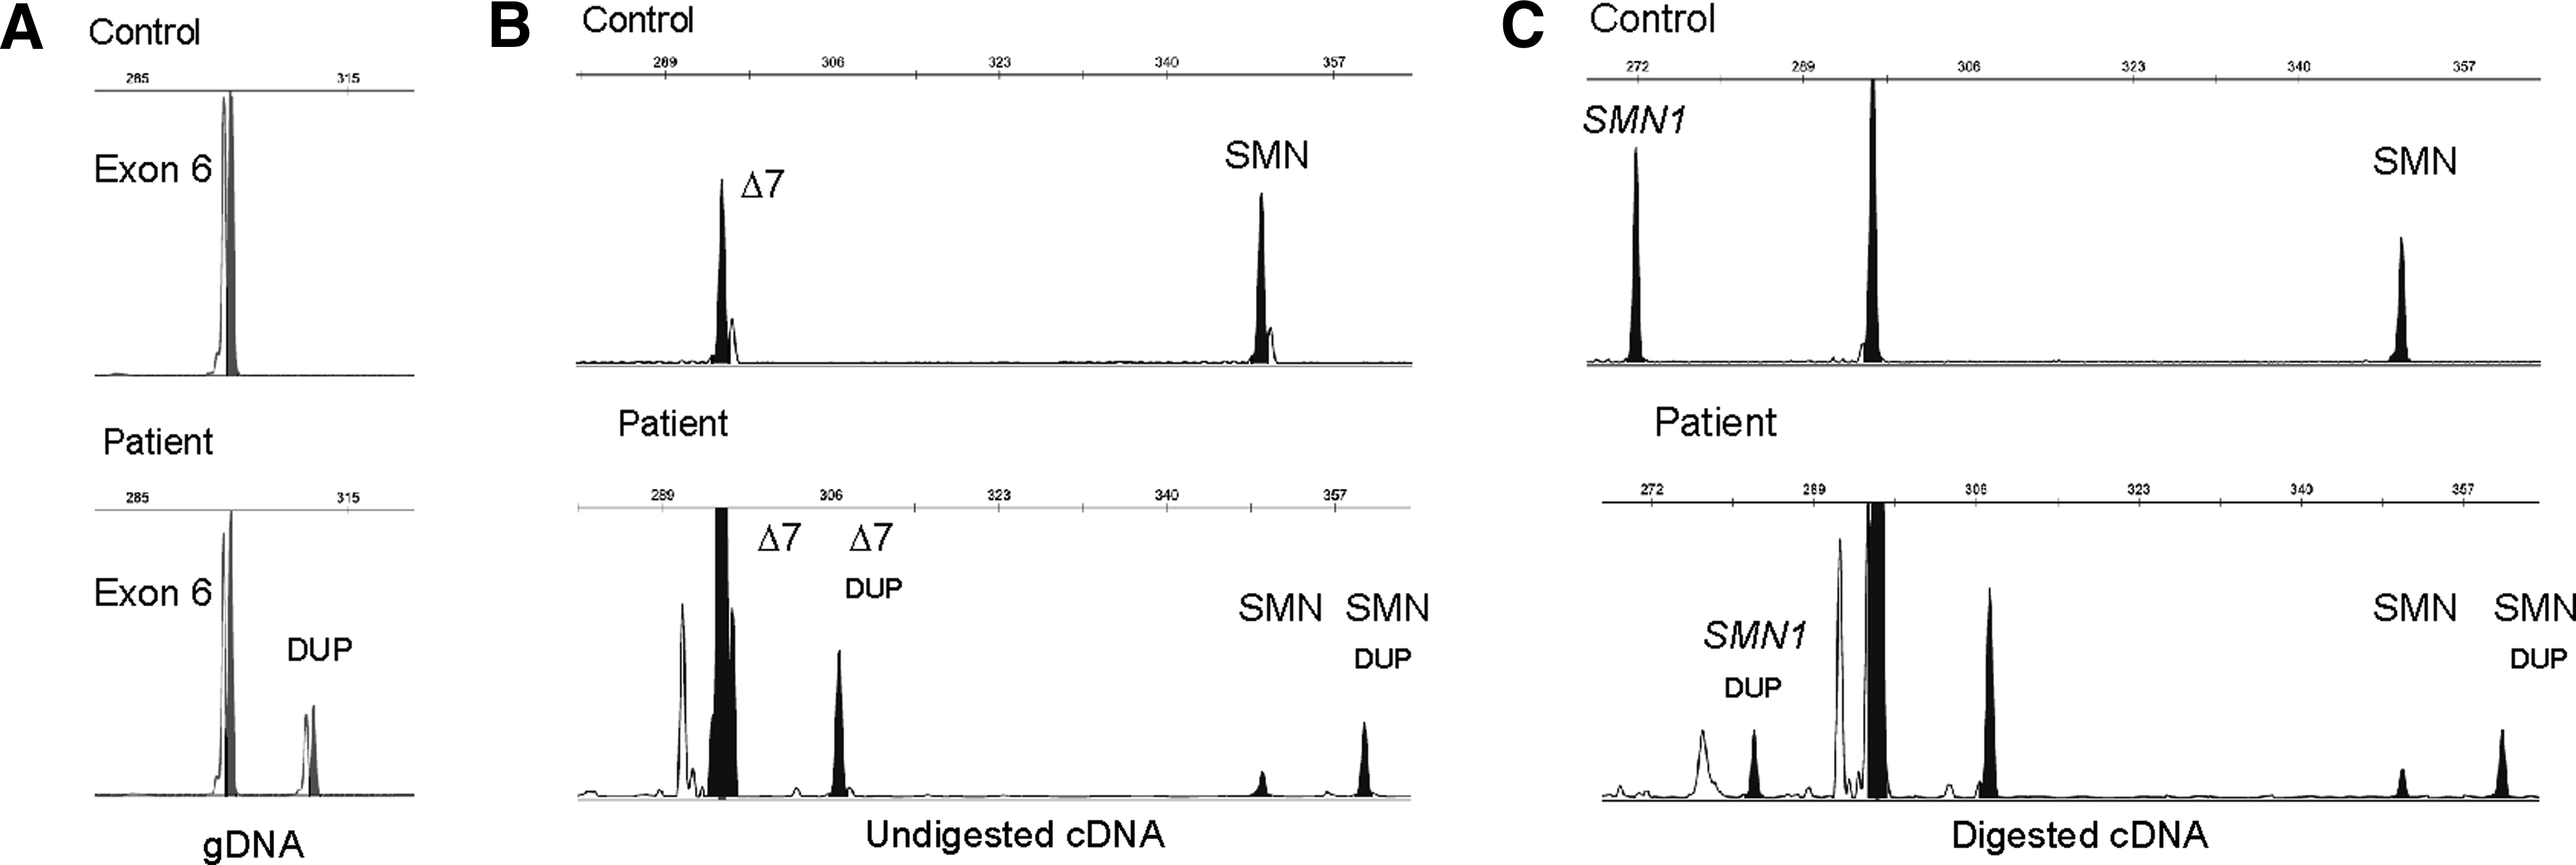
Techniques for detection of the c.770_780dup in exon 6 of SMN1.
Additionally, two novel truncating mutations were identified in SMA patients (Table 2): c.524delC (p.Ser175PhefsX38) in exon 4 and c.734dupC (p.Pro246ThrfsX10) in exon 6. Quantitative studies performed by MLPA in these patients and respective parents revealed the absence of SMN1 gene (exons 7 and 8) in the paternally inherited alleles, thereby confirming compound heterozygosity in the patients.
The other mutation found in our patient cohort, c.346A>T (p.Ile116Phe), had been previously reported, which affects a conserved residue within the Tudor domain of the SMN protein (Cuscó et al., 2004).
Until now, at least 54 point mutations in SMN1 were described in the literature (reviewed by Alías et al., 2009). Besides adding two more frameshift mutations to this list, our report describes methodologies that facilitate the detection and validation of the c.770_780dup mutation, which is one of the three most frequent point mutations reported in the literature (Parsons et al., 1996, 1998; Martín et al., 2002; Clermont et al., 2004; Alías et al., 2009).
Estimation of SMA carrier frequency and risk assessment
Another part of this work consisted in determining the frequency of SMA carriers in Portugal. This estimate is primordial for SMA genetic risk assessment and, therefore, for genetic counseling purposes. Considering the potential legal and ethical aspects, we decided to use surplus DBS samples from the Portuguese Neonatal Screening Program. These were used for DNA source and SMN1 dosage analysis was performed by MLPA technique. To evaluate the effectiveness of this approach, a validation assay was performed using DBS from previously genotyped individuals: homozygous SMN1 deletions (n = 2), one SMN1 copy (n = 6), two SMN1 copies (n = 6), three SMN1 copies (n = 1), and four SMN1 copies (n = 1). MLPA analysis using the P060 kit was 100% concordant with previous results. The values obtained with the SMN1 exon 7 and 8 probes (Supplementary Table S1) were used to establish experimental cutoffs: <0.65 for one SMN1 copy and >1.25 for three or more copies.
Of the 350 samples representative of the population, 18 were excluded for low quality, resulting in a pick-up rate of 94.9% (332 of 350). In six samples, one SMN1 copy was detected (Fig. 3A): five encompassing both exons 7 and 8, and one only for exon 7. This gives an overall frequency of 1.8% (1/55) for SMN1 deletion carriers. The frequency of individuals with three or more SMN1 copies (Fig. 3B) was 5.4% (1/19). Using the data from the quantitative study and the frequency of SMA patients with point mutations or homozygous SMN1 deletions, it was possible to estimate the allelic and genotype frequencies of SMN1 alleles in the general population (Table 3). The approach previously described by Ogino and collaborators (2002, 2004) was used for these calculations. The SMN1 allele frequencies are “a” (0 copies) =0.93%, “b” (1 copy) = 96.42%, “c” (2 copies) = 2.60%, and “d” (1D—allele with point mutation) = 0.04%. The overall SMA carrier frequency, considering the aggregation of all carrier genotypes (2cd + 2ac + 2bd + 2ab), is 1.93% (1/52). Using the Bayesian analysis, it was then possible to calculate the risk of an individual with two SMN1 copies being an SMA carrier (i.e., 1/791).
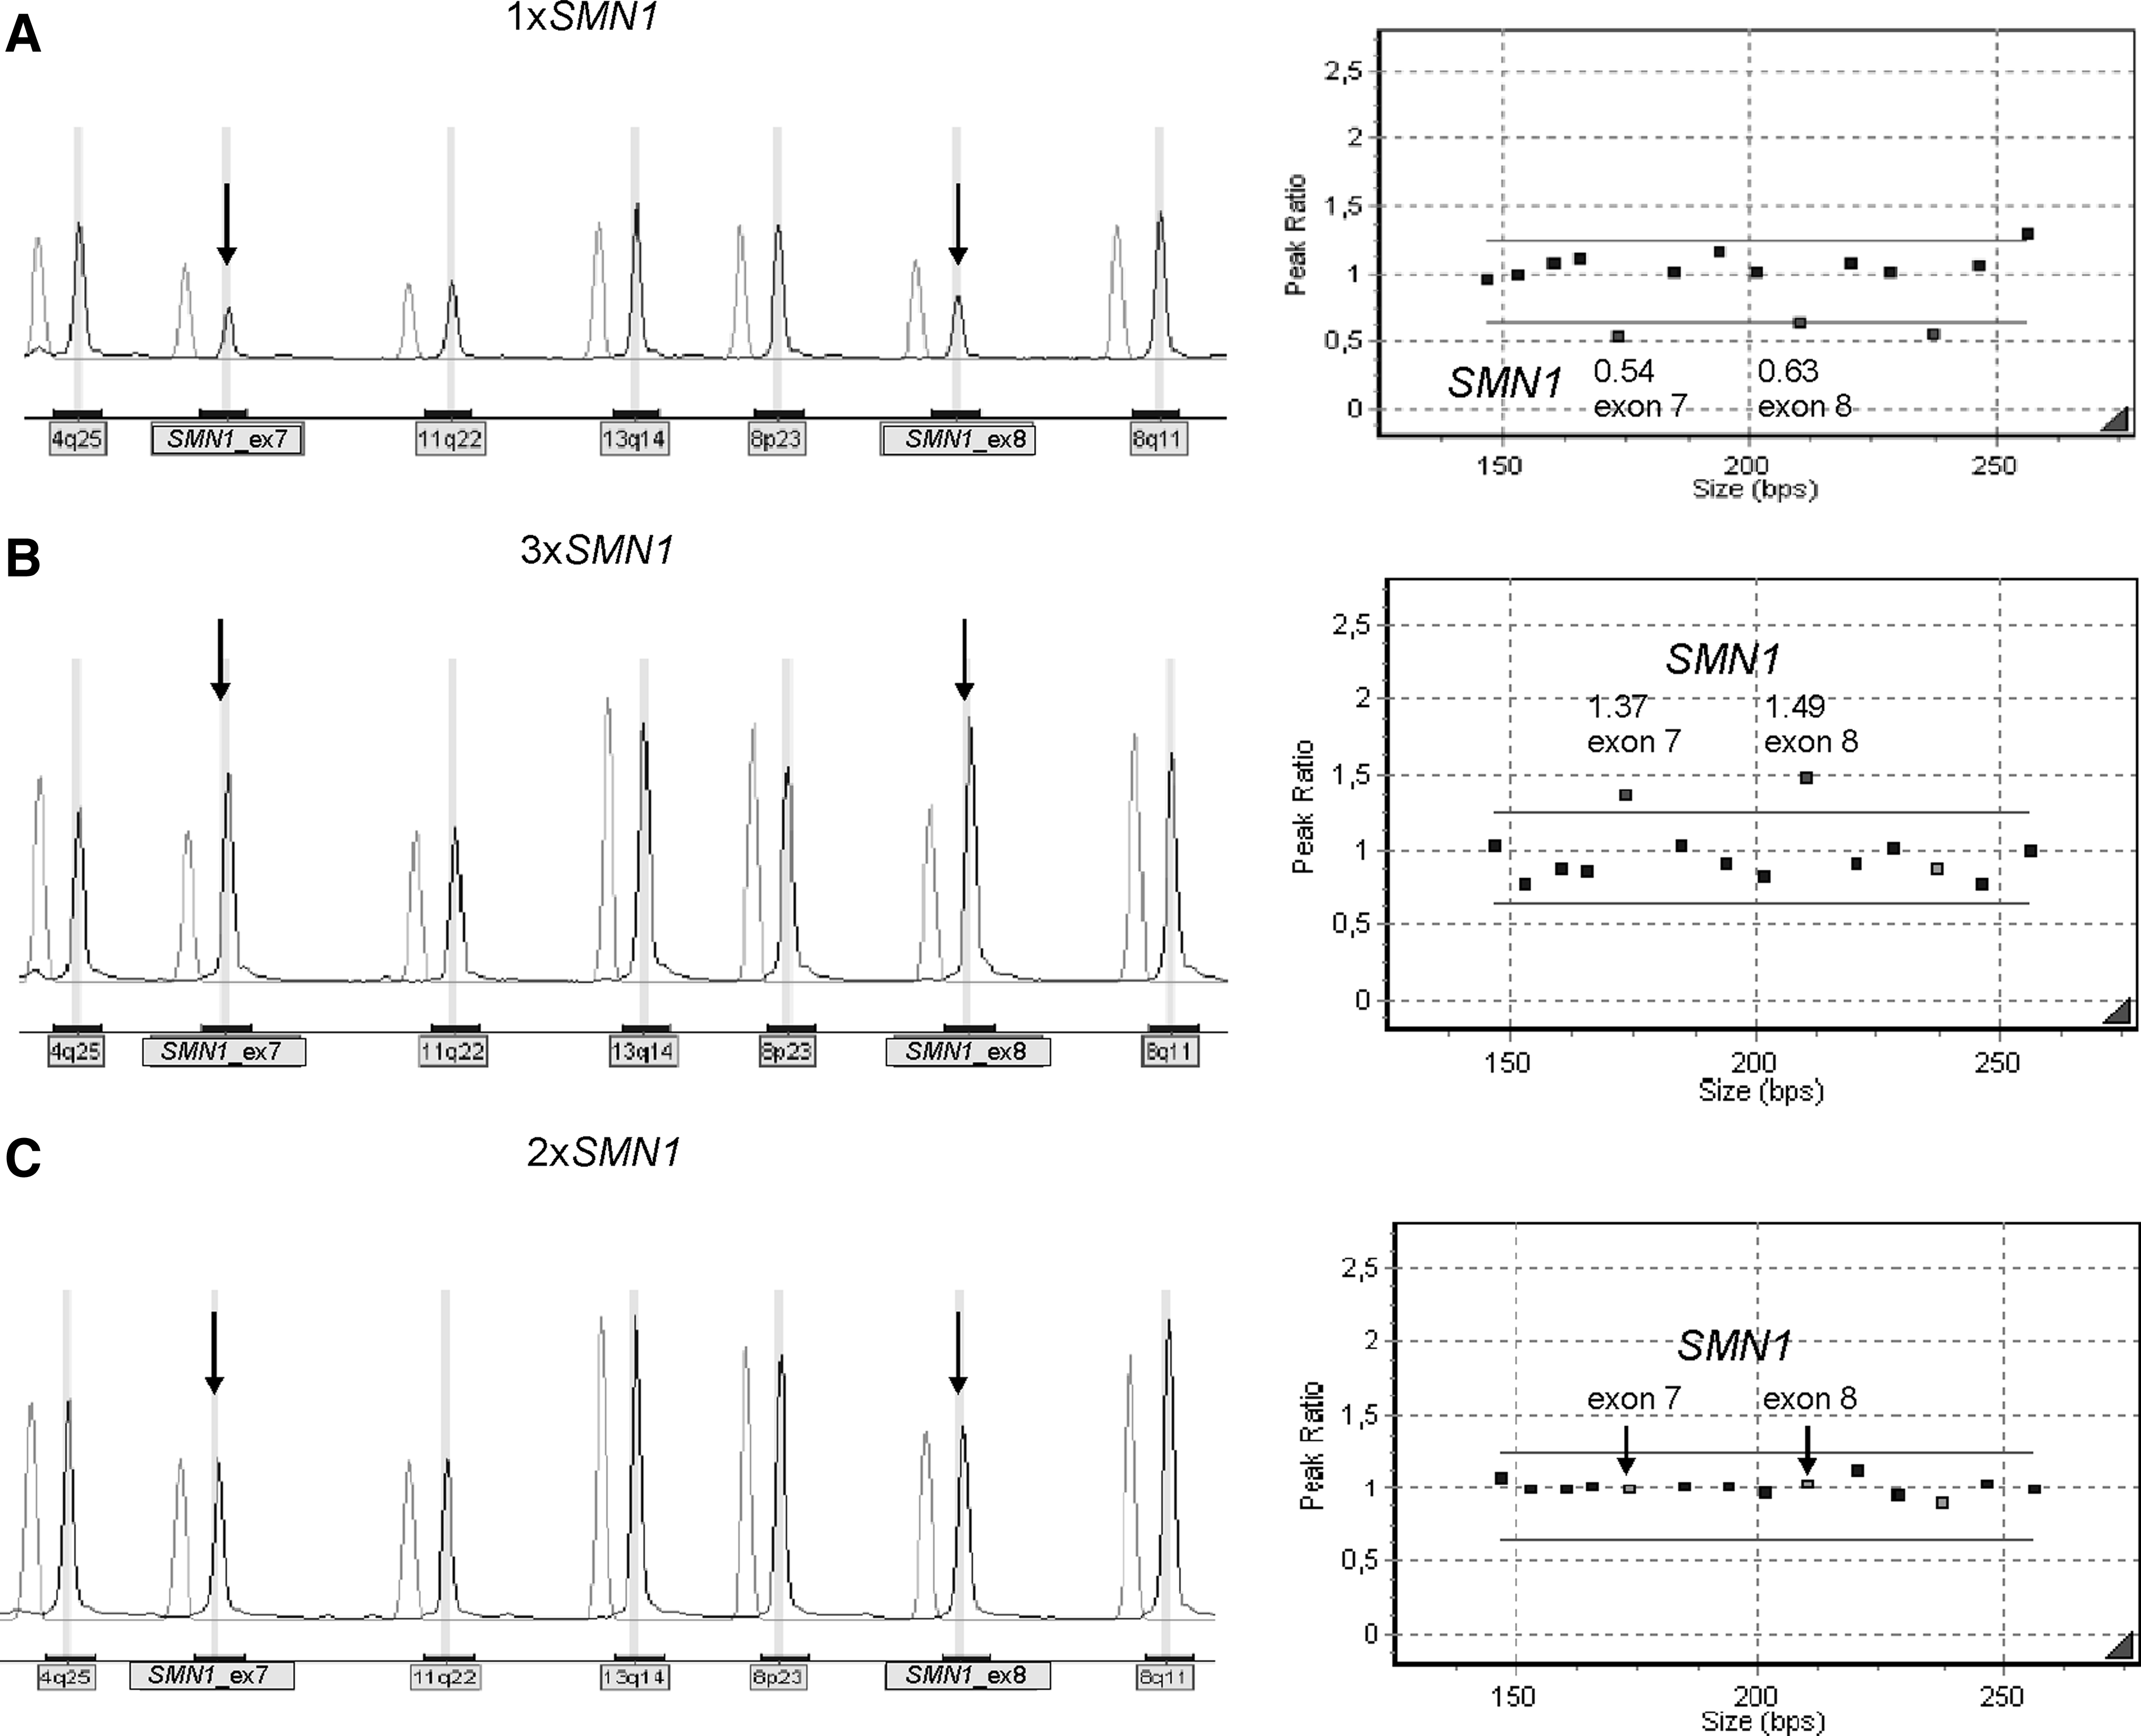
Example of MLPA results obtained from the population screen for SMA carrier estimates.
1D indicates SMN1 allele with a point mutation.
Genotype is indicated by “(number of SMN1 copies on one chromosome 5) + (number of SMN1 copies on the other chromosome 5).”
Different population screening methods have been used by other groups. These include quantitative PCR with fluorescence-labeled primers (Chen et al., 1999; Ogino et al., 2001), a two-step PCR with primer extension and subsequent competitive PCR (Gérard et al., 2000), and quantitative real-time PCR (Smith et al., 2007; Hendrickson et al., 2009). All these groups used quantification methods directed only at exon 7. As the majority of deletions encompass both exons 7 and 8, quantifying exon 8 provides another internal control in the majority of samples studied.
The main aspects to consider in a population screen are that the method should be robust, easy to perform, and cost effective. As the objective in this case is SMN1 dosage analysis, it requires a method that clearly distinguishes between the different number of copies with nonoverlapping value ranges. The widely used MLPA technique fulfilled all of these requirements and was therefore the method of choice.
There are a few reports on the use of MLPA in DNA extracted from DBS, but all perform a genome-wide DNA amplification prior to the quantification step. In our case, sufficient DNA was obtained from the DBS, which had been stored for over 16 years, at room temperature, and no amplification was required before quantification; MLPA was performed directly on the extracted samples, using the commercially available kit. A carrier frequency of 1/52 was established for the Portuguese population, which is inferior to that reported in other European and North American Caucasians (1/34 and 1/35, respectively) (Cusin et al., 2003; Ogino et al., 2004) and about twice as high as that of the North American Hispanics (1/117) (Hendrickson et al., 2009).
These SMA carrier frequency calculations all assume that the populations are in Hardy-Weinberg equilibrium. However, there are well documented distortions to this equilibrium in SMA, such as de novo rearrangements in this locus, which account for approximately 2% of SMA cases (Wirth et al., 1997), and transmission ratio distortion, favoring SMN1 wild-type alleles, as has been observed by Botta and coworkers (2005). The influence of these factors needs to be considered in the genetic counseling context.
Footnotes
Acknowledgment
The authors thank Dr. Lúcia Lacerda for providing the DBS collection.
Disclosure Statement
No competing financial interests exist.
References
Supplementary Material
Please find the following supplemental material available below.
For Open Access articles published under a Creative Commons License, all supplemental material carries the same license as the article it is associated with.
For non-Open Access articles published, all supplemental material carries a non-exclusive license, and permission requests for re-use of supplemental material or any part of supplemental material shall be sent directly to the copyright owner as specified in the copyright notice associated with the article.
