




Abstract
Aim: MicroRNAs (miRNAs) regulate the expression of many genes and may be involved in regulating the immune response. Expression of microRNA 146a (miRNA 146a) in peripheral blood mononuclear cells was studied by real-time polymerase chain reaction in 70 patients with rheumatoid arthritis (RA), 45 patients with knee osteoarthritis (OA), and 60 healthy controls. Disease activity of RA was assessed using disease activity score (DAS) 28 and physical disability using the Improved Health Assessment Questionnaire. Results: miRNA 146a expression was significantly higher in patients with RA than in those with OA and in controls (p<0.0001) but did not differ between the latter two groups (p=0.06). Tumor necrosis factor-alpha (TNF-α) was significantly higher in RA than in OA and controls (p<0.0001) and in OA than controls (p=0.001). In patients with RA, miRNA 146a positively correlated with TNF-α (p=0.0003), erythrocyte sedimentation rate (ESR) (p=0.022), and DAS 28 (p=0.009). miRNA 146a expression did not differ between patients with RA receiving anti TNF-α and those receiving conventional therapy (p>0.05). Conclusion: miRNA 146a expression is upregulated in patients with RA and may be a potentially useful marker of disease activity in these patients. Lack of overexpression of miRNA 146a in the presence of increased TNF-α in OA requires further investigation.
Introduction
R
Although several genetic factors have been described in relation to the pathogenesis of RA, their overall contribution to the development of the disease is quite modest (Deighton and Criswell, 2006). It was suggested that epigenetic modifications, which control gene expression independent of alterations in the DNA sequence, might influence both the susceptibility to RA and disease severity (Strietholt et al., 2008; Karouzakis et al., 2009; Trenkmann et al., 2010).
MicroRNAs (miRNAs) are small noncoding RNA molecules (18-22 nucleotides long) that regulate gene expression at the post-transcriptional level. miRNAs are transcribed in the nucleus, forming long, primary miRNAs. These precursors are then cleaved into mature miRNAs that bind the 3′-untranslated region of target messenger RNA (mRNA) and promote translational repression or degradation of the mRNA (Denli et al., 2004; Mendell, 2005). miRNAs regulate about 30% of the human genes and are known to influence several cellular processes such as cell cycle regulation and apoptosis (Lindsay, 2008). In addition, rapidly accumulating data suggest a role for miRNAs in the regulation of immune responses and the development of autoimmunity (Brooks et al., 2010; Furer et al., 2010).
The human genome contains two miRNA146 genes: MIRN146A and MIRN146B. MIRN146A, which encodes miRNA146a, is located within exon 2 of the LOC285628 gene on the long arm of chromosome 5. Evidence from in vitro studies suggests that miRNA 146a expression is upregulated by proinflammatory cytokines and that this miRNA plays an important role in the negative feedback control of inflammatory responses (Taganov et al., 2006). Pauley et al. (2008) reported that the expression of several miRNA molecules, including miRNA 146a, was upregulated in peripheral blood cells from patients with RA.
Based on these data, the present work was carried out to study the expression of miRNA 146a in peripheral blood of patients with RA and compare it with its expression in patients with osteoarthritis (OA) and healthy controls. The association of miRNA 146a expression with the various clinical and laboratory features of the studied patients was also investigated.
Materials and Methods
Subjects
The study was carried out on 70 patients (64 women and 6 men) with RA recruited from the outpatient clinics of the Department of Physical Medicine, Rheumatology, and Rehabilitation and the Rheumatology Unit of the Internal Medicine Department at the Main Alexandria University Hospital. All patients with RA fulfilled the American College of Rheumatology (ACR) classification criteria (Arnett et al., 1988). In addition, a group of 45 female patients fulfilling the ACR classification criteria of knee OA was also included (Altman et al., 1986). The control group consisted of 60 healthy women. All subjects included in the study were chosen to be free from diabetes, renal, hepatic, or malignant disease to exclude the potential influence on miRNA expression pattern.
Informed consent was obtained from all subjects, and the study was approved by the ethics committee of the Faculty of Medicine, Alexandria University.
Methods
Clinical assessment
In all patients with RA, detailed history was obtained including disease duration, morning stiffness, smoking habits, family history of RA, or other rheumatologic disease. All patients were clinically assessed for the presence of extra-articular involvement. Disease activity was defined by the disease activity score (DAS) 28 (Balsa et al., 2004) and physical disability by the Improved Health Assessment Questionnaire (HAQ) (Kirwan and Reeback, 1986). The types of medications received were also recorded. Patients with knee OA had full history, taking clinical examination and plain knee radiographs. Radiologic grading of knee OA followed the Kellgren-Lawrence grading system (Kellgren and Lawrence, 1957).
Laboratory investigations
Blood sampling: Ten milliliters venous blood were collected from each subject. Four milliliters were delivered into EDTA tubes for miRNA extraction and tumor necrosis factor-alpha (TNF-α) assay and 1.6 mL into sodium citrate tubes for erythrocyte sedimentation rate (ESR). The rest of the blood was left to clot, and the obtained serum was used for rheumatoid factor (RF) and anti-cyclic citrullinated peptide (anti-CCP).
The following laboratory tests were carried out for all subjects: ESR by Westergren method, RF by immunonephelometry (BN Prospec system; Siemens Healthcare Diagnostics), anti-CCP by an ELISA method using the ImmuLisa™ Cyclic Citrullinated Peptide kit (IMMCO Diagnostics, Inc.). Plasma TNF-α was measured by an enzyme immunoassay using the TiterZyme® EIA human TNF-α Kit (Assay Designs; Enzo Life Sciences International).
Quantification of miRNA 146a expression in peripheral blood mononuclear cells
miRNA extraction from peripheral blood mononuclear cells
Peripheral blood mononuclear cells (PBMCs) were isolated from fresh venous blood samples collected in EDTA using Ficoll density-gradient centrifugation. miRNA extraction from PBMCs was performed using the mirVana™ miRNA Isolation kit, Ambion, Inc., purchased from Applied Biosystems. Samples were first lysed in a denaturing lysis buffer that stabilizes RNA and inactivates RNAases. The lysate was then extracted with acid-phenol: chloroform. RNA samples were further purified by passing through columns containing glass fiber filters that immobilize RNA. This was followed by two sequential filtrations through glass fiber filters using different ethanol concentrations that allowed separation of small RNA molecules from large RNA. The eluate containing miRNA was stored at −20°C until processed within 2 weeks.
Quantification of miR146a expression using the TaqMan miRNA assays was done using two-step reverse transcription-polymerase chain reaction
(1) In the reverse transcription step, miRNA was reverse transcribed into cDNA using the TaqMan® MicroRNA reverse transcription kit (Applied Biosystems). Following manufacturer's instructions, two tubes were set up for each subject: one containing primer for miR146a and the other containing primer for RNA U6 small nuclear 2 gene (RNU6B), which was used as a reference gene. Thermal cycling was performed on the Techne Progene thermal cycler (Techne) using the following thermal profile: 16°C (30 min), 42°C (30 min), and 85°C (5 min).
(2) miRNA 146a expression was quantified by real-time polymerase chain reaction (PCR) performed on the Mx3000P™ Real-Time PCR System (Stratagene). TaqMan MicroRNA Assay (Applied Biosystems) was used. Reagents included forward and reverse primers and an miRNA-specific TaqMan minor groove binder probe. The TaqMan MicroRNA assay ID for miRNA146a was 002163 and for Rnu6B, 001093. For each subject, two separate tubes were set up for miRNA146a and Rnu6B expression. Real-time PCRs were carried out in a 20 μL volume containing 1× TaqMan® universal master mix, 1× TaqMan MicroRNA Assay, and cDNA. Thermal profile was as follows: an initial denaturation step at 95°C for 10 min, followed by 40 cycles at 95°C for 15 s (denaturation step), and at 60°C for 1 min (annealing/extension step). miRNA 146a expression was normalized to RNU6B and quantified by the comparative Ct method using the formula 2−ΔΔCt where Ct is the threshold cycle corresponding to the PCR cycle number at which fluorescence emission reaches a threshold above baseline emission (Livak and Schmittgen, 2001).
Statistical analysis
Data were analyzed using StatView software version 5.1 for Windows (SAS). Due to the skewed distribution of data, nonparametric tests were used. Kruskal-Wallis and Mann-Whitney tests were used to compare continuous variables in the studied groups. Spearman's rho correlation test was used to study the relation between continuous variables. Statistical significance was considered at a p-value <0.05.
Results
The demographic, clinical, and laboratory data of all subjects are summarized in Table 1. In the group of patients with RA (n=70), eight patients (11.4%) had nodular disease, and six (8.6%) had additional extra-articular manifestations. Four patients (5.7%) were smokers, and family history of rheumatologic disease was reported by 16 patients (22.8%). According to DAS 28, mild disease activity was present in 4 patients (5.7%), whereas 20 patients (28.6%) had moderate disease activity, and 46 (65.7%) had severe disease. Sixty patients with RA (85.7%) were under current treatment with single or combined disease-modifying anti-rheumatic drugs (DMARDs) including methotrexate, leflunomide, azathioprine, sulfasalazine, and hydroxychloroquine, either alone or in combination with corticosteroids (<10 mg of prednisone). Ten patients (14.3%) received biological therapy in the form of anti-TNF-α medications. With regard to patients with OA, 29 patients had grade 2 OA (64.4%), and 16 (35.6%) patients had grade 3 OA on Kellgren-Lawrence radiographic grading. None of the patients with OA showed active joint inflammation. All had bilateral disease, and only five patients had mild varus deformity in one of their knees.
Distribution of patients according to gender and type of medication is given in number (%), all other data are presented as median (minimum-maximum).
Significantly higher in RA than in OA and controls.
Significantly higher in OA than in controls.
RA, rheumatoid arthritis; OA, osteoarthritis; DAS, disease activity score; HAQ, Health Assessment Questionnaire; TNF-α, tumor necrosis factor alpha; CCP, cyclic citrullinated peptide; ESR, erythrocyte sedimentation rate.
All patients with RA were seropositive for RF. ESR, anti-CCP, and TNF-α were all significantly higher in patients with RA than in patients with OA and controls (p<0.0001). In addition, TNF-α was significantly higher in patients with OA than in control subjects (p=0.001) but the other parameters did not differ significantly between these two groups (p>0.05).
In the group of patients with RA, median miRNA 146a expression in PBMCs was 2.66 (1.05-5.66). This was significantly higher than the expression level in patients with OA (median 1.22 [0.88-1.96]) and in the control group (median 0.98 [(0.8-1.29]), p<0.0001. However, the difference was not statistically significant between patients with OA and control subjects (p=0.06) (Fig. 1).
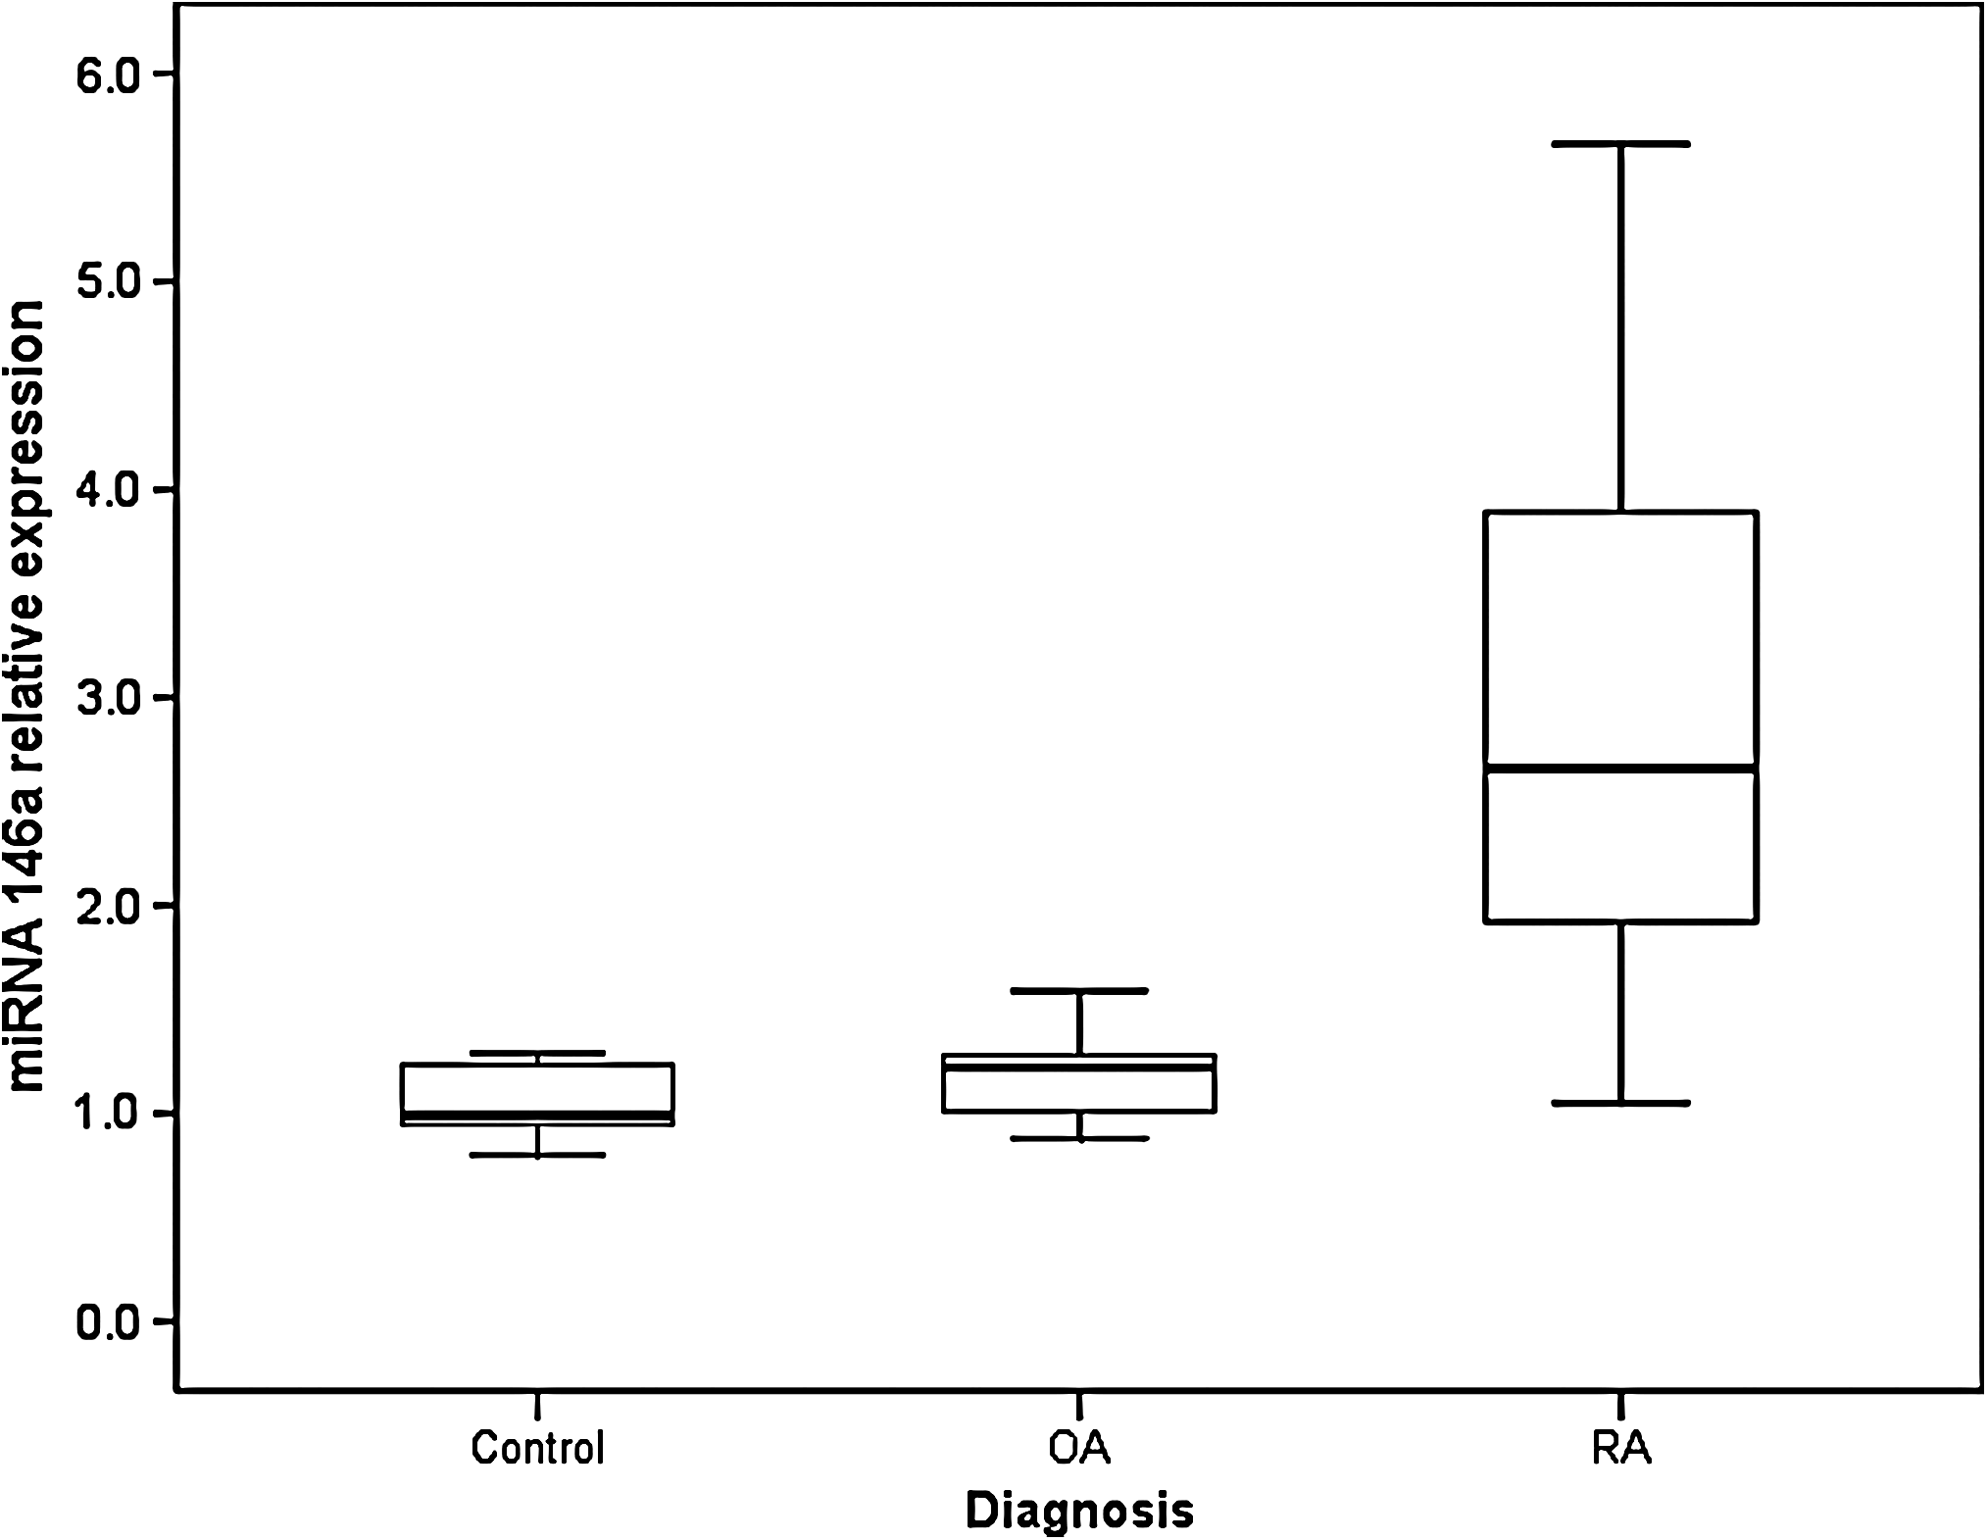
Relative microRNA 146a (miRNA 146a) expression. Results in patients with RA (n=70) and OA (n=45) are expressed as fold increase relative to the control group (n=60), p<0.0001. Boxes represent the interquartile range, horizontal lines inside the boxes represent median gene expression, and whiskers represent the 10th percentile. OA, osteoarthritis; RA, rheumatoid arthritis.
The relation between miRNA 146a expression and the various clinical and laboratory data of patients was explored. In patients with RA, miRNA 146a expression showed a positive correlation with plasma TNF-α level (r=0.631, p=0.0006) (Fig. 2). A positive correlation was also observed between miRNA 146a expression and ESR (r=0.362, p=0.022) as well as DAS 28 (r=0.36, p=0.009) (Figs. 3 and 4, respectively). On the other hand, no correlations were detected between miRNA146a expression and the other clinical or laboratory features of patients with RA, including age of patients, disease duration, duration of morning stiffness, HAQ score, RF, or anti-CCP levels (Table 2). Due to the small number of patients with low disease activity based on the DAS 28 (n=4), they were combined into one group with patients with moderate disease activity (n=20). miRNA 146a expression was significantly higher in patients with high disease activity (n=46) than in patients with mild/moderate disease activity (n=24), (range=1.09-5.66, median=2.8 and range=1.05-5.06, median=2.23, respectively, p=0.031).

Correlation between plasma tumor necrosis factor-alpha (TNF-α) and miRNA 146a expression in peripheral blood mononuclear cells (PBMCs) in patients with RA. *Statistically significant.
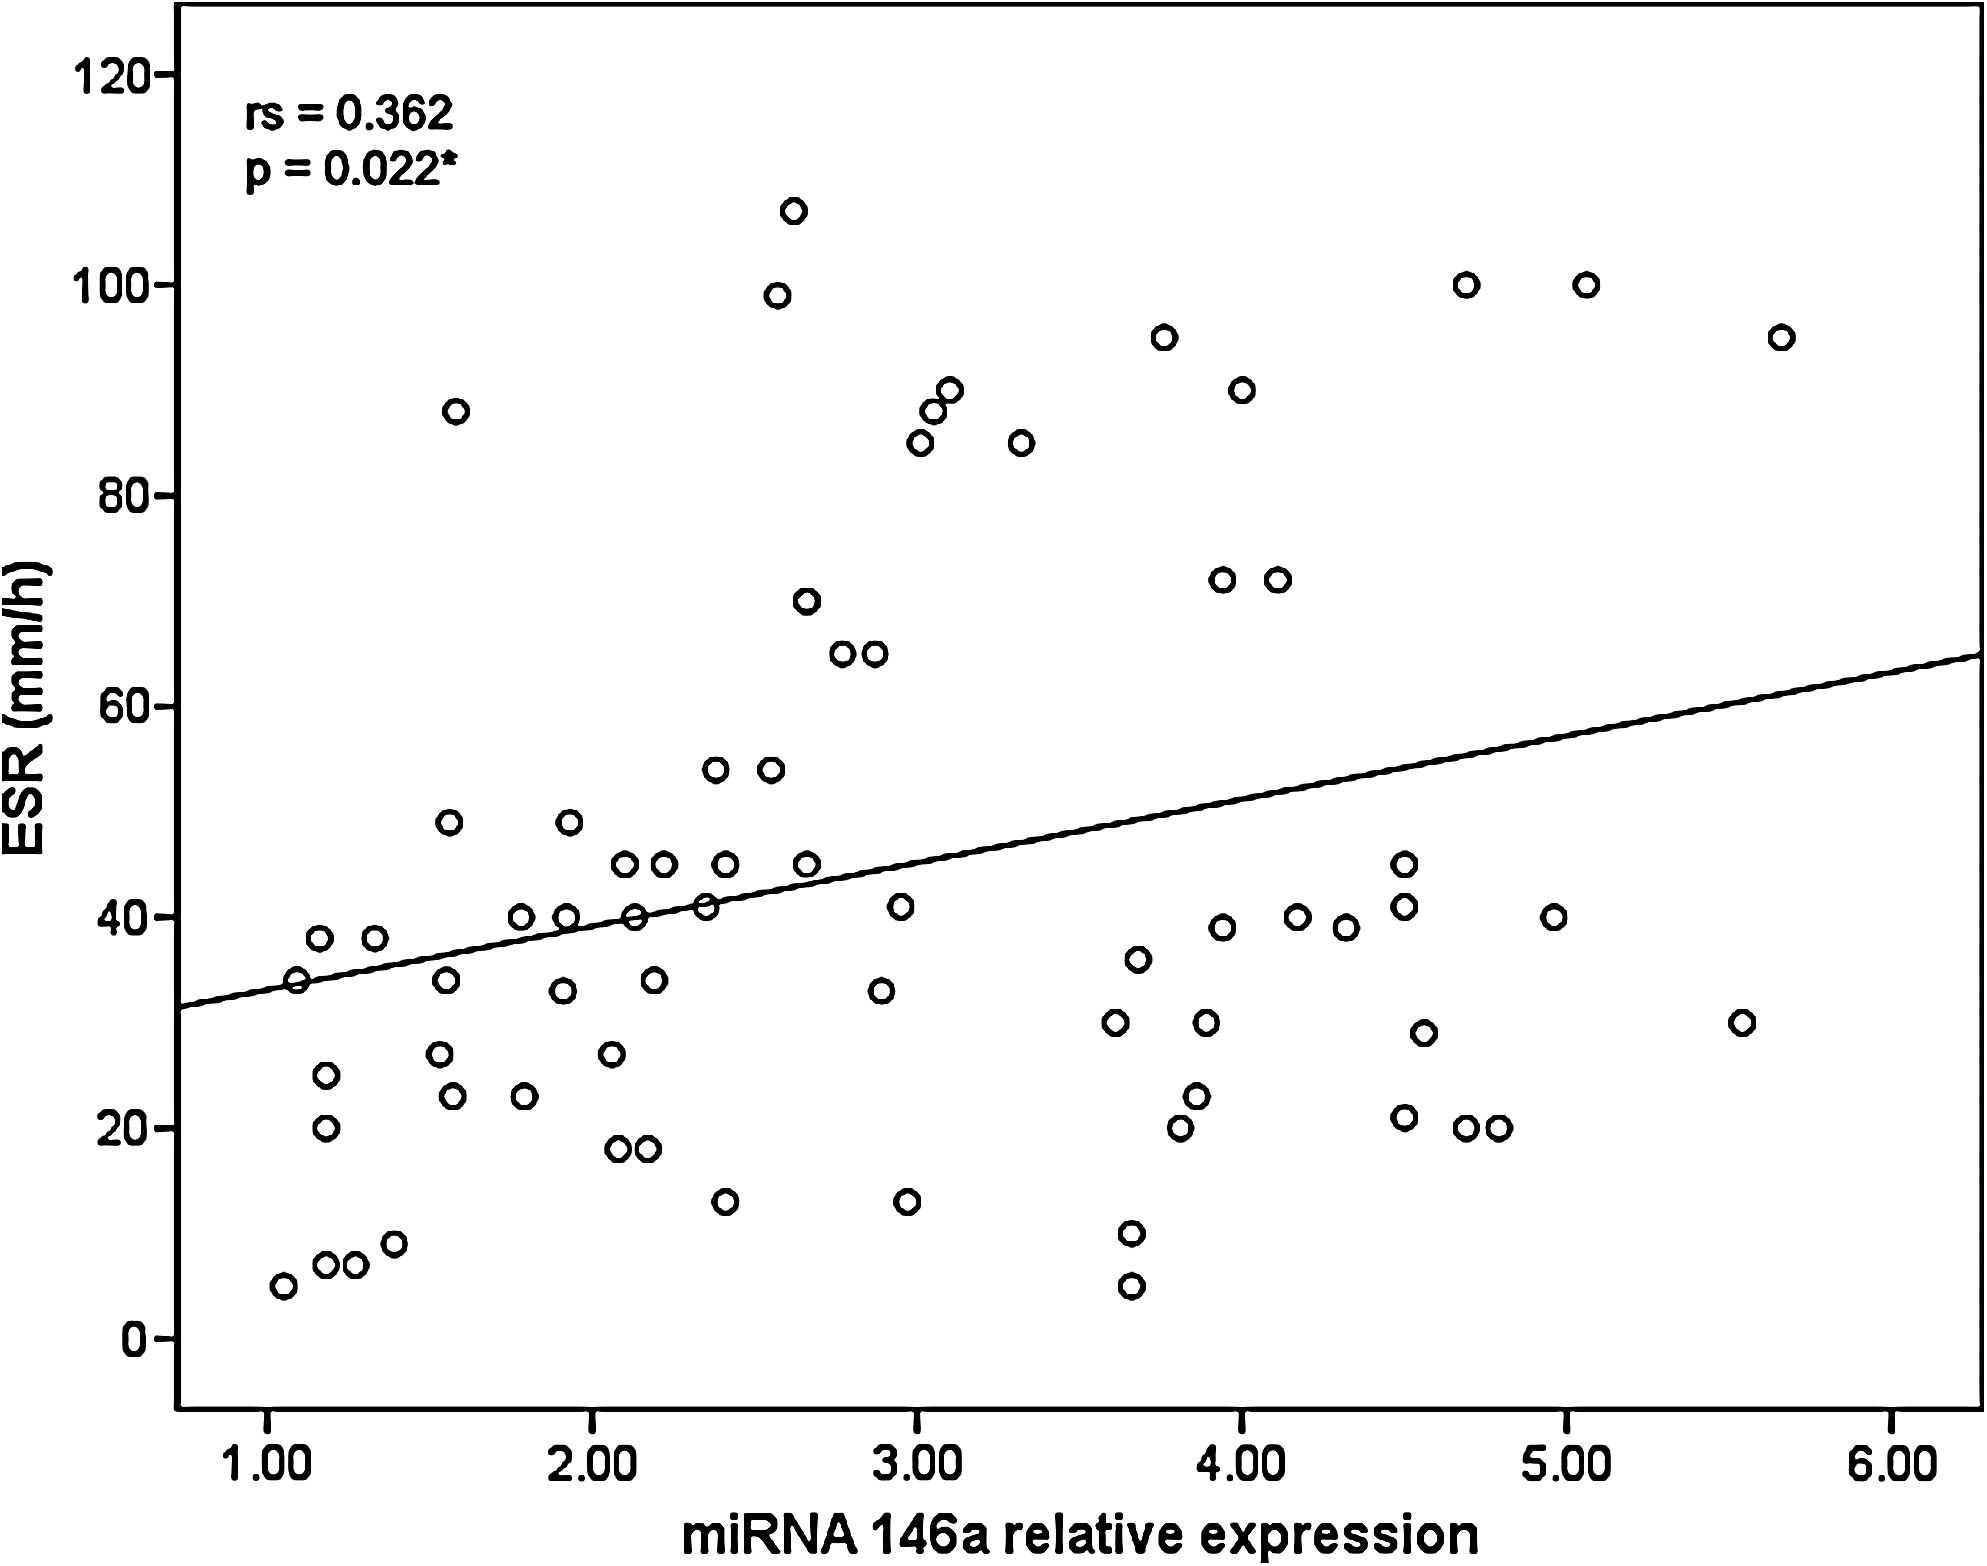
Correlation between erythrocyte sedimentation rate (ESR) and miRNA 146a expression in PBMCs in patients with RA. *Statistically significant.
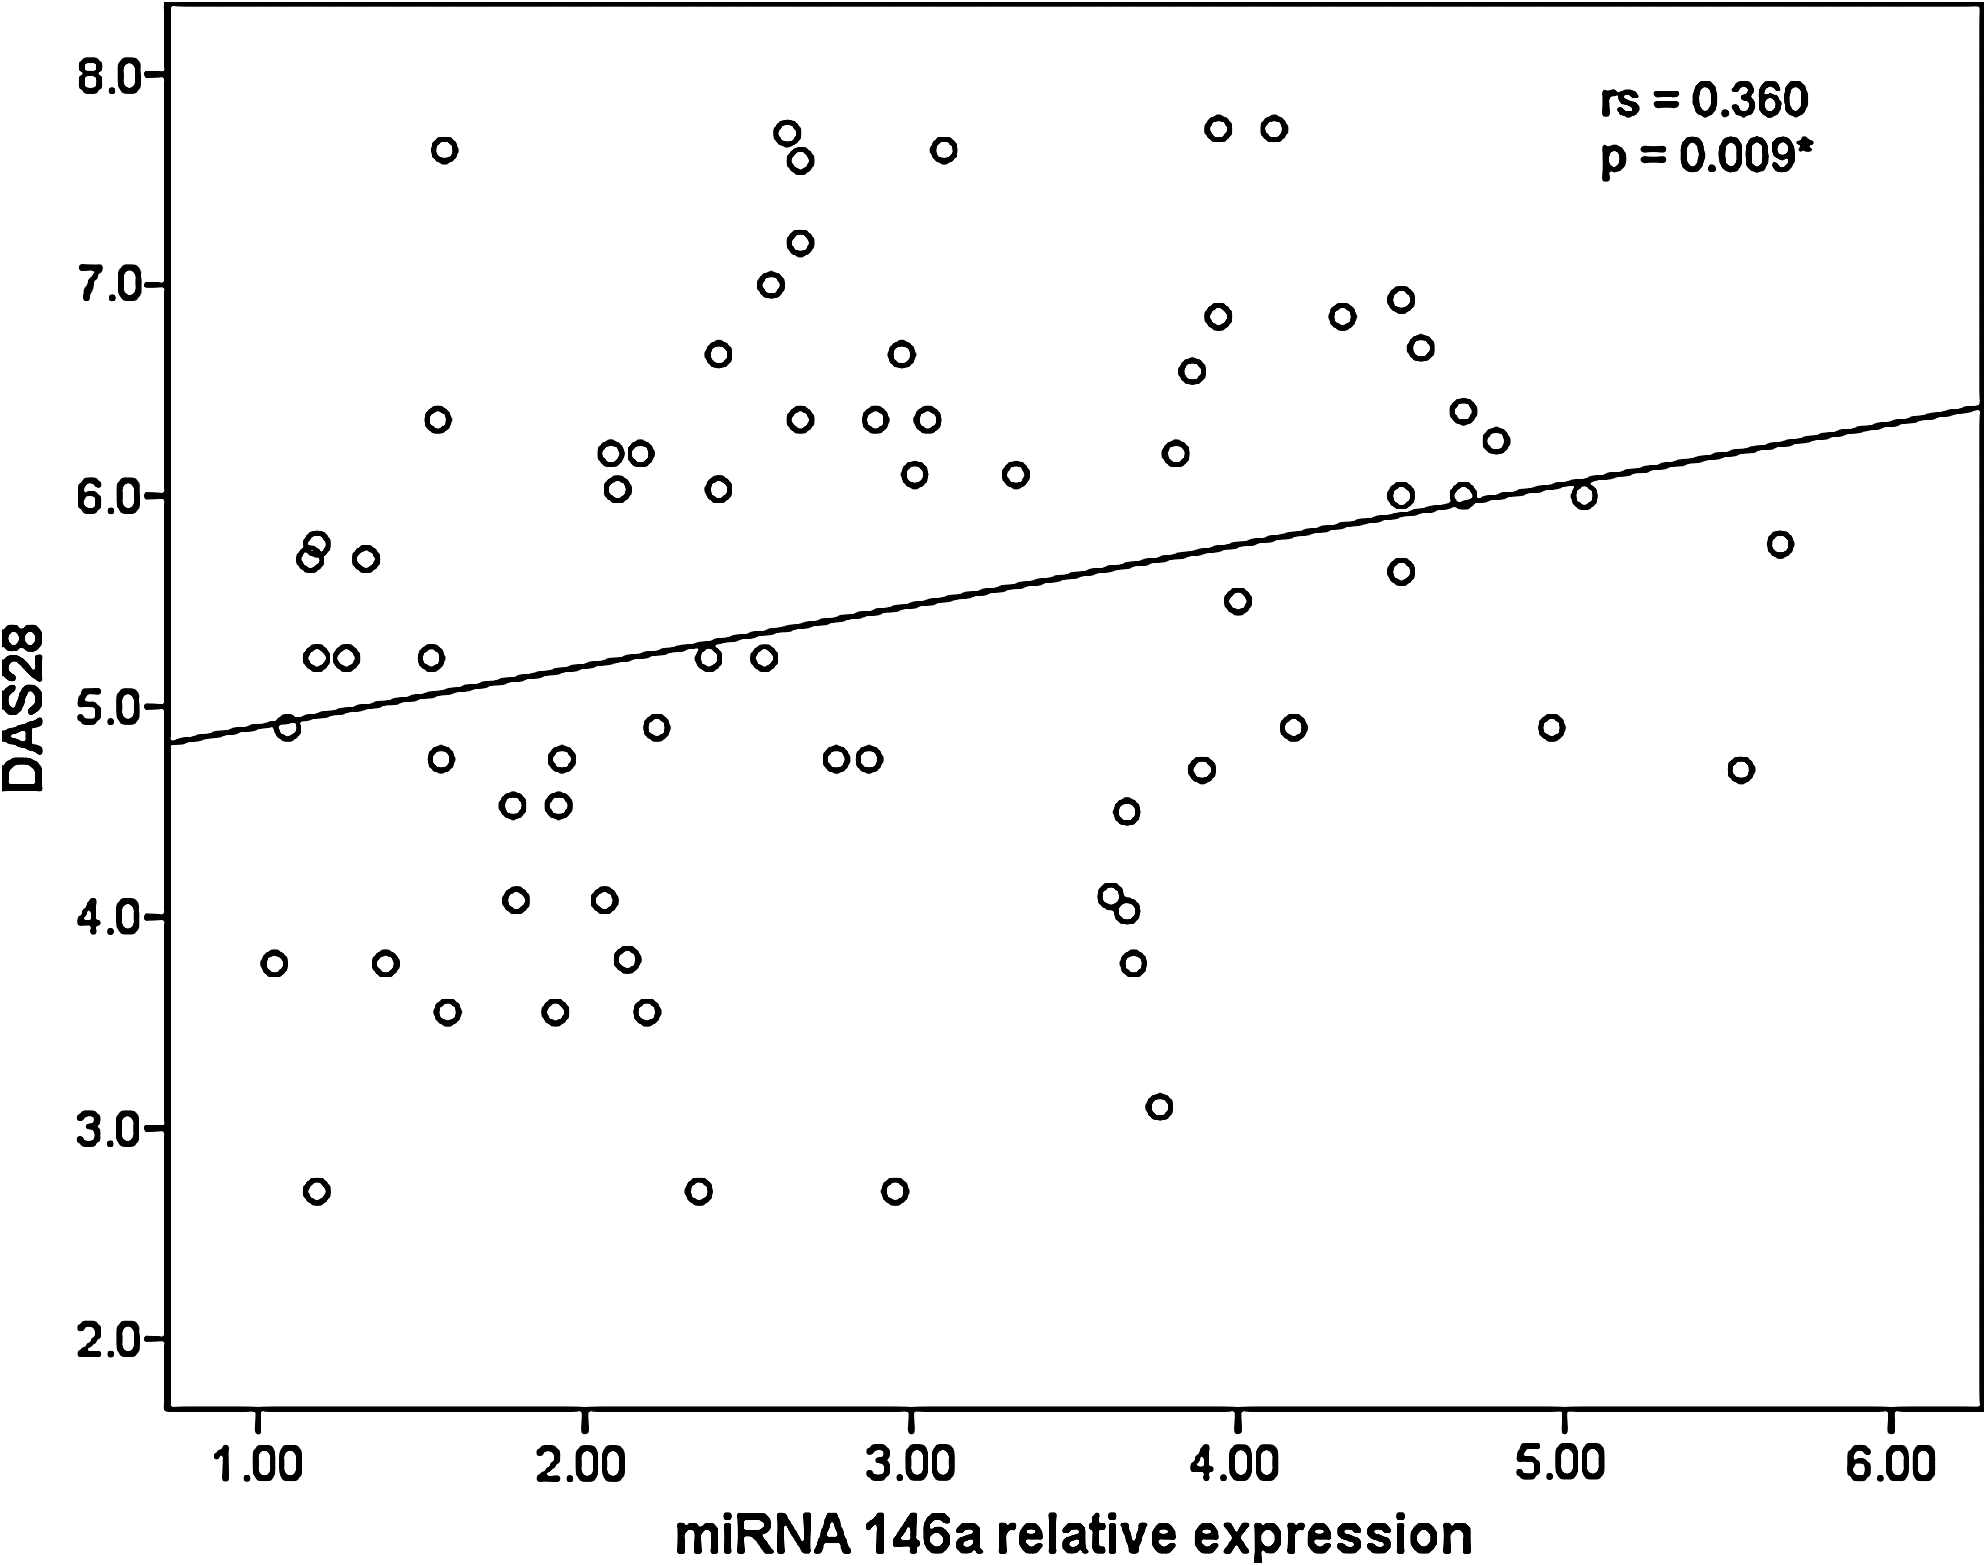
Correlation between disease activity score (DAS) 28 and miRNA 146a expression in PBMCs in patients with RA. *Statistically significant.
Data were analyzed by Spearman rho correlation test.
Statistically significant at p<0.0001.
RF, rheumatoid factor.
No correlations were observed between miRNA 146a expression and any of the clinical or biochemical parameters studied in patients with OA (p>0.05).
The association between the type of treatment and miRNA 146a expression was investigated in patients with RA. No significant difference was detected in the level of miRNA 146a expression between patients receiving anti-TNF-α (n=10) and those receiving conventional therapy (3.65 [2.05-5.54] and 2.64 [1.05-5.66] respectively, p=0.1). Plasma levels of TNF-α were also comparable in the two groups (22.8 [17.4-38.6] and 24.6 [11.8-36.1], respectively, p=0.71), and no other significant differences in the clinical or laboratory data were observed between these two groups of patients.
Discussion
A considerable amount of evidence indicates that miRNAs may be implicated in the regulation of immune responses and the development of autoimmune disorders (Cobb et al., 2006; Li et al., 2007). In the present study, the expression of miRNA 146a in PBMCs of patients with RA was significantly higher than in patients with OA and in healthy controls. In agreement with these results, two research groups (Nakasa et al., 2008; Stanczyk et al., 2008) reported higher miRNA 146a expression in synovial tissue obtained from patients with RA than in healthy synovial tissue or synovial tissue from patients with OA. Pauley et al. (2008) found higher miRNA 146a expression in PBMCs from patients with RA than in healthy controls and in patients suffering from other autoimmune disorders including systemic lupus erythematosus, Sjogren's syndrome, and scleroderma. They concluded that in patients with RA, PBMCs exhibit elevated miRNA expression in a pattern similar to that observed in RA synovial tissue. This offers a distinct advantage, as it allows monitoring miRNA expression without the need to perform an invasive procedure such as synovectomy. It was reported that T helper Th1 cells dominate in the balance of Th1/Th2 cells in RA (Shulze-Koops and Kalden, 2001; Gerli et al., 2002). Monticelli et al. (2005) demonstrated that miRNA 146 expression in a murine hematopoietic system is higher in Th1 cells than in Th2 or naive T cells.
In the study carried out by Nakasa et al. (2008), in situ hybridization and immunohistochemical analyses indicated that miRNA 146a is expressed in various cell types in the synovial tissue, including synovial fibroblasts, macrophages, T cells, and B cells. In vitro studies have shown that stimulation with inflammatory cytokines TNF-α and interleukin (IL)-1β results in upregulation of miRNA 146a expression in monocytic cell lines and that this upregulation is dependent on the transcription factor nuclear factor kappa B (NF-κB) (Taganov et al., 2006) Similarly, treatment of cultured RA synovial fibroblasts with TNF-α was found to enhance the expression of miRNA 146 (Nakasa et al., 2008; Stanczyk et al., 2008). These reports provide an explanation for the significant positive correlation observed between PBMC miRNA 146a expression and plasma TNF-α in patients with RA included in this study. Nakasa et al. (2008) postulated that in patients with RA, activated CD4+ T cells stimulate macrophages and synovial fibroblasts to secrete inflammatory cytokines, such as TNF-α and IL-1β, which probably contribute to the upregulated miRNA 146a expression.
Several reports indicated that miRNA 146a is central to the negative feedback regulation of IL-1β and TNF-α induced inflammation (Taganov et al., 2006; Perry et al., 2008). Taganov et al. (2006) speculated that miRNA 146 plays a role in the fine tuning of inflammatory cytokine signaling in RA by acting as a negative regulator of the NF-κB pathway and downregulating protein levels of interleukin-1 receptor-associated kinase 1 (IRAK1) and tumor necrosis factor receptor-associated factor 6 (TRAF6), which are key molecules downstream of TNF-α and IL-1β signaling. Pauley et al. (2008) demonstrated that repression of TRAF6 and/or IRAK-1 in human acute monocytic leukemia cell line (THP-1) monocytic cells resulted in a significant reduction in TNF-α production. They suggested that normal miRNA 146a function is critical for the negative feedback regulation of TNF-α production and demonstrated that this mechanism is impaired in PBMCs derived from RA. It is possible that this impairment may be responsible for the persistent production of TNF-α and, hence, the persistent inflammation in RA.
In patients with RA in the present study, a close relation was detected between miRNA 146a expression and disease activity as indicated by the enhanced miRNA 146a expression in patients with high disease activity compared with those with low or moderate activity and by the positive correlations of miRNA 146a expression with DAS 28 and ESR. Nakasa et al. (2008) reported higher expression of both primary and mature miRNA 146a as well as strong TNF-α expression in synovial tissue of four patients with RA with high disease activity compared with their expression in one patient with lower disease activity. Correlation with disease activity was also noted for miRNA 146 in PBMCs of patients with RA. Similarly, Pauley et al. (2008) classified 11 patients with RA into inactive/remission and active patients, based on ESR values and found an association between high PBMCs miRNA 146a expression levels and active disease, whereas low expression levels were associated with inactive disease. These data, as well as the results obtained in the present study, suggest that miRNA 146a expression may be a potentially useful marker of disease activity in patients with RA.
The effect of therapy on miRNA 146a expression in patients with RA has not been widely studied. Pauley et al. (2008) reported no difference in miRNA 146a expression between patients with RA receiving no medications and those receiving therapy including anti-TNF drugs. The lack of effect of anti-TNF therapy on plasma level of TNF-α or on miRNA 146a expression in patients with RA in the present study is quite intriguing. However, it is premature to draw any conclusions, as these patients were on ongoing therapy and had not yet finished the anti-TNF therapeutic course. Further, only 10 patients were on anti-TNF drugs; a study with a larger proportion of patients treated with anti-TNF would be useful in clarifying whether miRNA 146a expression may be used to monitor the response to therapy.
Kobayashi et al. (2008) demonstrated that miRNAs play an active role in the control of chondrocyte development and function. In the present study, TNF-α was significantly higher in the OA group compared with controls, whereas miRNA 146 was not overexpressed. Jones et al. (2009) found that miRNA 146 was significantly underexpressed in late stage OA chondrocytes relative to its expression in normal chondrocytes. They also reported that in vitro-induced overexpression of miRNA 146 in OA chondrocytes reduced TNF-α levels through targeting of IRAK I and subsequent inhibition of IL-1β-induced TNF-α production. The reason for the lack of overexpression of miRNA 146a in patients with OA included in this study is not clear. However, this absence of overexpression probably interrupted the negative feedback regulation of TNF-α secretion, which explains the observed increase in TNF-α. Considering that knee OA of the studied group was grade 2 and 3, the absence of increased miRNA 146a expression in response to the high levels of TNF-α may be involved in the progression of OA in these patients. Further support for the findings of the present study is provided by the work of Yamasaki et al. (2009), who demonstrated that miRNA 146a expression was down-regulated in OA cartilage from patients with grade II and III disease compared with those with grade I disease based on a modified Mankin scoring system.
In conclusion, this study shows that miRNA 146a expression is upregulated in patients with RA and correlates with disease activity and plasma levels of TNF-α in these patients. This indicates that miRNA 146a expression may be a potentially useful marker of disease activity in patients with RA. The effect of therapy on miRNA 146a expression in RA needs further investigation. The lack of overexpression of miRNA 146a in patients with OA in the presence of increased TNF-α may be one of the factors involved in disease progression.
Footnotes
Disclosure Statement
No competing financial interests exist.