
Abstract
Objective: DNA microarray data of patients with osteoporosis were compared with that of healthy people to identify key genes and thus disclose the underlying regulatory network. Methods: Microarray dataset GSE35958 was downloaded from the Gene Expression Omnibus database, including five gene chips from patients with primary osteoporosis and four from age-matching nonosteoporosis controls. Raw data were preprocessed and differentially expressed genes (DEGs) were identified by the t-test. Then, function and pathway annotations were given by gene ontology (GO) and KEGG. The regulatory network for the DEGs was established from the aspects of transcription factors and microRNAs (miRNAs). The regulators of the miRNAs were also predicted by the MATCH algorithm. Results: A total of 274 DEGs were obtained with 47 significantly over-represented GO terms and 2 KEGG pathways. Transcriptional and post-transcriptional regulatory networks were established for the DEGs. Moreover, upstream regulators of the miRNAs were also obtained. Conclusion: A range of genes, which might be implicated in the development of osteoporosis were obtained in the present study. Our findings are of possible benefit for the understanding of the unsolved regulatory mechanisms, and future clinical diagnosis as well as treatment.
Introduction
O
Several therapies have been on the market and more are in development for osteoporosis (Diab and Watts, 2012; Silva-Fernandez et al., 2012; Walsh, 2012). However, it still lacks premonitory symptoms, and is usually diagnosed when fractures happen. The measurement of bone mineral density is the most important diagnostic method currently available (Kanis, 2002; Jergas, 2011). In addition to reducing bone mineral density, microarchitectural deterioration and gene expression alterations also occur (Lin and Lane, 2004). Therefore, it is urgent to elucidate the regulatory mechanism from the molecular level, which would benefit the early diagnosis and prevention of the disease.
In the present study, microarray technology was utilized to identify differentially expressed genes (DEGs) in primary osteoporosis compared with normal controls. Function and pathway annotation were given for these DEGs. To further elucidate their roles in the pathogenesis, the relationships between two important regulators, transcription factors (TFs) and microRNAs (miRNAs), and their target genes were retrieved, and the regulatory networks were established, which demonstrate the molecular pathways involved in osteoporosis and thus provide a guide for future drug development.
Materials and Methods
Microarray data
Microarray dataset GSE35958 was downloaded from the GEO database (www.ncbi.nlm.nih.gov/geo/), including five genechips from patients with primary osteoporosis (minor fracture of the femoral neck) and four from age-matching nonosteoporosis controls. The age is between 79 and 94 years. RNA samples were extracted from bone marrow. Raw data were collected in the following platform: GPL570 [HG-U133_Plus_2] Affymetrix Human Genome U133 Plus 2.0 Array.
TF, miRNA, and their target genes
The TRANSFAC database collects information about transcription in eukaryotes, and a total of 895 TFs and 1847 TF-gene regulatory relationships are included. Information about miRNA comes from miRBase database, and target genes are predicted by 7 different algorithms: PicTar DIANA-microT, miRanda the miRBase RNAhybrid RNA22, TargetScan. To reduce the false positive, relationships predicted by at least three algorithms were regarded as confident.
Screening of DEGs
Microarray data were processed by mapping probes to genes. The average was determined as the expression level when more than one probe was mapped to the same gene, and such probes were removed, while more than one gene was mapped. Then, mRNA expression data underwent log2 conversion. DEGs were screened out by the t-test and multiple test correction. The false discovery rate (FDR)<0.05 and fold change>2 were set as the cutoffs.
Function and pathway annotations
To describe the biological roles of the DEGs, function and pathway annotations were performed by gene ontology (GO) and KEGG, respectively. Package Gostats of R was used for these tasks.
Establishment of regulatory network
TFs and miRNAs associated with the DEGs were retrieved to disclose the pathogenesis of osteoporosis from the aspects of transcription and post-transcription. Relationships between TFs and genes, extracted from the TRANSFACC database, were used to establish a regulatory network. Information about miRNAs and target genes was collected and the corresponding network was set up. Moreover, upstream regulators of these miRNAs were identified from the UCSC database using the MATCH algorithm. The following parameters were adopted in the calculation: vertebrates and minimize false positive matches. All the information was integrated to comprehensively reflect the pathogenic process of osteoporosis.
Results
Identification of DEGs
Differential expression analysis was conducted between patients with osteoporosis and controls. A total of 274 DEGs were obtained according to the criteria: fold change>2 and FDR<0.05.
To reveal the biological functions of the DEGs, GO and KEGG annotation are given (Table 1). A total of 47 GO terms and 2 KEGG pathways were significantly over-represented (p<0.05).
GO, gene ontology.
Regulatory relationships
The TFs regulating DEGs were retrieved from the TRANSFAC database. Interactions between 49 TFs and 17 DEGs were obtained. As shown in Figure 1A, most of the TFs had only one target DEG.
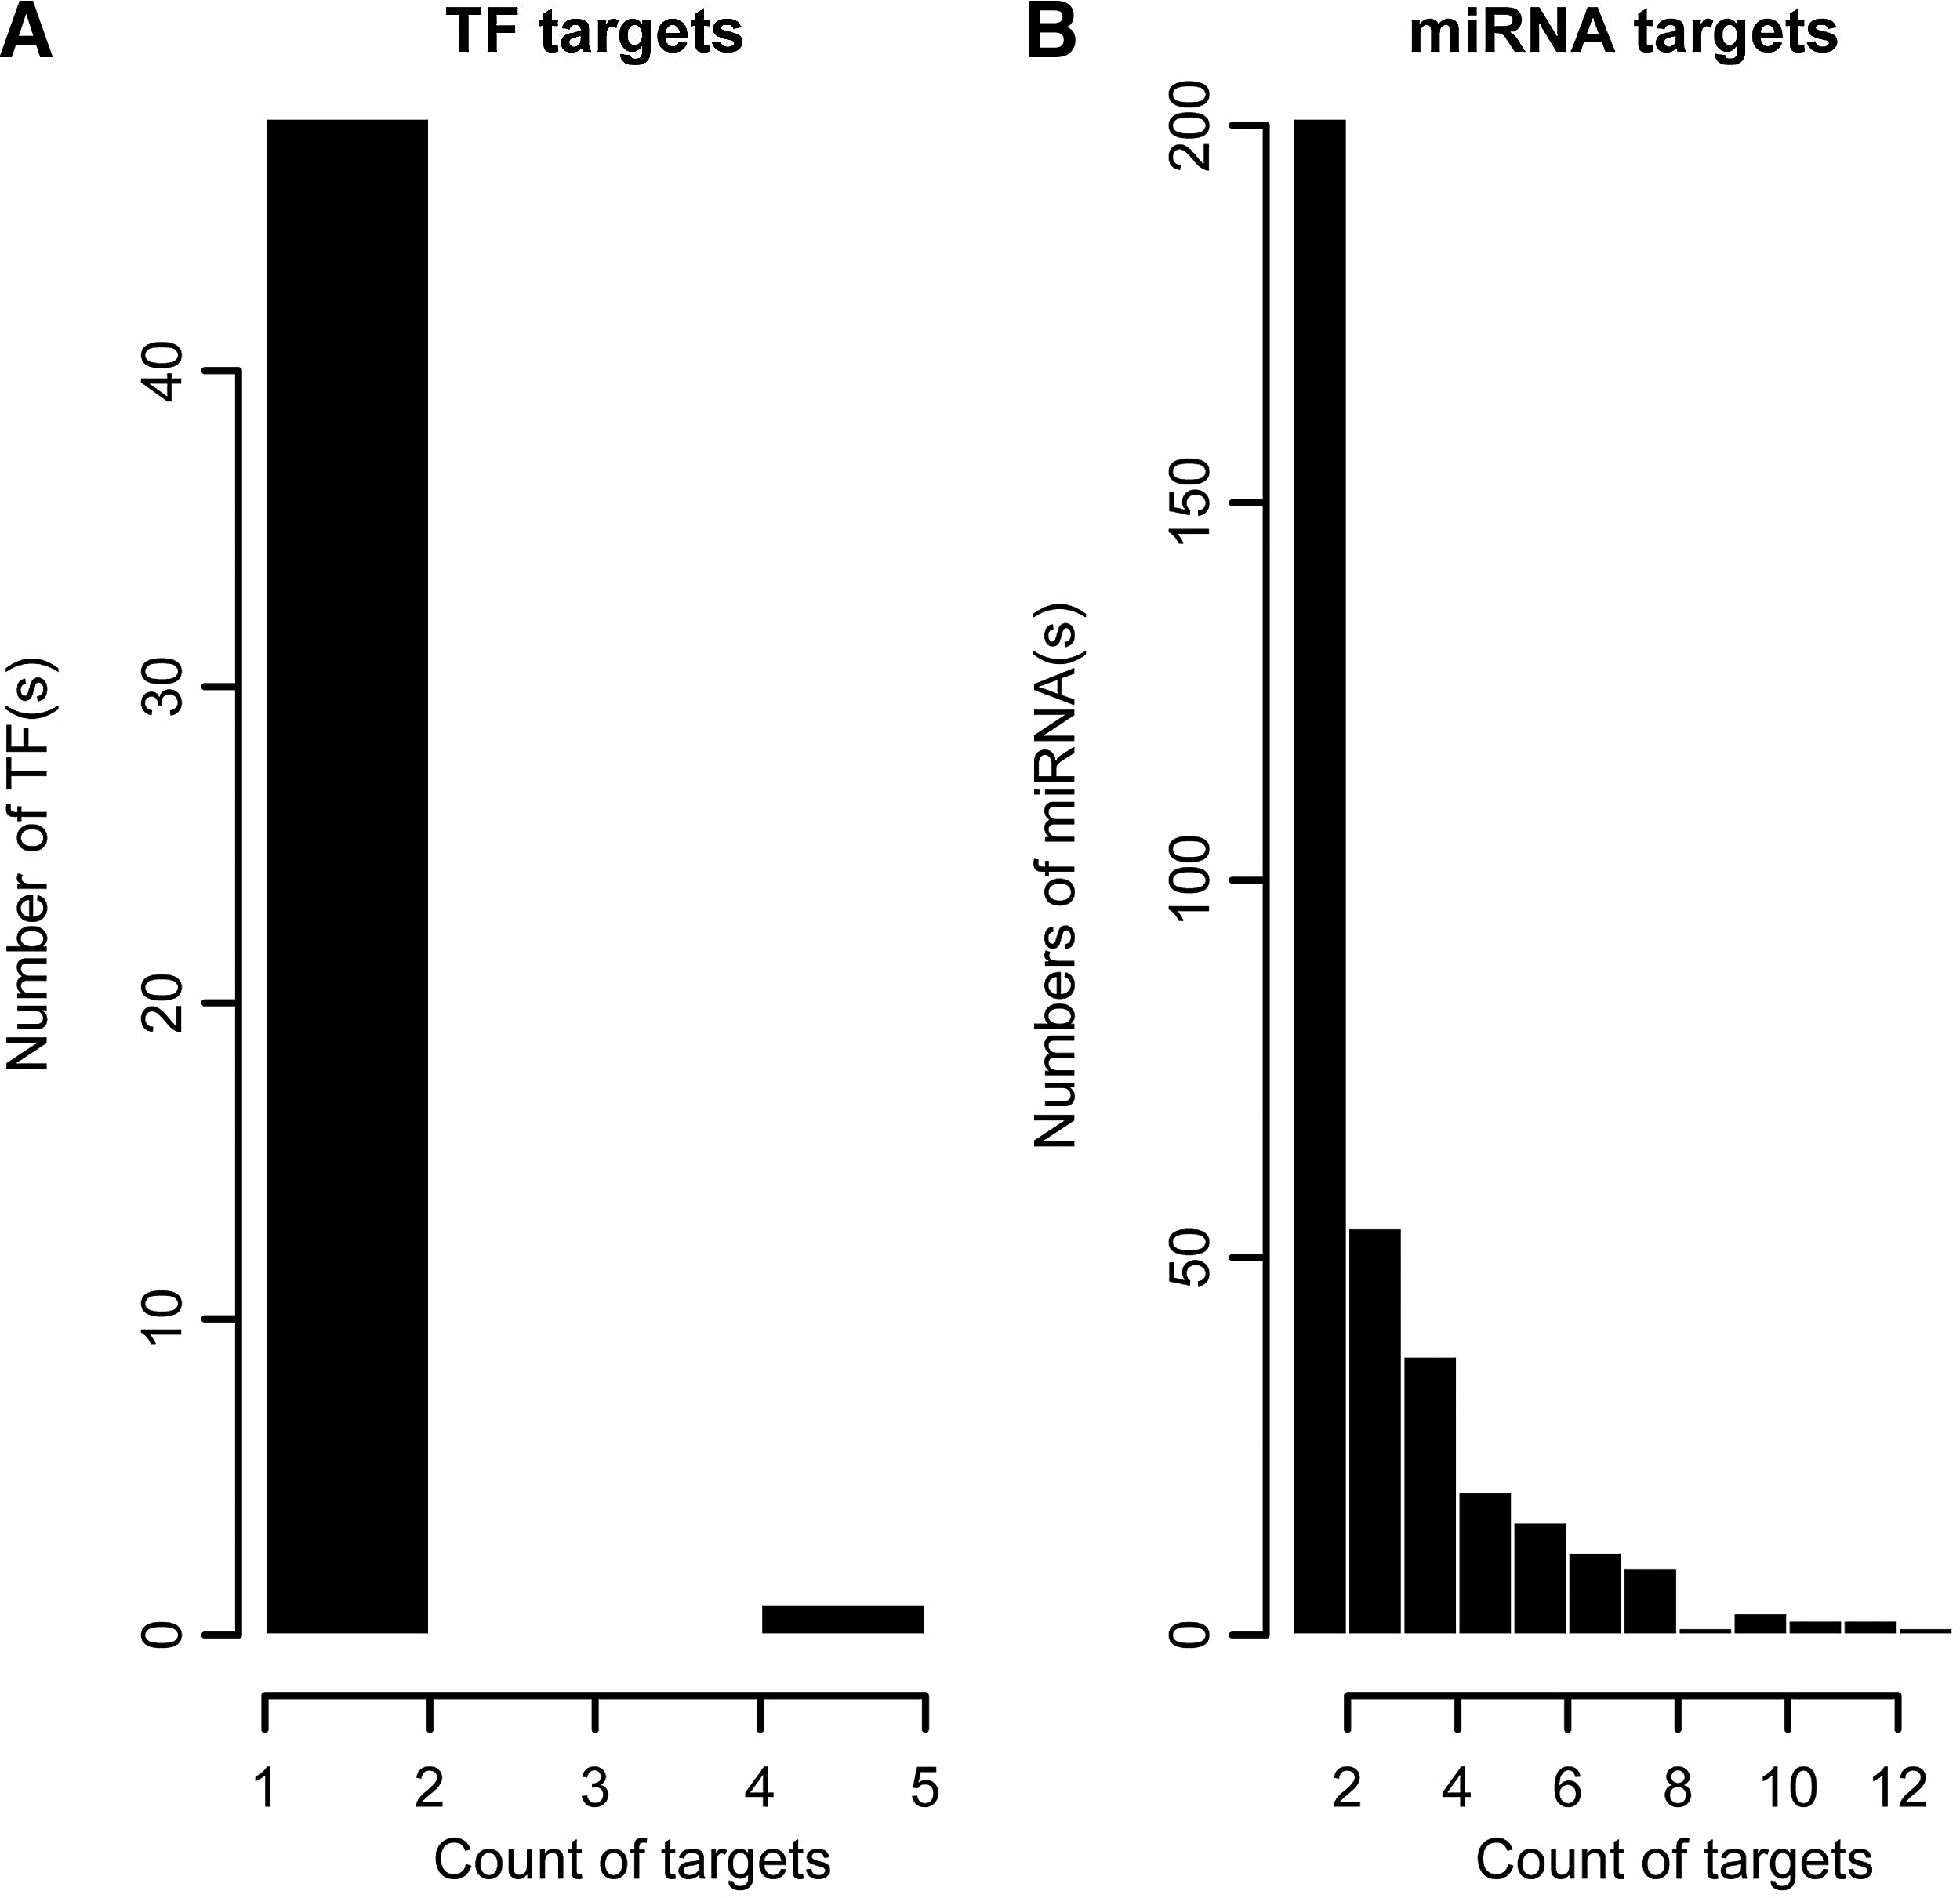
miRNAs were acquired from a miRBase database. Target genes were predicted by seven algorithms (PicTar, DIANA-microT, miRanda, miRBase, RNAhybrid, RNA22, and TargetScan), and 52828 miRNA-target gene relationships were presented in at least three algorithms and were considered as of high confidence. Then, 1014 relationships involving DEGs were extracted, containing 355 miRNAs and 137 target DEGs. The distribution for the number of target genes corresponding to one miRNA was shown in Figure 1B.
Since the genomic annotation for miRNAs is incomplete, the primary transcripts of most miRNAs are still unknown. In the present study, sequence information of the precursor miRNAs was acquired from the UCSC database and the MATCH algorithm was adopted to identify upstream regulators. Finally, 40 regulatory relationships, including 14 TFs and 8 miRNAs were revealed.
Regulatory network
The transcriptional regulatory networks (Fig. 2) and post-transcriptional regulatory networks were established based upon the relevant information. Three modules were extracted from the network using the MCODE algorithm to better describe their functions (Fig. 3). The most significantly over-represented biological process for each module was biosynthesis, an enzyme-linked receptor protein signaling pathway and apoptosis regulation. Besides, regulators for the miRNAs in the modules were uncovered (Fig. 4). According to the prediction results, three miRNAs in module 1 were regulated by POU2F1 (Fig. 4).
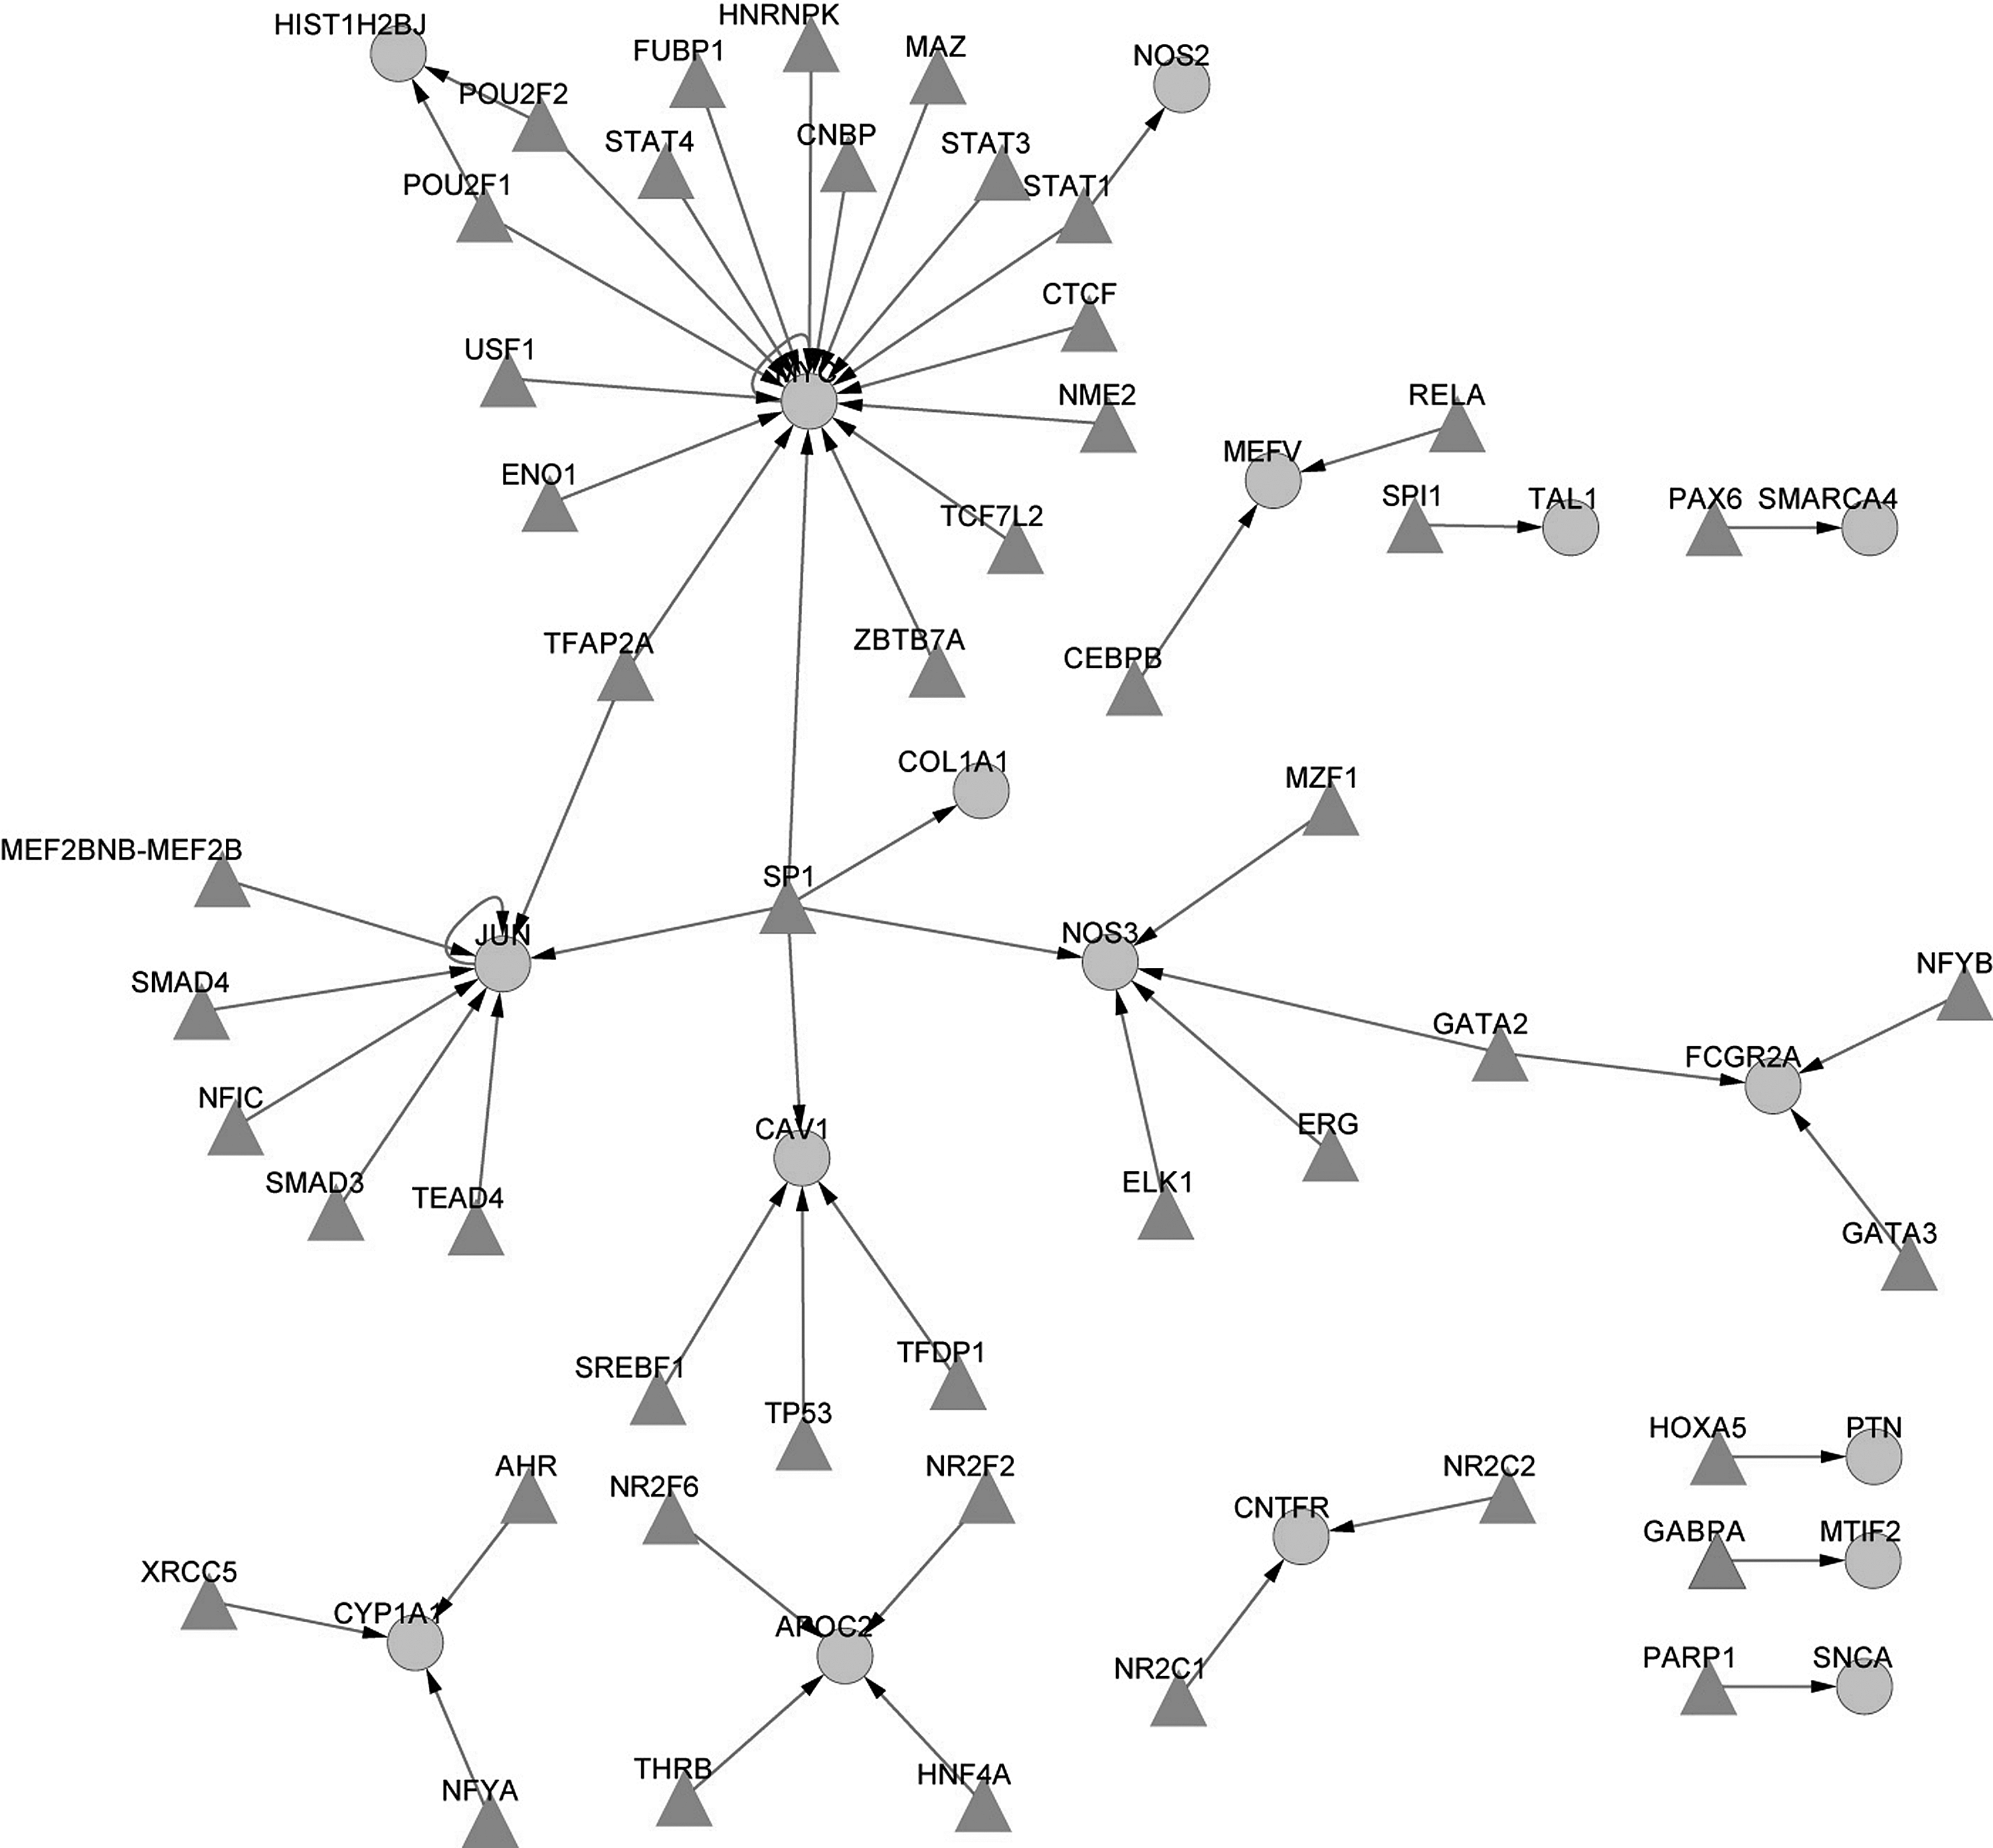
The TF-mediated transcriptional regulation networks. The round node represents the differentially expressed gene (DEG), and the triangular node represents the TF.
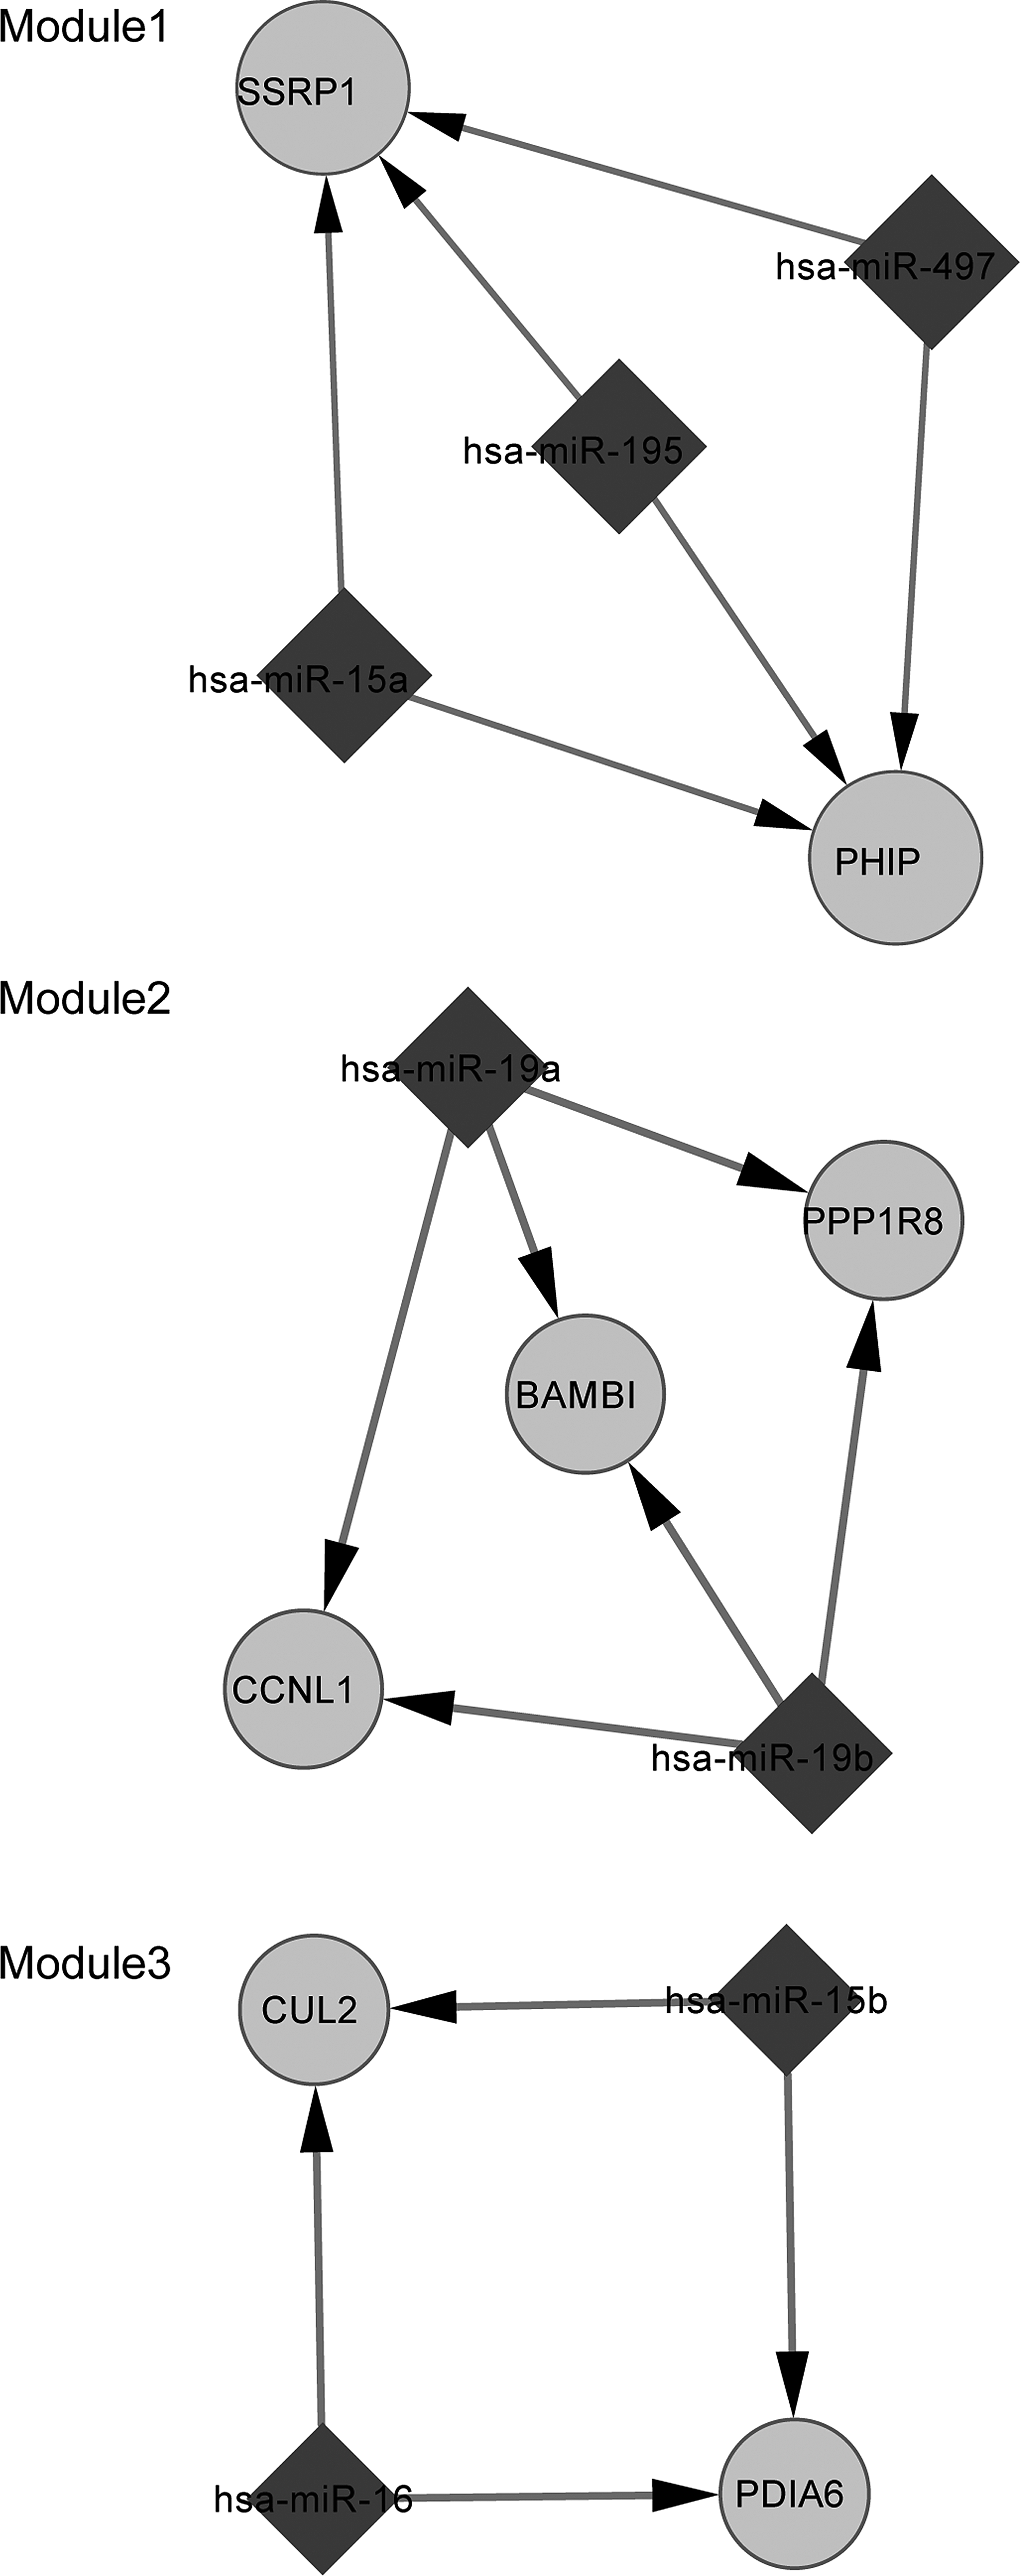
The function modules from miRNA-involved regulatory network. The rhombic node represents miRNA, the round node represents the differentially expressed gene.
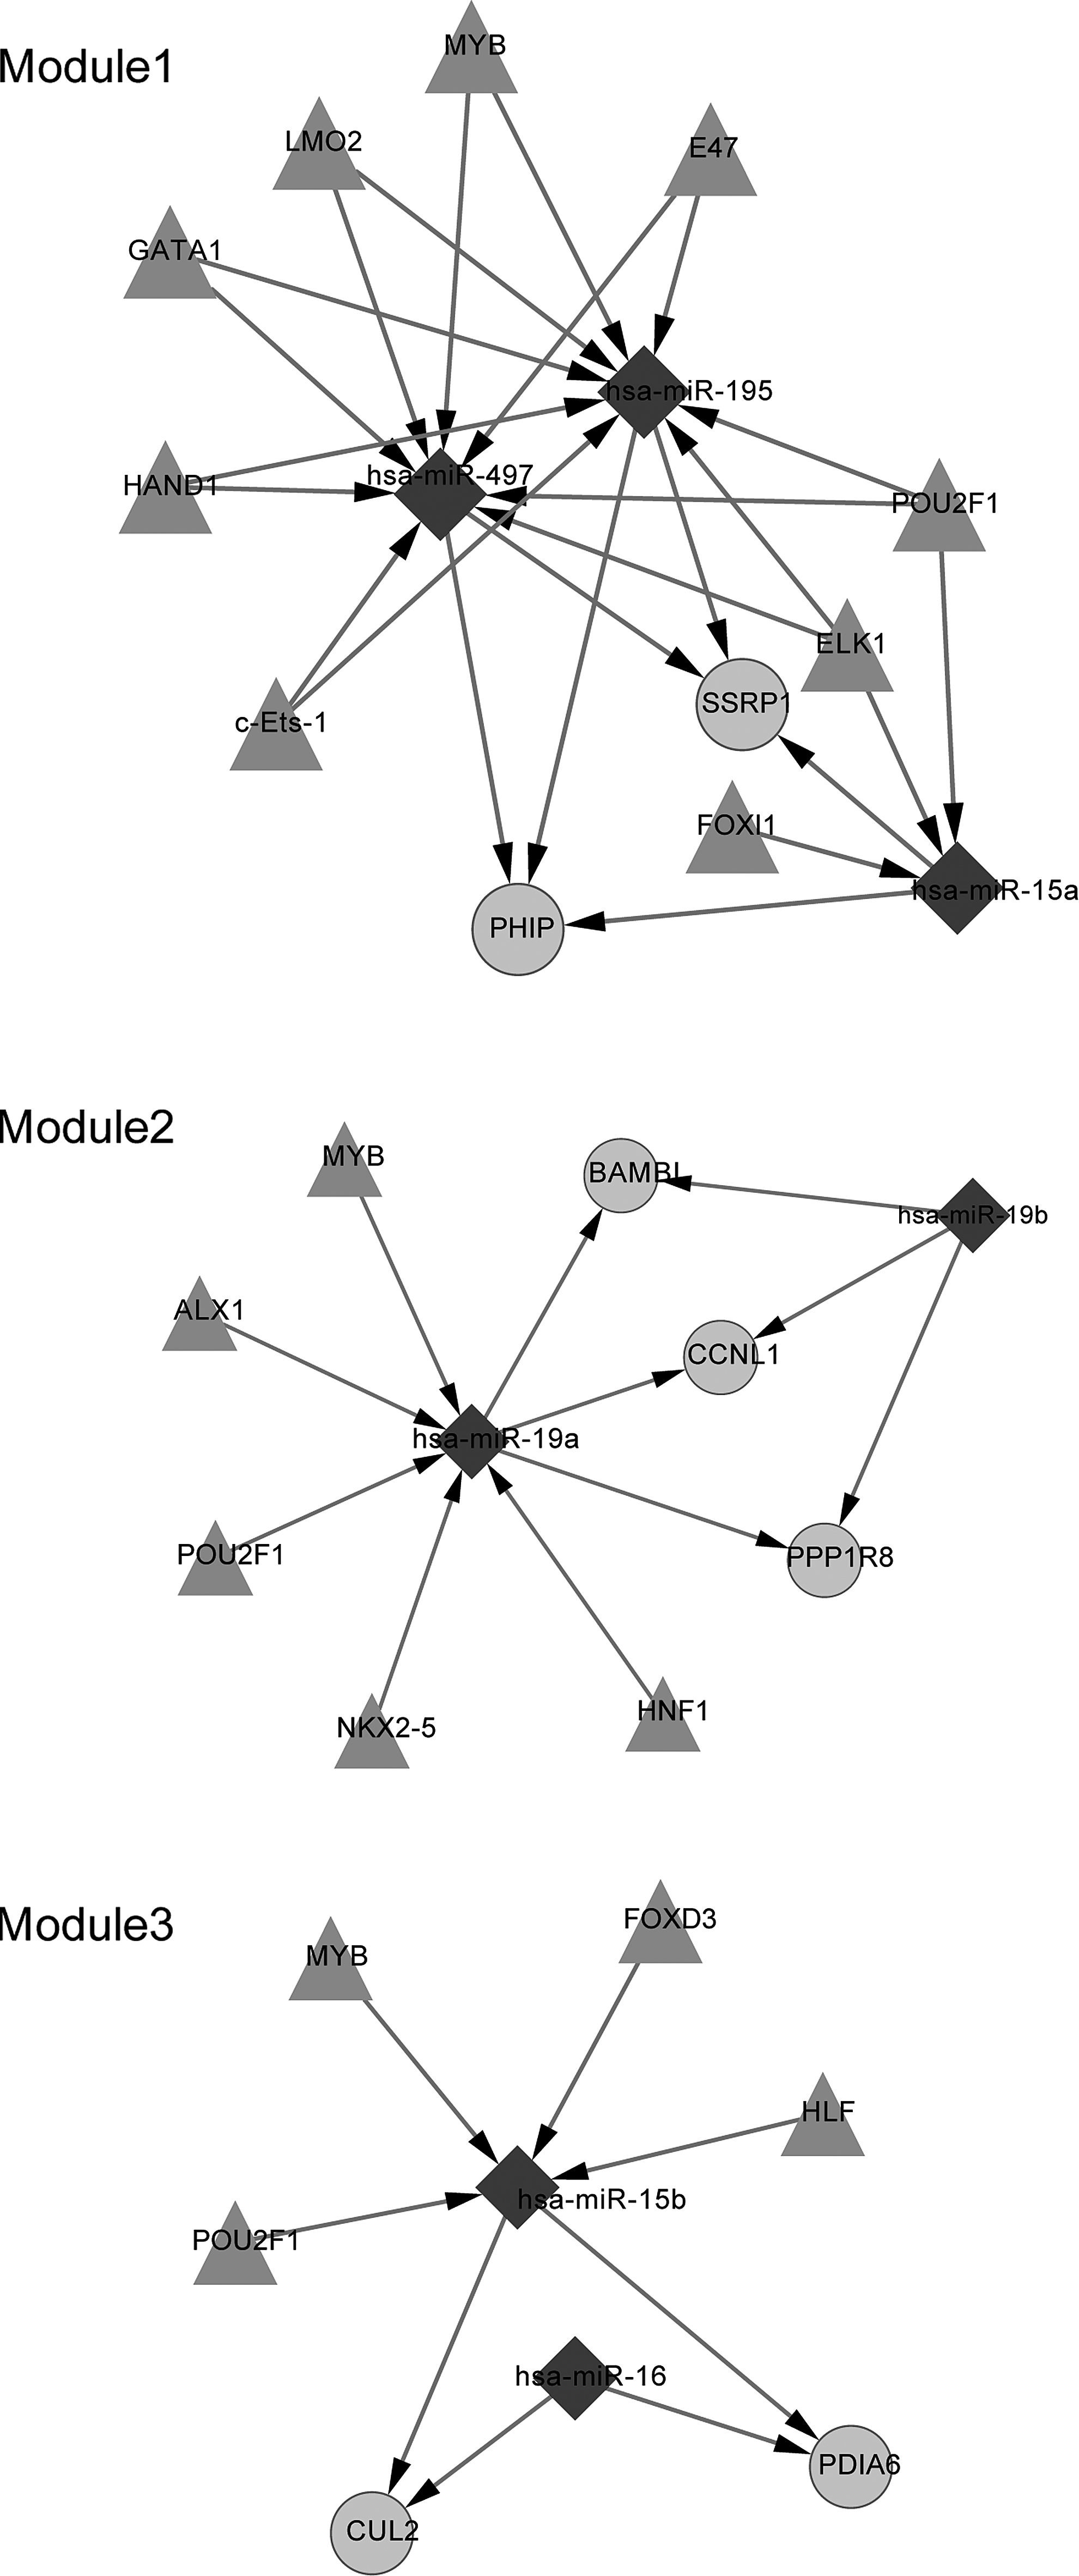
Predicted regulators for the miRNAs in the three modules. The rhombic node represents miRNA, the round node represents the differentially expressed gene, and the triangular node represents the TF.
Discussion
In the present study, microarray data were analyzed to globally identify DEGs associated with osteoporosis. GO analysis showed that 47 terms were significantly over-represented. Then, a TF-mediated transcriptional regulatory network and a miRNA-mediated post-transcriptional regulatory network were established to demonstrate the molecular mechanisms. Moreover, regulators of the miRNAs were also predicted and the network was generated. Our study comprehensively described the regulatory network from different aspects.
The TF-target gene regulatory network provides much information. Cytochrome P450, family 1, subfamily A, polypeptide 1 (CYP1A1) is a member of the cytochrome P450 superfamily of enzymes, which catalyzes many reactions involved in drug metabolism and synthesis of cholesterol, steroids, and other lipids. Its polymorphisms have effects on estrogen metabolism and thus are linked with bone density (Napoli et al., 2005; Quan et al., 2009). Its TFs include the aryl hydrocarbon receptor (AHR), nuclear transcription factor Y-alpha, and Ku80 (XRCC5). A previous study indicates that AHR signals have a critical effect on the differentiation of osteoblasts and influence bone modeling in vivo (Naruse et al., 2002). Rayalam et al. (2011) consider that the AHR plays an important role in diverse cellular functions like detoxification, adipogenesis, and adipocyte and osteoblast differentiation. It could be speculated that CYP1A1 is a key mediator. Ku80 is also linked to osteoporosis as Ku80 mutant mice exhibit several characteristics of aging, including osteoporosis (Hasty et al., 2003; Watanabe and Hishiya, 2005). Nitric oxide synthase 3 is involved in the synthesis of nitric oxide, which acts as a biologic mediator in several processes, such as bone loss through osteoblasts as well as osteomyelitis (Asensi et al., 2007).
The miRNA-target gene regulatory network is also beneficial in promoting our understanding about the underlying mechanisms. In module 1, both the pleckstrin homology domain interacting protein (PHIP) and the structure-specific recognition protein 1 (SSRP1) were regulated by three miRNAs: miR-195, miR-497, and miR-15a. A number of studies have indicated the linkage between insulin and osteoporosis (Thrailkill et al., 2005; Abdulameer et al., 2012; Xia et al., 2012). Thus, we speculated that PHIP might be implicated in osteoporosis as it could bind the pleckstrin homology domain of the insulin receptor substrate-1 (Farhang-Fallah et al., 2000) and modulate insulin signaling. Maire et al. (2011) report that hsa-miR-195 is upregulated in osteosarcoma compared with normal osteoblasts. In addition, the myeloblastosis oncogene (MYB) was predicted to be the regulator of miR-195. The study by Willing et al. (1998) shows that the MYB has an influence on the estrogen receptor 1 (ESR1), which is closely associated with bone density and fractures, as well as the pathogenesis of osteoporosis (Styrkarsdottir et al., 2009). BMP and activin membrane-bound inhibitor homolog (BAMBI) was included in module 2 and regulated by miR-19a and miR-19b. BAMBI is a transmembrane glycoprotein related to the type I receptors of the transforming growth factor-beta family and thus takes a part in some processes. It may bind to BMP and thus is associated with bone formation (Li, 2008). Kitazawa et al. (2005) further suggest that BAMBI promoter hypermethylation may be involved in metaplastic bone formation. Ubiquitin-mediated protein degradation has been confirmed to be linked with bone homeostasis (Yamashita et al., 2005; Gunther Sillero et al., 2008) and CUL2 is an important component of the E3 ubiquitin-protein ligase complex. Thus, altered expression in primary osteoporosis is really worth further investigation.
Although much information about the involvement of DEGs and their regulators was provided in the study, more microarray data are needed to completely present all the molecular mechanisms. Anyway, our study is beneficial for understanding the pathogenesis of osteoporosis and also provides clues for future biomarker discovery and drug development.
Footnotes
Acknowledgment
This study was supported by the National Natural Science Foundation of China (81000779).
Author Disclosure Statement
No competing financial interests exist.