




Abstract
Background and Aims: The accuracy of glycosylated hemoglobin (HBA1c) detection for the diagnosis of gestational diabetes mellitus (GDM) has been extensively studied in the Chinese population, but the exact role of these detections remains controversial. The present meta-analysis was performed to establish the overall accuracy of HBA1c for the diagnosis of Chinese patients with GDM. Methods: After a systematic review of related studies, the sensitivity, specificity, positive likelihood ratio (PLR), negative likelihood ratio (NLR), diagnostic odds ratio (DOR), and other measures about the accuracy of HBA1c in the diagnosis of GDM were pooled using random-effects models. The summary receiver operating characteristic (SROC) curve analysis was used to summarize the overall test performance. Results: Forty-one studies included 2812 Chinese patients with GDM and 5918 controls were included in our meta-analysis. The summary estimates for HBA1c in the diagnosis of GDM in the studies included were as follows: sensitivity 0.762 (95% confidence interval [CI]: 0.746-0.777), specificity 0.917 (95% CI: 0.910-0.924), PLR 8.21 (95% CI: 3.77-17.89), NLR 0.20 (95% CI: 0.09-0.44), and DOR 41.40 (95% CI: 11.47-149.38). Our data showed that the SROC curve is positioned near the desirable upper left corner of the SROC curve, while the area under curve (AUC) was 0.93 with a Q* value of 0.865. Conclusions: Measurement of HBA1c is likely to be a useful diagnostic tool for confirming GDM. The results of HBA1c should be interpreted in parallel with clinical findings and the results of conventional tests.
Introduction
Currently, there is no consensus on the optimal approach to screen for GDM (Hollander et al., 2007). Several international guidelines recommend either a one-step 75 g oral glucose tolerance test (OGTT) approach, or a two-step approach in which, a 50 g glucose challenge test is performed, followed by an OGTT in the event of an abnormal test result (Hoffman et al., 1998). Nowadays, the recommended test involves measuring fasting plasma glucose (FPG).
The glycosylation of protein is an irreversible, nonenzymatic chemical process, which binds glucose to plasmatic proteins. The level of glycosylation is determined by the average glycemia and exposure time (Virally and Laloi-Michelin, 2010). The glycosylated hemoglobin (HBA1c) is a single nonfasting blood test that reflects glucose levels over the previous 4-8 weeks (John, 1997). Rahbar was the first to describe HBA1c to be elevated in diabetes mellitus (Rahbar et al., 1969). The reference range for HbA1c is lower during pregnancy due to a reduced fasting glucose level and changes in erythrocyte turnover. Depending on the methodology, the upper reference rang for HbA1c may be about 0.6% less than in the nonpregnant state (Mosca et al., 2006). This may vary slightly at different stages of the pregnancy (Nielsen et al., 2004). Many studies assessing HBA1c as a screening test for GDM are over one to two decade years. Technically, it has now become a simpler test to perform, more standardized, user-friendly, and automated techniques are widely available.
Although the accuracy of HBA1c detection for the diagnosis of GDM has been extensively studied, the exact role of these detections remains controversial. The present meta-analysis was performed to establish the overall accuracy of HBA1c for the diagnosis of Chinese patients with GDM.
Materials and Methods
Search strategy and study selection
A comprehensive search of the Embase, Ovid, Web of Science, Cochrane database, Medline, and Chinese Biomedical Literature Database (CBM-disc, 1979-2012), the database of National Knowledge Infrastructure (CNKI, 1979-2012), and full paper database of Chinese Science and Technology of Chongqing (VIP, 1989-2012) was conducted to identify suitable studies until December 2012. The search terms were ‘‘glycosylated hemoglobin’’, “HbA1c,” “hemoglobin Alc,” “saccharification hemoglobin,” “gestational diabetes mellitus,” “sensitivity and specificity,” “predictive value,” “likelihood ratio,” “diagno*,” and “accuracy.” The references of reviews and retrieved articles were also searched simultaneously to find additional eligible studies.
A study was included in the meta-analysis when it provided both sensitivity (true-positive rate) and specificity (1 false-positive rate) of HbAlc for the diagnosis of GDM, or when it provided HbAlc values in a dot plot form, allowing test results to be extracted for individual study subjects. Two reviewers (W.-L. Yu and L.-M. Lun) independently judged study eligibility, while screening the citations. Disagreements were resolved by consensus.
Data extraction and quality assessment
Articles were assessed independently by two raters (Q.-W. Tian and C. Xuan) and inter-rater discrepancies between each other were reconciled by consensus or by a third arbitrator (H.-W. Wang). Data retrieved from the reports included the author, publication year, participant characteristics, cutoff value, true-positive (TP), false-negative, false-positive (FP), and true-negative data.
The Quality Assessment of Diagnostic Accuracy Studies (QUADAS) tool was used to grade the methodological quality of included studies. The QUADAS illustrates a number of methodological limitations presented in the literature and is a validated tool for systemic examination of potential sources of bias in primary studies of diagnostic accuracy. It consists of a set of 14 criteria, which were scored as “yes” (criteria satisfied), “no” (criteria not satisfied), or “unclear” (Whiting et al., 2003).
Statistical analysis
Standard methods recommended for meta-analyses of diagnostic test evaluations were used. The following measures of test accuracy were computed for each study: the sensitivity, specificity, positive likelihood ratio (PLR), negative likelihood ratio (NLR), and diagnostic odds ratio (DOR).
The analysis was based on a summary receiver operating characteristic (SROC) curve. The sensitivity and specificity for the single test threshold identified for each study were used to plot an SROC curve. A random-effect model was used to calculate the average sensitivity, specificity, and the other measures across studies.
Heterogeneity in meta-analyses refers to the degree of variability in results across studies. We used the χ2 and Fisher's exact tests to detect statistically significant heterogeneity (Xuan et al., 2011b, 2012, 2013a, 2013b). To assess the effects of QUADAS scores, as well as some methodological and clinical characteristics, such as the cutoff value, source of control on the diagnostic ability of GDM, we included them as covariates in univariate meta-regression analysis (inverse variance weighted). The relative DOR (RDOR) was calculated according to standard methods to analyze the change in diagnostic accuracy in the study per unit increase in the covariate. We tested for the potential presence of publication bias using funnel plots and the Egger's test (Xuan et al., 2011a; Xuan and He, 2012).
All analyses were undertaken using Meta-DiSc statistical software (version 1.4; Ramo'n y Cajal Hospital, Madrid, Spain) and STATA software, version 10.0 (Stata Corporation, College Station, TX).
Results
Study characteristics and quality
A total of 109 abstracts that met the inclusion criteria were retrieved. Two reviewers then selected the relevant studies independently. Fifty-two relevant studies that described the role of HbA1c concentrations in the diagnosis of GDM were identified. However, after reading the full articles and authors were contacted, we excluded three duplicate studies, two meta-analysis studies, and six studies for which, information could not be obtained. Subsequently, 41 studies (Ma and Niu, 2001; Ma and Qin, 2004; Li et al., 2005, 2006, 2011; Jiang and Zeng, 2006; Liu, 2007, 2011, 2012; Ye et al., 2007; Shi, 2008; Yan, 2008; Chewng et al., 2009; Lai et al., 2009; Liao et al., 2009; Lin et al., 2009; Meng and Meng, 2009; Pan et al., 2009; Pang et al., 2009; Chen et al., 2010; Deng et al., 2010; Li, 2010; Li and Zhang, 2010; Luo, 2010; Xie, 2010; Xu, 2010; Xu and Wu, 2010; Yang, 2010; Zhang et al., 2010; Chen, 2011; Gong et al., 2011; Qi et al., 2011; Qian et al., 2011; Qin et al., 2011; Wang et al., 2011; Wang, 2011; Zhang, 2011; Hu, 2012; Lei, 2012; Wen, 2012; Yu, 2012) included 2812 patients with GDM and 5918 controls were available for analysis, and the clinical characteristics of these studies, along with QUADAS scores, are outlined in Table 1. Figure 1 shows the process of study selection and exclusion, with specification of reasons.

Flowchart of selection of studies and specific reasons for exclusion from the meta-analysis.
GDM, gestational diabetes mellitus; FN, false-negative; FP, false-positive; TN, true-negative; TP, true-positive; QUADAS, quality assessment for studies of diagnostic accuracy; IGT, impaired glucose tolerance.
Diagnostic accuracy
Figure 2 shows the forest plot of the sensitivity and specificity of HbA1c assays in the diagnosis of GDM. The sensitivity ranged from 0.373 to 0.952 (0.762, 95% confidence interval [CI]: 0.746-0.777), while the specificity ranged from 0.491 to 0.992 (0.917, 95% CI: 0.910-0.924). The PLR was 8.21 (95% CI: 3.77-17.89), the NLR was 0.20 (95% CI: 0.09-0.44), and the DOR was 41.40 (95% CI: 11.47-149.38). χ2-values of sensitivity, specificity, PLR, NLR, and DOR were 380.81, 461.97, 441.12, 598.61, and 217.09, respectively, with all p-values less than 0.001, indicating a significant heterogeneity between studies. A SROC curve plotting the TP against the FP rates of individual studies was derived (Fig. 3). Our data showed that the SROC curve is positioned near the desirable upper left corner of the SROC curve, while area under curve (AUC) was 0.93 (SE=0.0123) with a Q* value of 0.865 (SE=0.0148), indicating a relative high level of overall accuracy.

Forest plot of estimates of sensitivity and specificity for glycosylated hemoglobin (HBA1c) in the diagnosis of gestational diabetes mellitus (GDM) (overall). The point estimates of sensitivity and specificity from each study are shown as solid circles and the size of each study is indicated by the size of the solid circle. Error bars are 95% confidence intervals.
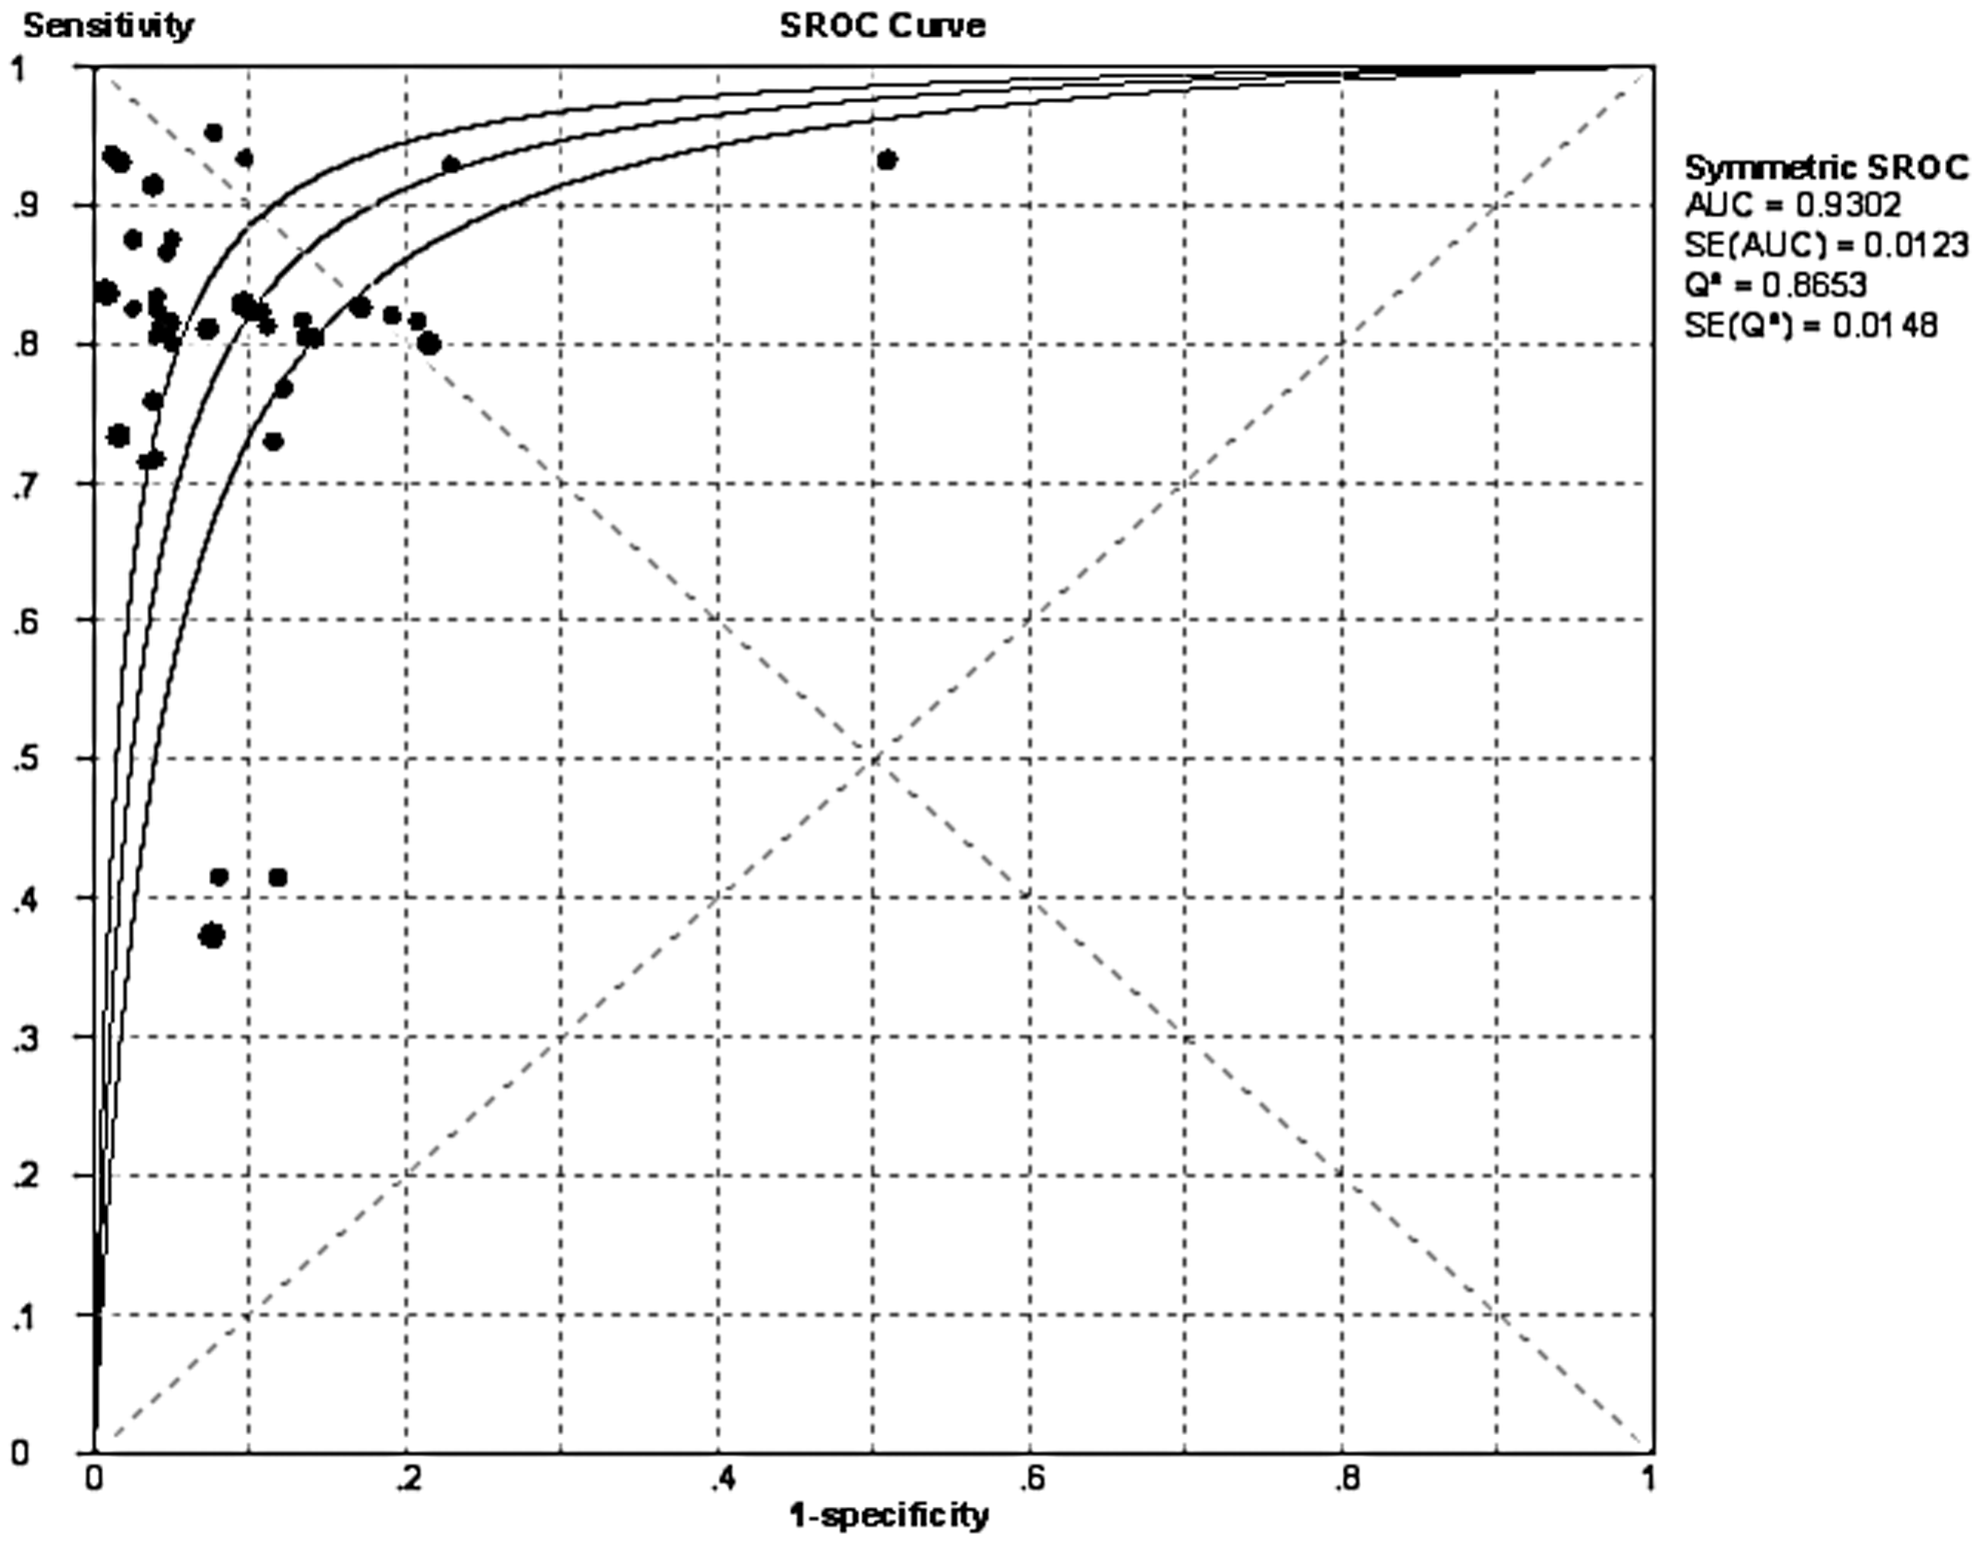
Summary receiver operating characteristic curve (SROC) for HBA1c (overall). Each solid circle represents each study in the meta-analysis. The size of each study is indicated by the size of the solid circle.
In the subgroup analysis for normal controls, the sensitivity ranged from 0.415 to 0.952 (0.791, 95% CI: 0.768-0.811; Fig. 4), while the specificity ranged from 0.785 to 0.992 (0.950, 95% CI: 0.941-0.957; Fig. 4). The PLR was 20.14 (95% CI: 5.13-79.04), the NLR was 0.20 (95% CI: 0.10-0.39), and the DOR was 99.43 (95% CI: 19.33-511.39). χ2-values of sensitivity, specificity, PLR, NLR, and DOR were 141.77, 163.09, 157.33, 223.70, and 130.00 respectively, with all p-values less than 0.001, indicating a significant heterogeneity between studies. Our data showed that the SROC curve is positioned near the desirable upper left corner of the SROC curve, while AUC was 0.96 (SE=0.0169) with a Q* value of 0.901 (SE=0.0240), indicating a high level of accuracy (Fig. 5).

Forest plot of estimates of sensitivity and specificity for HBA1c in the diagnosis of GDM (normal controls).
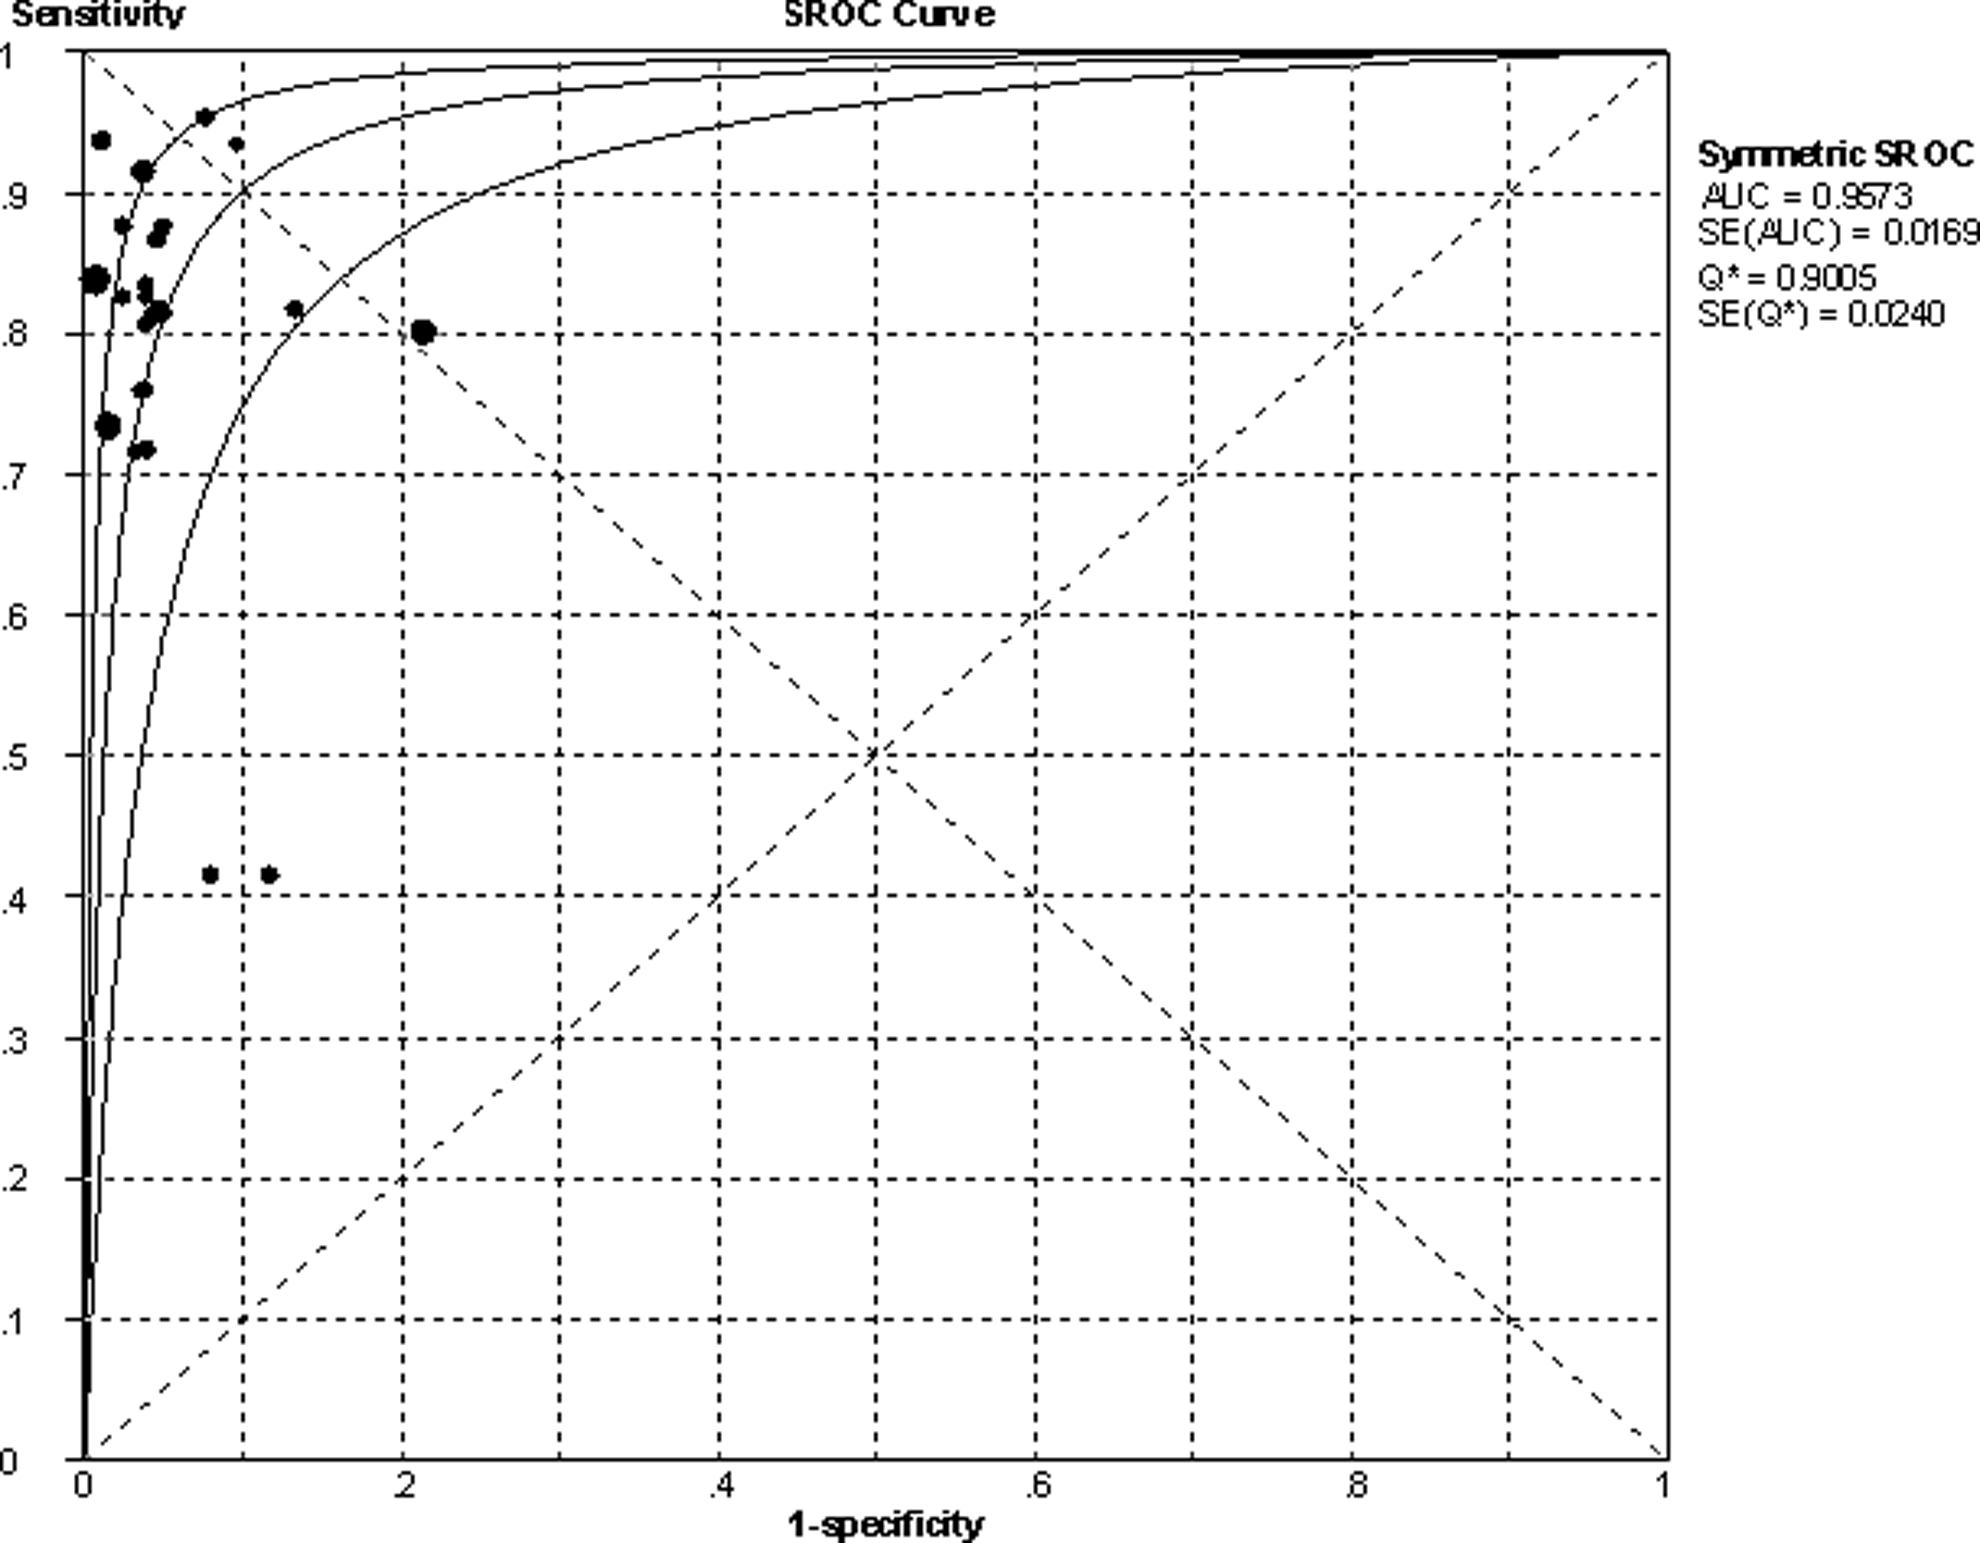
SROC curves for HBA1c (normal controls).
In the subgroup analysis for normal+impaired glucose tolerance (IGT) controls, the sensitivity ranged from 0.373 to 0.932 (0.724, 95% CI: 0.699-0.749; Fig. 6), while the specificity ranged from 0.491 to 0.950 (0.873, 95% CI: 0.859-0.885; Fig. 6). The PLR was 8.21 (95% CI: 3.77-17.89), the NLR was 0.20 (95% CI: 0.09-0.44), and the DOR was 41.40 (95% CI: 11.47-149.38). χ2-values of sensitivity, specificity, PLR, NLR, and DOR were 216.62, 161.20, 177.57, 305.55, and 56.03 respectively, with all p-values less than 0.001, indicating a significant heterogeneity between studies. Our data showed that the SROC curve is positioned near the desirable upper left corner of the SROC curve, while AUC was 0.91 (SE=0.0120) with a Q* value of 0.841 (SE=0.0132), also indicating a relatively high level of overall accuracy (Fig. 7).
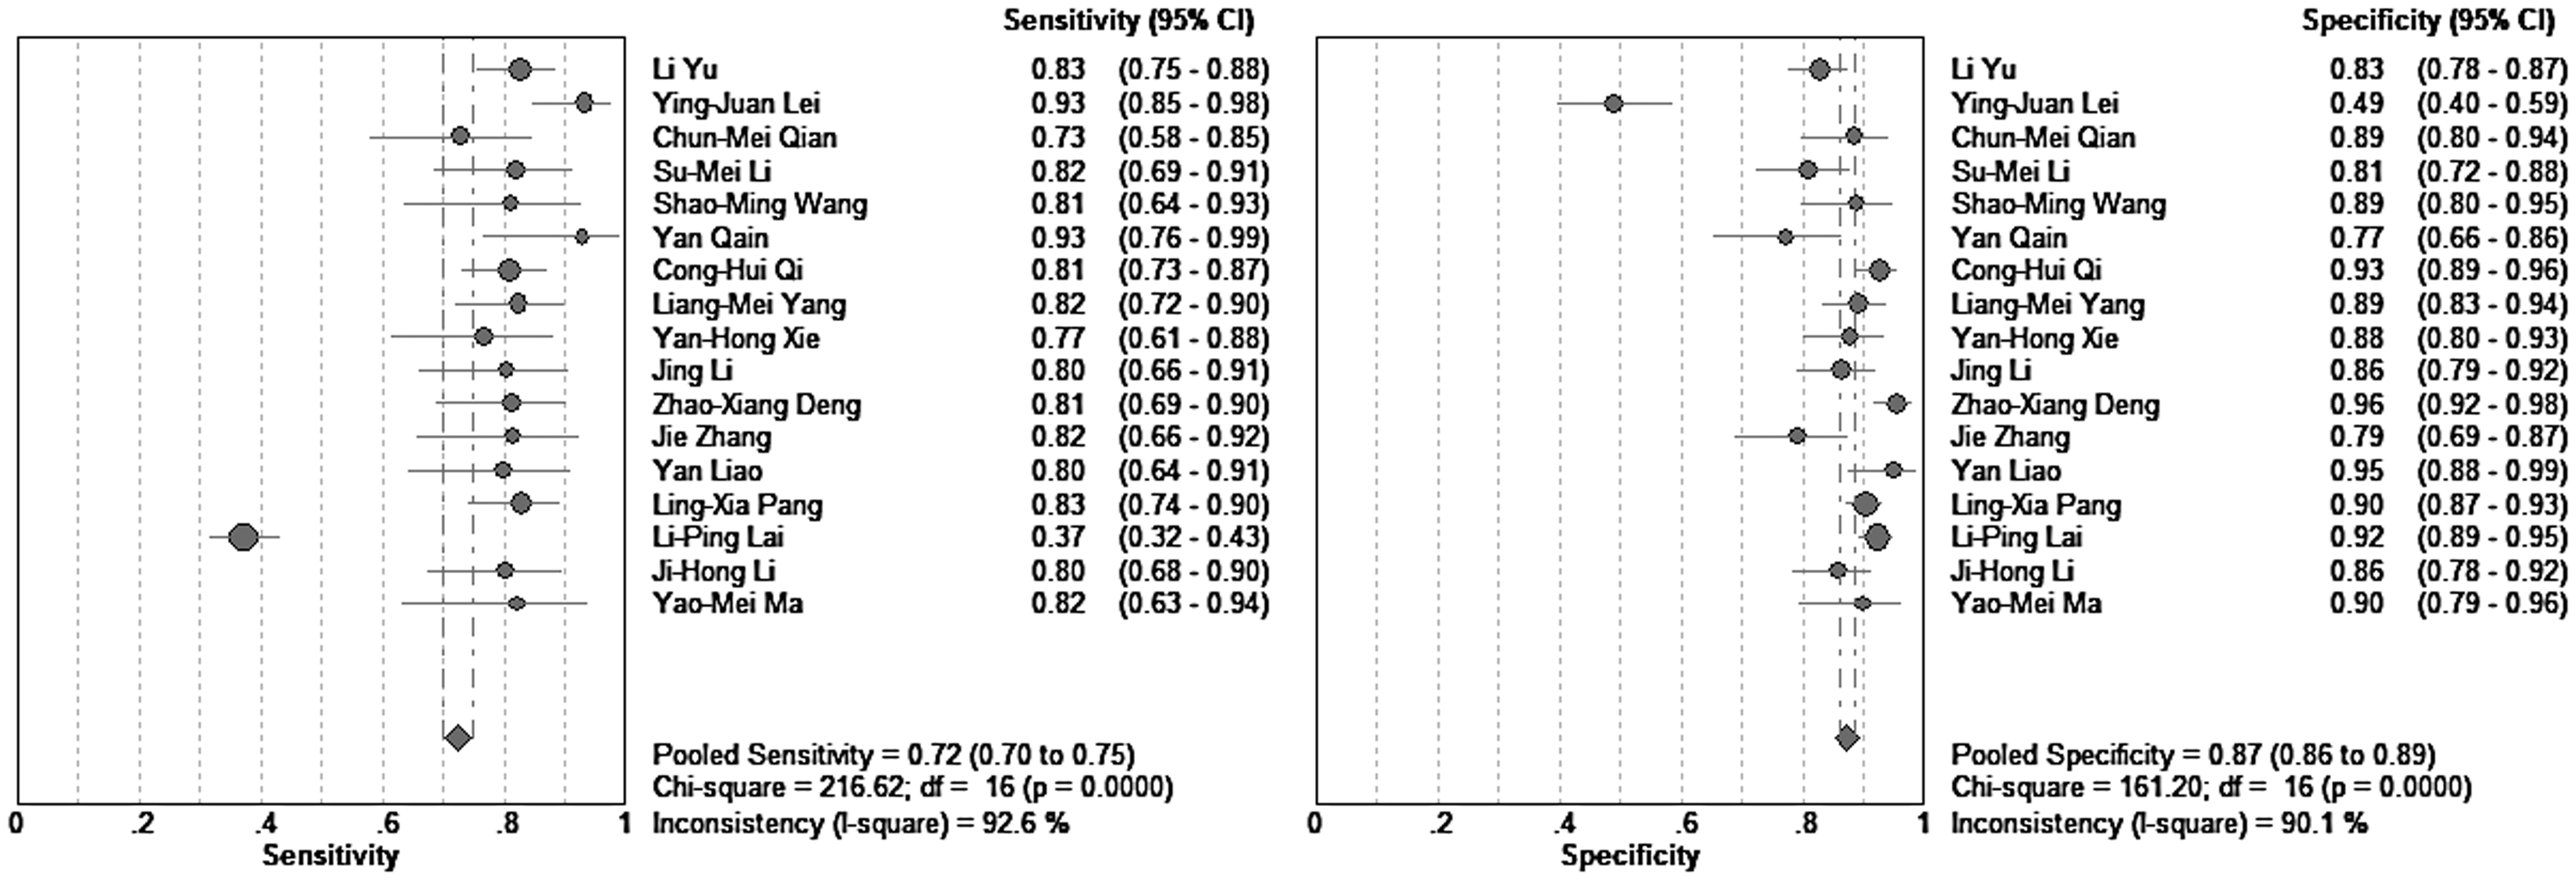
Forest plot of estimates of sensitivity and specificity for HBA1c in the diagnosis of GDM (normal+IGT controls). IGT, impaired glucose tolerance.
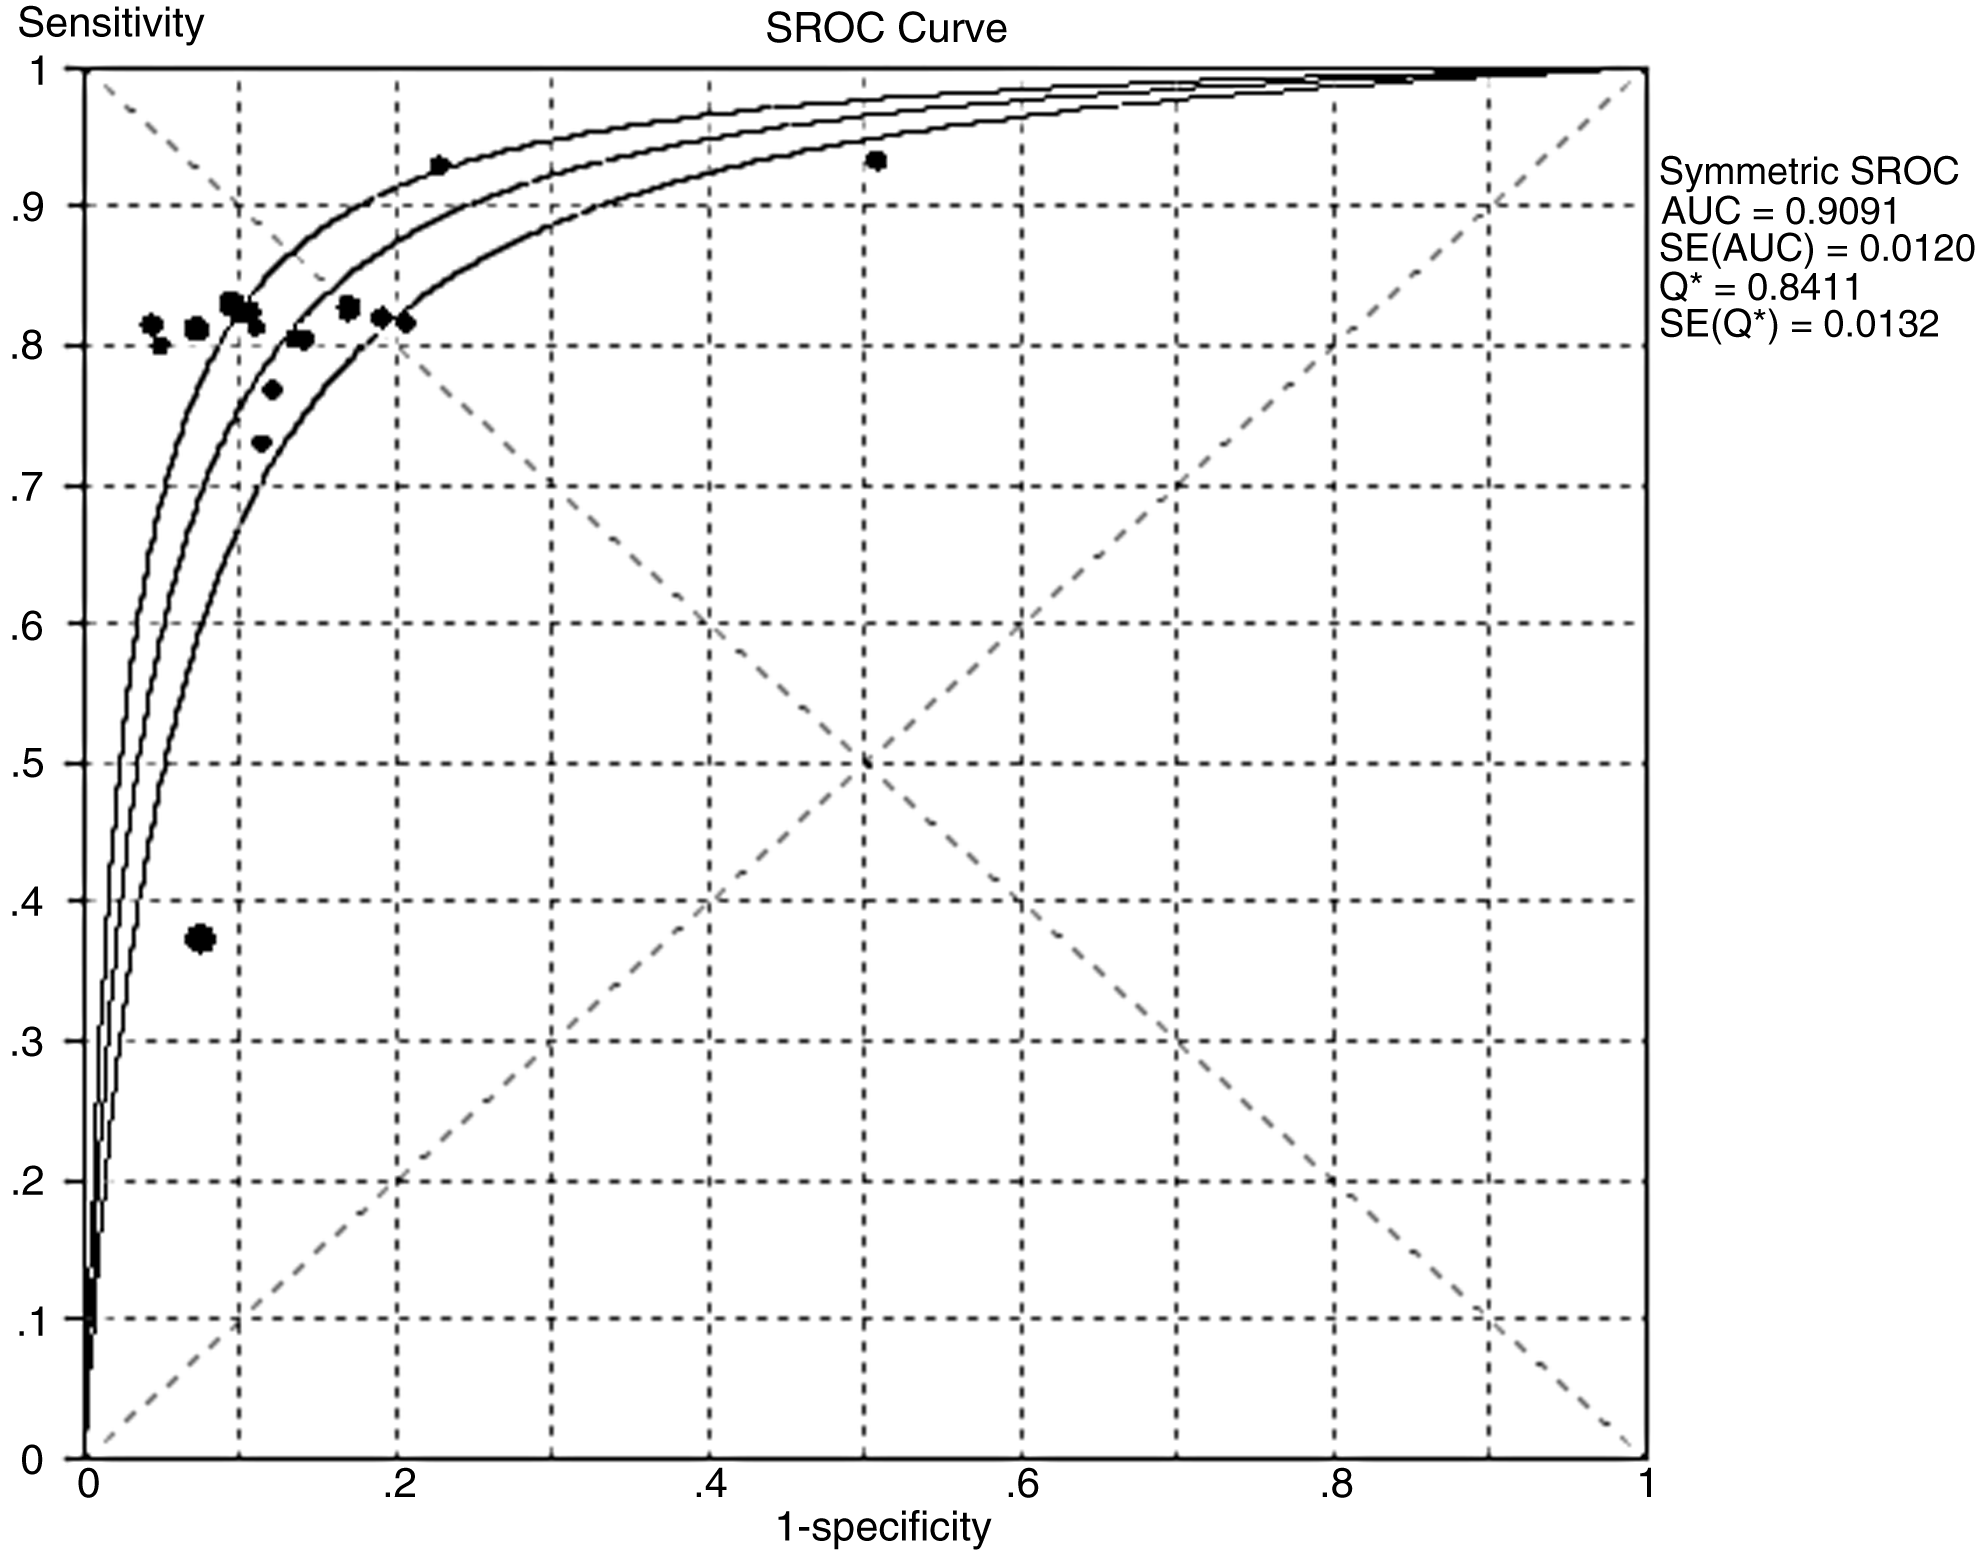
SROC curves for HBA1c (normal+IGT controls).
Multiple regression analysis and exploration for heterogeneity
By the use of QUADAS guidelines, a quality score for every study was compiled on the basis of the title and introduction, methods, results, and discussion (Table 1). A score of 1 was given when a criterion was fulfilled, 0 if a criterion was unclear, and −1 if the criterion was not achieved. These scores were used in the meta-regression analysis to assess the effect of study quality on RDOR of HbA1c in the diagnosis of GDM. Studies with higher quality (QUADAS ≥10) produced RDOR that were not significantly higher than those with lower quality. We also noted that the cutoff value (≤6.0% versus ≥6.0%) did not substantially affect diagnostic accuracy (Table 2). However, the source of controls (normal vs. normal+IGT) will affect the diagnostic accuracy, so the subgroup analysis is necessary.
RDOR, relative diagnostic odds ratio.
Publication bias
We detected significant publication bias in overall population analysis (Z=3.48, p=0.000). The funnel plots for publication bias (Fig. 8A) also show some asymmetry. Conversely, publication bias were not detected in two subgroup analyses (Znormal=0.77 Pnormal=0.444; Znormal+IGT= 0.37 Pnormal+IGT= 0.711. Fig. 8B, C).
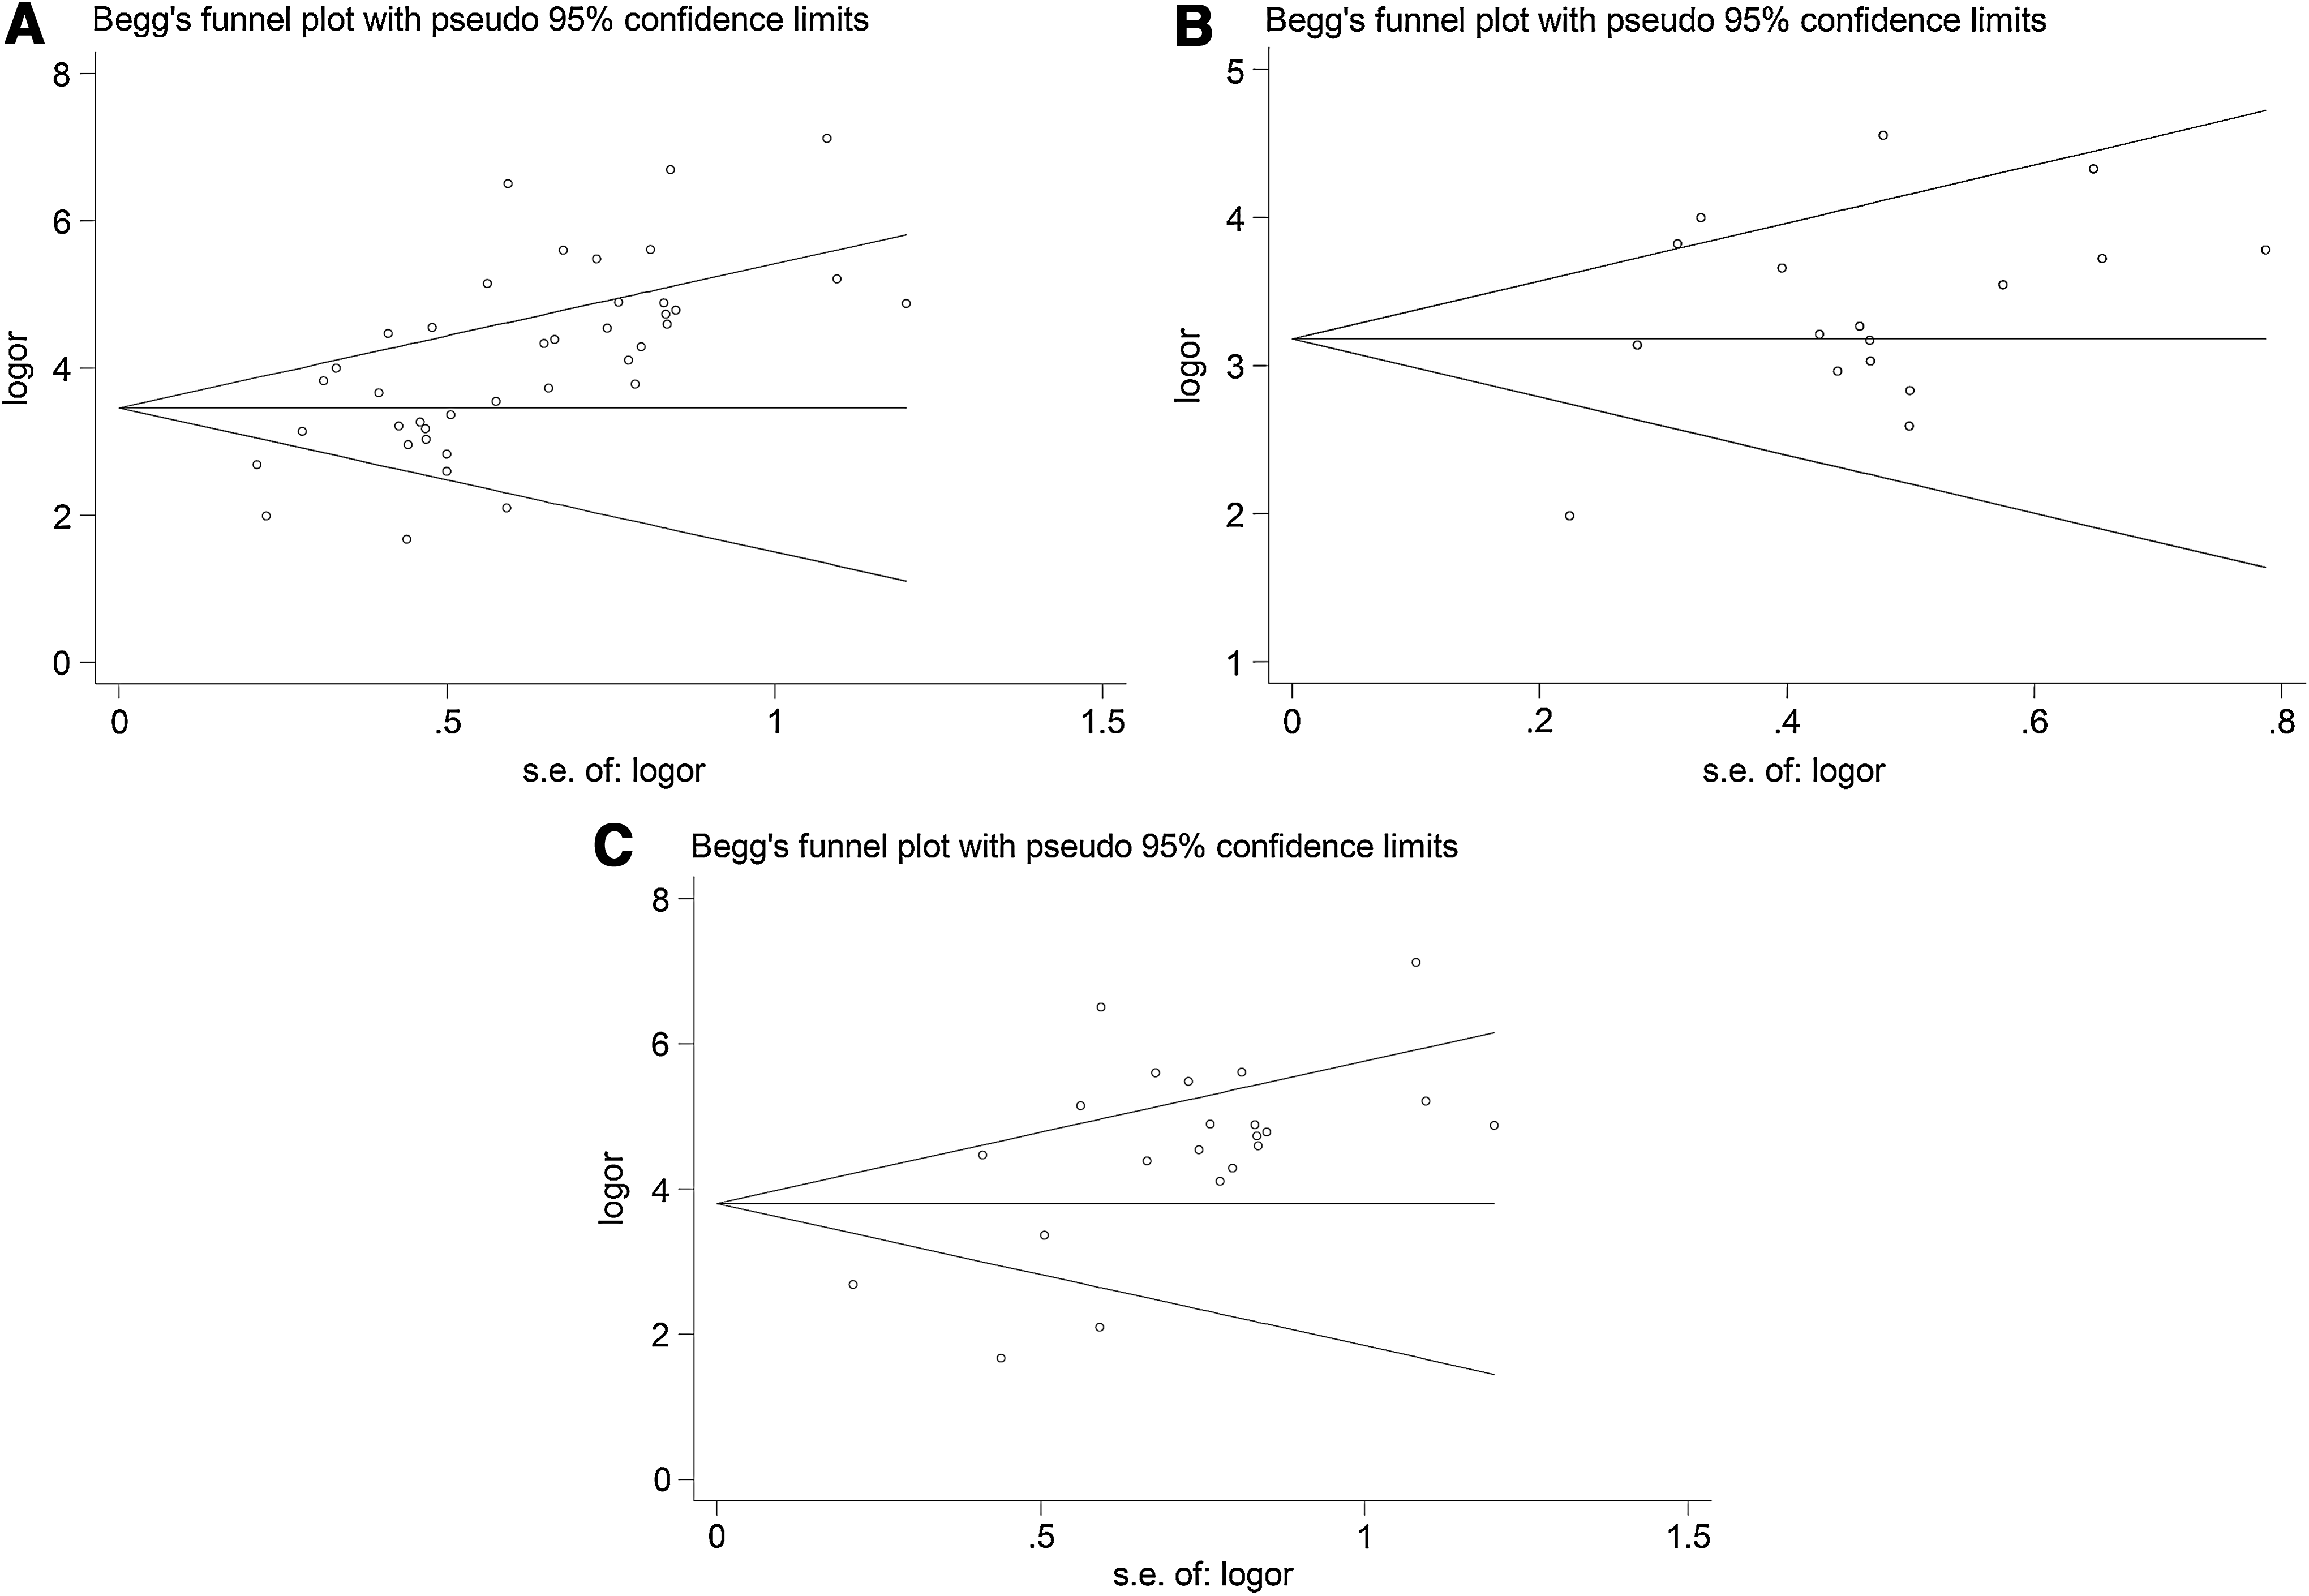
Funnel graph for the assessment of potential publication bias in HBA1c:
Discussion
GDM, defined as “glucose intolerance of any degree with onset or first recognition during pregnancy,” is a common complication in pregnancy. Incidence rates of GDM are increasing in all ethnic groups, reflecting the increased prevalence of obesity and T2DM within the general population. Both obesity and a family history of T2DM represent important risk factors for the development of GDM (Mokdad et al., 2003; Ogden et al., 2006; Lawrence et al., 2008). In the short term, GDM is associated with an increased risk of adverse obstetrical outcomes, particularly those related to fetal overgrowth, which include macrosomia, shoulder dystocia, birth injury, prematurity, and an increased Caesarean section rate (Casey et al., 1997).
The diagnosis of GDM has hitherto been an unsynchronized medley of different diagnostic criteria adapted from the criteria to diagnose T2DM (based on glycemic levels and risk of diabetes complications) and locally altered and adjusted. The Diabetes Control and Complications Trial (DCCT) & the United Kingdom Prospective Diabetes Study (UKPDS) have demonstrated the relationship between HbA1c and diabetic complications (The Diabetes Control and Complications Trial Research Group, 1995; Leslie, 1999). HbA1c plays an important role in the management of GDM as the vast majority of outcome studies on diabetic complications are based on it. HbA1c is formed via a posttranslational nonenzymatic attachment of glucose to hemoglobin in an irreversible fashion. In the chemical terms, the molecular structure of HbA1c is β-N-(1-deoxy)-fructosyl-hemoglobin and it serves as an indicator of glycemic control over the preceding 2- to 3-month period. Technically, it has now become a simpler test to perform, more standardized, user-friendly, and automated techniques are widely available. Although the accuracy of HBA1c detection for the diagnosis of GDM has been extensively studied, the exact role of these detections remains controversial. To our knowledge, this is the first comprehensive meta-analysis to synthesize data from various studies to get a convincing answer toward the question of whether HBA1c is useful for the diagnosis of GDM in a Chinese population.
The SROC curve is a technique for fitting a mathematical model to the scatter gram plot of sensitivity against (1-specificity). The area under the SROC curve (AUC) can summarize the inherent capacity of a test to discriminate the participant with disease from those without it. If a test has an AUC close to 1, it means that it is a perfect test. The poor test usually has AUC close to 0.5. In our meta-analysis, we can find that the AUC was 0.93, it indicated that the HBA1c is useful for diagnosis of GDM.
The DOR is related to different combinations of sensitivity and specificity, which describes the odds of positive test results in participants with the disease compared with the odds of positive test results in participants without the disease. The value of a DOR ranges from 0 to infinity, with higher values indicating the higher accuracy test performed. In the present meta-analysis, we found that the mean DOR values was 41.40 (95% CI: 11.47-149.38), indicating that HBA1c could be helpful in the diagnosis of GDM.
The SROC curve and the DOR cannot explain the clinical situation, while the likelihood ratios are considered to be more clinically meaningful. A likelihood ratio describes how many times a participant with disease is more likely to receive a particular test result than those without disease (Akobeng, 2007). In our present meta-analysis, a PLR of 8.21 suggests that patients with NPC have an eightfold higher chance of being HBA1c test-positive compared with patients without GDM. While the NLR was 0.20, all of these suggest a potential role for HBA1c determination in confirming GDM.
To assess the sources of heterogeneity in the studies, the meta-regression analysis was used. RDOR indicates a change in the diagnostic performance of the test in the study due to the increase of one unit of the corresponding covariable. In this meta-analysis, three variables, including QUADAS scores, cutoff value, and source of controls were used in the meta-regression analysis to assess the effect of study quality on RDOR. Studies with higher quality (QUADAS <10 vs. QUADAS ≥10) and a cutoff value (≤6.0% vs. ≥6.0%) produced RDOR values that were not significantly higher than those studies with lower quality, although the sensitivity, specificity, PLR, NLR, and DOR between these studies indicated a significant heterogeneity. However, the source of controls (normal vs. normal+IGT) will affect the diagnostic accuracy. To eliminate the possibility of bias, the sources of control-based subgroup analysis have been performed.
The limitations of this meta-analysis are as follows. (1) Because of the linguistic abilities of our study team, we only included Chinese and English articles; therefore, that might have led to language bias. (2) We excluded conference abstracts, letters to journal editors, and did not search for unpublished data, which probably caused publication bias. (3) Some original studies lack necessary data, such as the baseline character of the patient, the study design, and measurement techniques. Taking into account these flaws, we propose that in the design phase of a study, we must strictly comply with the command of international QUADAS to make sure that research is of high quality.
Overall, evidence suggests that HBA1c is a significant marker for Chinese patients with GDM. With high specificity and sensitivity, the HBA1c test plays an important role in confirming the diagnosis of GDM in a Chinese population.
Footnotes
Author Disclosure Statement
No competing financial interests exist.