




Abstract
Aims: The relationship between common haplotype-tagging polymorphisms (rs266729 [11365C>G], rs822395 [−4034A>C], rs822396 [−3964A>G], rs2241766 [45T>G], and rs1501299 [276G>T]) in the ADIPOQ gene and cancer risk has been investigated in different ethnic groups; however, these studies have yielded contradictory results. With this in mind, this meta-analysis was performed in an attempt to draw a more precise conclusion regarding the association between ADIPOQ polymorphisms and cancer risk. Results: In this study, with a total of 19 eligible articles consisting of 52 studies, the pooled odds ratios (ORs) for the association between ADIPOQ rs1501299 and cancer risk were statistically significant (dominant model, TT/GT vs. GG, OR=0.84, 95% confidence interval [CI]: 0.77-0.92; homozygous model, TT vs. GG, OR=0.80, 95% CI: 0.68-0.94). These results suggested that ADIPOQ rs1501299 might be a protection-associated polymorphism in cancer. The stratified analyses indicated that the variant T allele of ADIPOQ rs1501299 was associated with decreased risk of cancer in both Caucasian and Asian populations when compared with the G allele. No significant association for the rest of the polymorphisms was observed under any genetic model. Conclusions: This meta-analysis suggests that the ADIPOQ rs1501299 may be a protective factor for carcinogenesis.
Introduction
O
Adiponectin (ADIPOQ) is one of the recently identified adipocyte-secreted hormones that are exclusively synthesized in adipocytes (Hu et al., 1996; Weyer et al., 2001; Yamauchi et al., 2001; Eckel et al., 2005). More in vivo and in vitro (Grossmann et al., 2008; Nkhata et al., 2009) evidence identified that low serum adiponectin level was associated with cancer risk (Hotta et al., 2000; Al-Harithy and Al-Zahrani, 2012). Recent evidence indicated that mechanisms of carcinogenesis of ADIPOQ might be via both direct and indirect ways. Increasing studies revealed that single-nucleotide polymorphism (SNP) in the ADIPOQ gene was associated with low plasma level of adiponectin and cancer risk as well (Teras et al., 2009); therefore, it is reasonable to hypothesize that ADIPOQ gene variations may modulate the risk of human cancer.
The human ADIPOQ gene is highly polymorphic with at least 620 reported variants according to the dbSNP database (www.ncbi.nlm.nih.gov/SNP). To our knowledge, numerous studies have mainly focused on the associations between five common haplotype-tagging SNPs of ADIPOQ gene (including rs266729 [11365C>G], rs822395 [−4034A>C], rs822396 [−3964A>G], rs2241766 [45T>G], and rs1501299 [276G>T]) and cancer risk (Kaklamani et al., 2008a, 2008b; Beebe-Dimmer et al., 2010; He et al., 2011). Nevertheless, conflicting results were observed among those studies (Xu et al., 2013). The possible reason was the small sample sizes, mixed genetic backgrounds, and heterogeneous inclusion criteria. Considering that three recent meta-analyses have also reached inconsistent associations even with the similar studies (Fan et al., 2013; Xu et al., 2013; Zhou et al., 2013), we performed this study. In this meta-analysis, we collected all the eligible published studies and conducted a quantitative analysis to examine whether the five common haplotype-tagging SNPs in ADIPOQ gene modify the risk of human cancer. Additionally, we also analyzed the possible reasons for the difference between the published meta-analyses and this study.
Materials and Methods
Search strategy
A comprehensive literature search was conducted independently by two investigators (Q. Li and Y. Ma) for articles regarding associations between ADIPOQ SNPs and human cancer risk using MEDLINE, SCOPUS databases, Chinese National Knowledge Infrastructure (CNKI) (before September 12, 2012) with the search terms: “ADIPOQ or adiponectin,” “polymorphism, variant or SNP,” and “cancer or carcinoma.” The inclusion criteria for the meta-analysis were as follows: (1) independent case-control or nested case-control studies; (2) sufficient raw data on genotype frequencies provided to estimate odds ratios (ORs) and their 95% confidence intervals (CIs); (3) at least one or more of the following ADIPOQ SNPs was included: rs266729 (11365C>G), rs822395 (−4034A>C), rs822396 (−3964A>G), rs2241766 (45T>G), and rs1501299 (276G>T).
An extended computerized literature search was conducted according to the reference lists of the retrieved original articles (including meta-analysis and review). For the studies with the same or overlapping data by the same authors, we selected the ones with the most subjects. The flow chart is shown in Figure 1.

Flowchart on included studies.
Data extraction
Two authors (W. Sang and W. Cui) independently extracted data from all the publications in compliance with the inclusion criteria. And all disagreements were resolved by discussion with a third reviewer. For each study, the following information was reviewed and extracted if possible: the first author's surname, year of publication, country of origin, ethnicity, control source, cancer types, total number of cases and controls, genotype methods, and genotyping data.
Statistical analysis
In the current meta-analysis, the chi-square goodness of fit was used to evaluate the Hardy-Weinberg equilibrium (HWE) of each polymorphism in the control groups. If the cutoff value of HWE was conflicting in the published studies, studies with p-value less than 0.05 were considered with caution (Balding, 2006). ORs with 95% CIs were used to assess the strength of associations between ADIPOQ SNPs and cancer risk. For each SNP, the frequency of alleles (V: variant and W: wild) and genotypes in both cases and controls were analyzed. Moreover, genetic models of SNPs, including homozygote effect model (VV vs. WW), dominant effect model (VV/WV vs. WW), and recessive effect model (VV vs. WV/WW), were adopted to assess the cancer risk. In addition to the pooled comparisons among all subjects, a stratified analysis was performed to examine the effect estimates. And subgroups with multiple ethnic descendants or mixed tumor types were excluded so as to avoid the potential confounding factors. We mainly focused on subgroups with more than three studies to avoid possible selection bias.
The between-study heterogeneity across all of the comparisons was calculated using the χ2-based Q statistic with significant discrepancy level of p<0.10 and the pooled ORs were tested by Z test and I2 statistics. In our analysis, the fixed-effects model was prioritized, and the random-effects model was considered only if the between-study heterogeneity was present. Finally, sensitivity and publication bias analyses were evaluated, followed by Egger's linear regression test (Egger et al., 1997). Analyses were performed with STATA software (version 11.0; Stata Corporation, College Station, TX) and SAS software (version 9.1; SAS Institute, Cary, NC). All the p-values were two-sided, and p-values less than 0.05 were considered significant.
Genotype-phenotype correlation analysis
We analyzed the possible associations between significant ADIPOQ polymorphism and ADIPOQ transcript (mRNA) expression levels based on the online database systems. The genotyping data were from the international HapMap phase II release #23 data set (www.hapmap.org). The data of gene expression levels in the same HapMap individuals were from GENEVAR (GENe Expression VARiation, www.sanger.ac.uk/resources/software/genevar). Student's t-test and analysis of variance test were used to evaluate the differences in the relative mRNA expression levels among different genotype groups.
Results
Literature search and study selection
According to the search criteria and workflow, 19 eligible articles consisting of 52 studies were identified. There were 10, 7, 8, 12, and 15 studies regarding rs266729 (5024 cases and 5545 controls) (Kaklamani et al., 2008a, 2008b; Pechlivanis et al., 2009; Beebe-Dimmer et al., 2010; Cui et al., 2011; He et al., 2011; Liu et al., 2011), rs822395 (2690 cases and 3265 controls) (Kaklamani et al., 2008a, 2008b, 2011; Beebe-Dimmer et al., 2010; He et al., 2011), rs822396 (3611 cases and 4176 controls) (Kaklamani et al., 2008a, 2008b, 2011; Carvajal-Carmona et al., 2009; Beebe-Dimmer et al., 2010; He et al., 2011), rs2241766 (4936 cases and 5452 controls) (Kaklamani et al., 2008a, 2008b; Moore et al., 2009; Beebe-Dimmer et al., 2010; Partida-Perez et al., 2010; He et al., 2011; Tang et al., 2011), and rs1501299 (4268 cases and 6299 controls) (Al Khaldi et al., 2011; Al-Harithy et al., 2012; Doecke et al., 2008; Kaklamani et al., 2008a, 2008b, 2011; Beebe-Dimmer et al., 2010; Partida-Perez et al., 2010; He et al., 2011; Liu et al., 2011; Keku et al., 2012; Tsilidis et al., 2009; Wang et al., 2009), respectively (Table 1). Most studies were in accordance with HWE except for six, which were considered with caution (Kaklamani et al., 2008a, 2008b, 2011; Cui et al., 2011). Although all those eligible studies were pathologically confirmed and matched well with controls by ethnicity and geographic location, however, information on the family hereditary disease was not consistently introduced in studies of the current meta-analysis. For example, Carvajal-Carmona et al. (2009) provided sporadic carcinoma cases. Liu et al. (2011) provided both sporadic and hereditary cancers in case populations but failed to describe hereditary background for control subjects.
Some substudies were excluded due to deviation from the HWE of control population.
HB, hospital-based population; PB, population-based population; HWE, Hardy-Weinberg equilibrium; RFLP, restriction fragment length polymorphism; SNPs, single-nucleotide polymorphisms.
Summary statistics
rs1501299 (276G>T) polymorphism
When all studies were pooled together in this meta-analysis, no significant difference in the distributions of allele frequency between case and control subjects was observed (p=0.852). Nevertheless, the pooled genotype distributions were significantly different between cases and controls with more TT/GT genotype in controls (p=0.011). Additionally, in the stratified analyses by ethnicity, there were no significant differences in both allele frequencies and genotype distributions for rs1501299 between case and control subjects.
rs822395 (−4034A>C) polymorphism
For rs822395 polymorphism, no overall difference in allele frequency and genotype distributions was observed between case and control subjects; however, significant more C allele frequency in controls was observed in Asian (p<0.0001) and prostate cancer subgroups (p=0.021) when compared with C allele in cases accordingly. Additionally, more CC/AC genotype counts in controls of Asian descent (p=0.0002) and prostate cancer subgroups (p=0.0024) were observed.
rs266729 (11365C>G) polymorphism
Overall, no significant difference in the distribution of allele frequency and genotypes between case and control subjects was observed (p=0.078 and 0.618, respectively); however, the pooled value became statistically different when three studies with the HWE p-value less than 0.05 were excluded (Kaklamani et al., 2008a, 2008b, 2011). Additionally, the G allele was more frequent in cases (p=0.0038) when compared with that of controls. Overall, GG/CG genotype counts were significantly more frequent in cases than in controls (p=0.018).
For rs822396 and rs2241766, no significant difference in the distribution of allele frequencies and genotypes was observed between cases and controls when analyzed with or without studies with HWE p-value less than 0.05.
Quantitative synthesis
The main results of the meta-analysis about ADIPOQ polymorphisms are listed in Table 2. When all the eligible studies were pooled together, risk estimates suggested that the associations between rs1501299 polymorphism and overall risk of human malignancy were statistically significant with OR (95% CI) of 0.90 (0.84-0.96), 0.83 (0.71-0.97), 0.88 (0.81-0.95), and 0.86 (0.75-0.99) for T versus G allele, TT versus GG, GT/TT versus GG, and TT versus GT/GG by the fixed effects, respectively. Statistically associations of rs1501299 with cancer risk were found significant in ethnic and tumor type subgroups when estimated under stratified analyses. For instance, the variant T allele was associated with human malignancy risk in Asian populations with OR (95% CI) of 0.82 (0.72-0.94) when compared with the G allele. Additionally, it was found that an individual with rs1501299 GT/TT genotype was associated with prostate cancer with OR (95% CI) of 0.81 (0.67-0.97) when compared with those with GG genotype in this meta-analysis. Overall, rs1501299 appears to be a protection-associated SNP (Fig. 2).
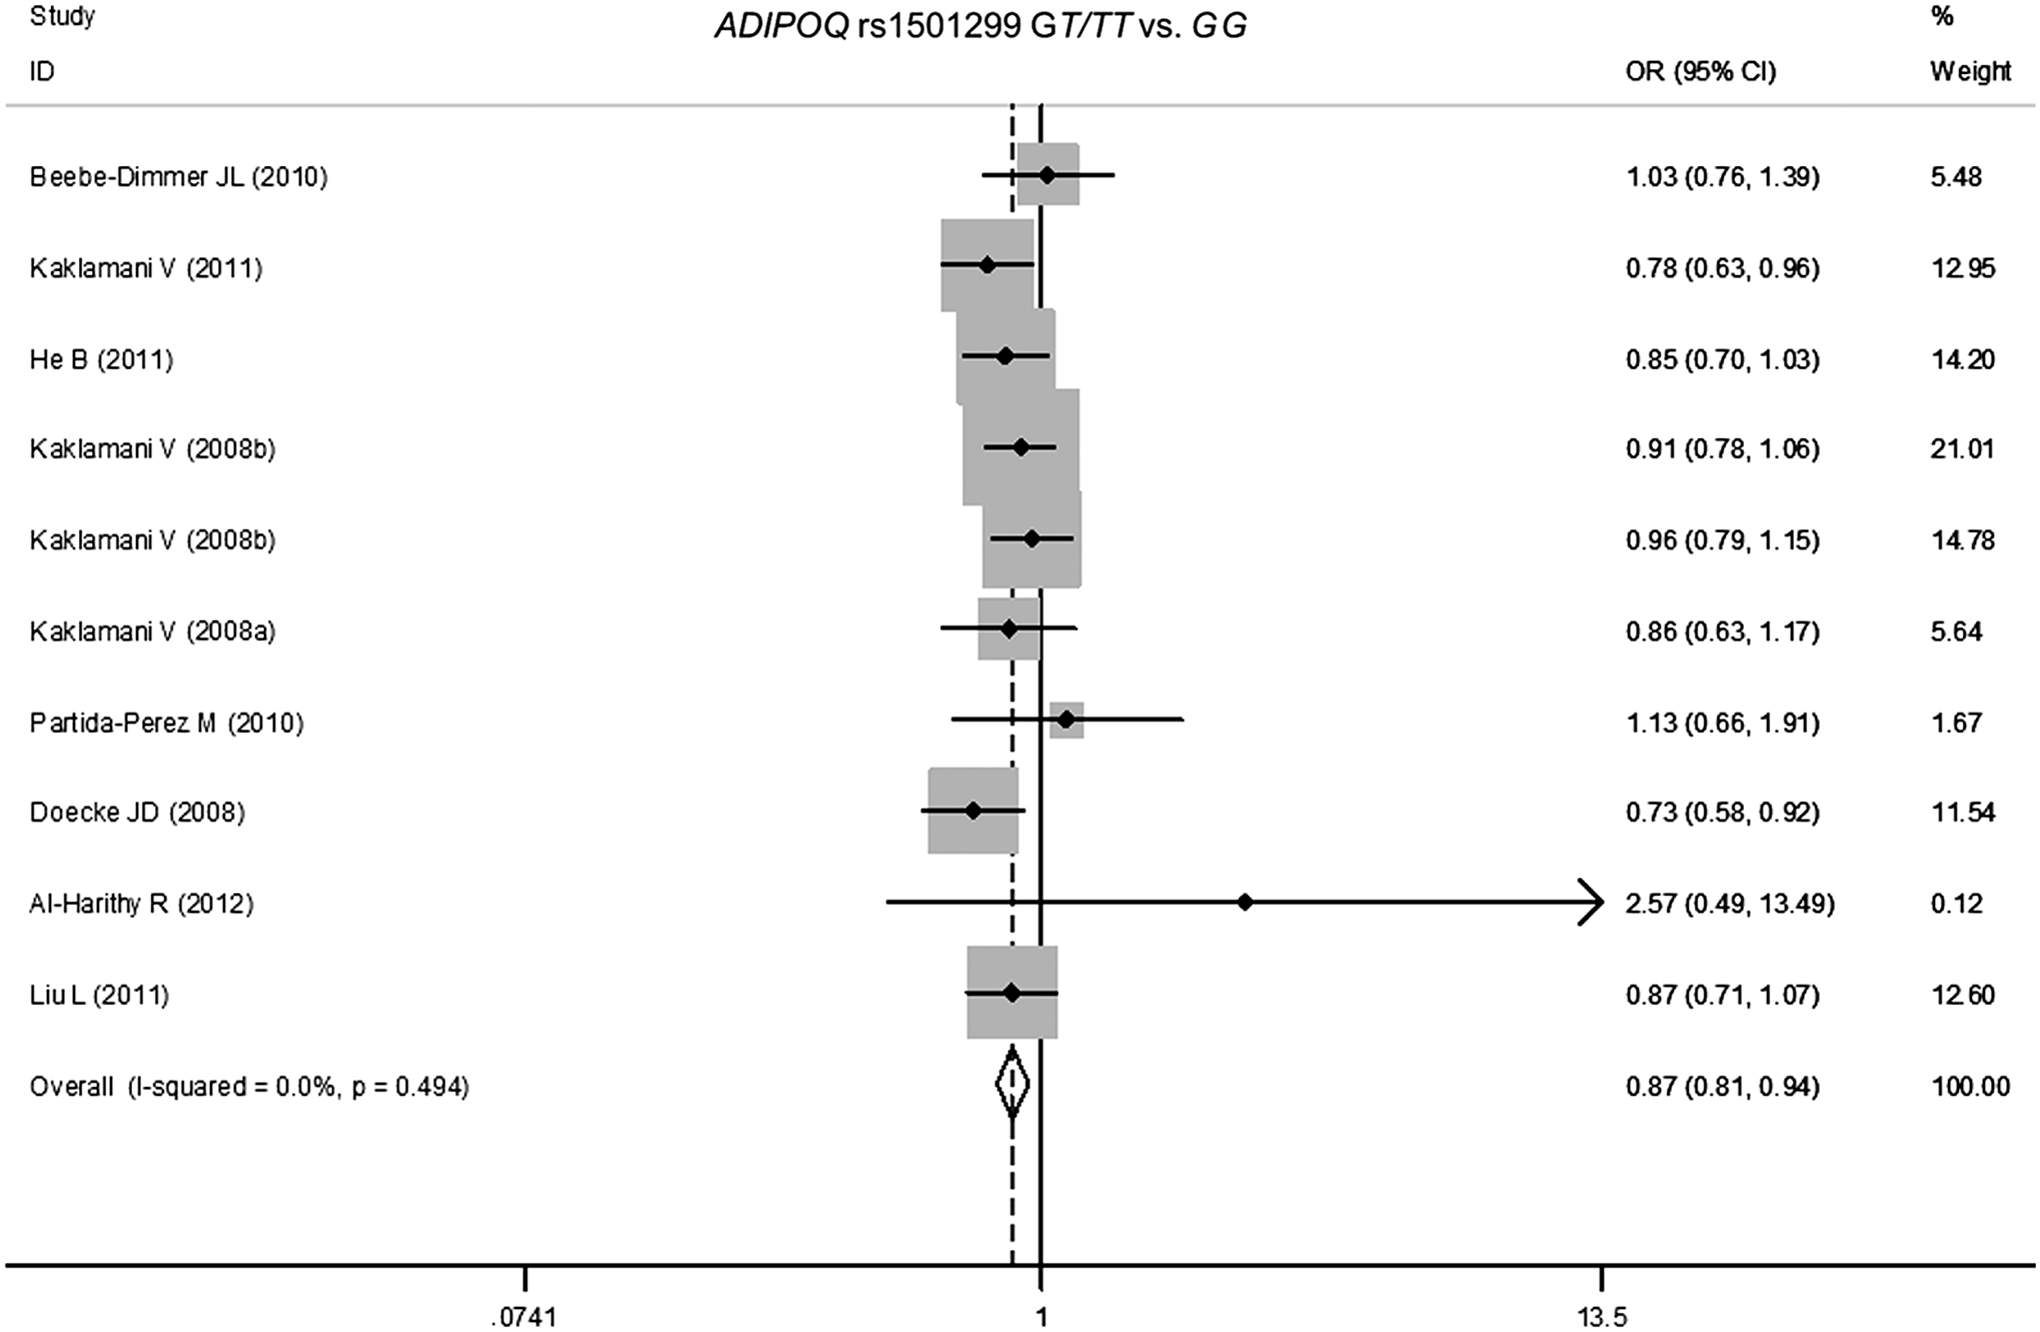
Overall odds ratios (ORs) for associations between ADIPOQ rs1501299 SNPs and cancer risk on dominant model (GT/TT vs. GG). The size of the squares indicates the relative weight of each study. Weights were derived from fixed-effects analysis. Bars, 95% confidence interval (CI). SNPs, single-nucleotide polymorphisms.
The p-value of χ2-based Q statistic.
D+L random-effect ORs (95% CI), otherwise Mantel-Haenszel fixed-effect ORs (95% CI).
The results were in bold if the 95% CI excluded 1 or p<0.05.
OR, odds ratio; CI, confidence interval; CRC, colorectal cancer; PC, prostate cancer; V, variant allele; W, wild allele.
For rs822395 (−4034A>C), rs822396 (−3964A>G), rs266729 (−11365C>G), and rs2241766 (45T>G) polymorphisms, pooled or stratified analyses did not yield a significant association between the variants of interest and risk of cancer.
Next, we recalculated the estimates of the associations between SNPs and cancer risk, while excluding studies that deviated from HWE. It was found that the removal of those studies did not qualitatively change our findings, despite some direction of OR was changed in some risk estimates. For example, the pooled ORs for the associations between rs266729 and cancer risk (GG/GC vs. CC and GG vs. CC/GC comparisons) changed from 0.93 to 1.04 and from 0.88 to 1.06, respectively. Likewise, the pooled OR for the association between rs822396 and cancer risk (G vs. A allele comparison) changed from 0.96 to 1.02. Other similar alterations are listed in Supplementary Table S1 (Supplementary Data are available online at www.liebertpub.com/gtmb).
Sensitivity and publication bias analyses
The leave-one-out sensitivity analysis was performed for every SNP in this meta-analysis. Omitting any single study did not change the pooled ORs for each SNP qualitatively. The shape of the most funnel plot for SNPs did not reveal any evidence of obvious asymmetry, indicating no publication bias were observed (Supplementary Figures S1-S5).
Correlation between ADIPOQ rs1501299 genotypes and ADIPOQ transcript expression levels
For the 124 individuals whose genotyping and expression data were available for the analysis, there were 19 GG carriers, 20 GT carriers, and 4 TT carriers in Chinese populations (Fig. 3A). And 46 GG carriers, 28 GT carriers, and 7 TT carriers were observed in Caucasian populations (Fig. 3B). No significant associations were observed between ADIPOQ mRNA expression and rs1501299 genotypes in any of the considered ethnicities (Chinese and Caucasian populations). However, the ADIPOQ mRNA expression was significantly higher in GG carriers of Chinese populations than that of GG carriers of Chinese populations (p<0.0001, Fig. 3C).
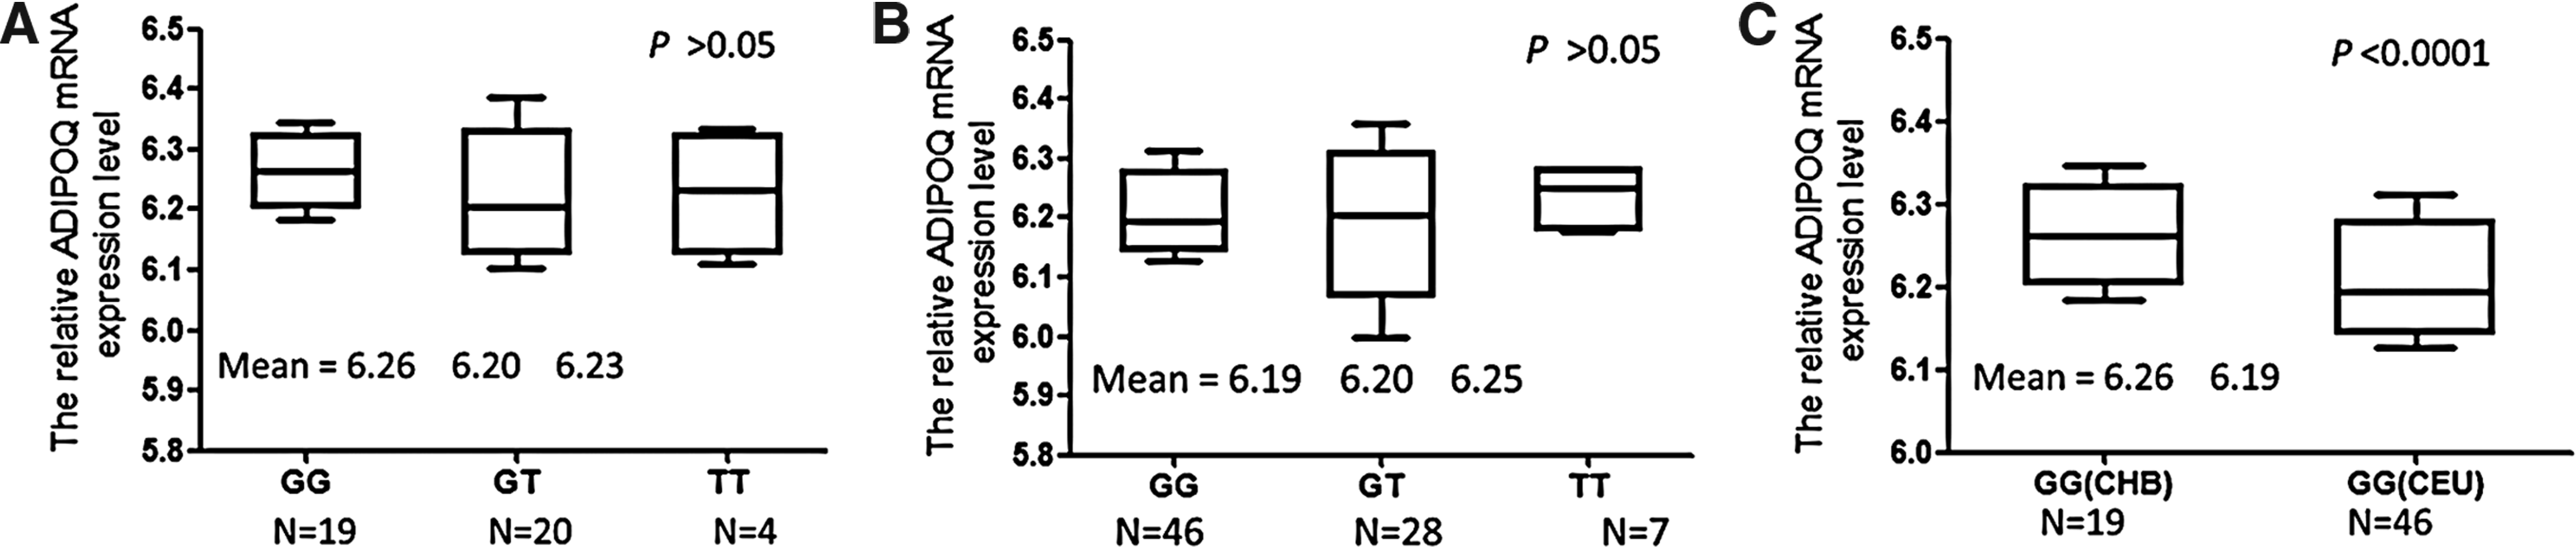
The associations between ADIPOQ rs1501299 genotypes and mRNA expression levels.
Discussion
Accumulating evidence has suggested that polymorphisms in the ADIPOQ gene are probably promising biomarkers in the prediction of cancer risk; however, results remained inconsistent. To the best of our knowledge, this is the first meta-analysis involving five common haplotype-tagging SNPs simultaneously to evaluate the associations between ADIPOQ SNPs and human cancer risk. This meta-analysis indicated that ADIPOQ SNPs rs1501299 T allele most likely associated with decreased cancer risk when compared with the G allele. This result was consistent with the previously published meta-analysis by Xu et al. (2013) investigating the association of ADIPOQ SNPs with cancer risk. They also demonstrated that the G allele of rs2241766 was a potential protection factor for cancer risk especially in Caucasian descendants (eight studies), which was not seen in the current meta-analysis (six studies). The reason why the two studies included by Xu et al. was not recruited by us was that one study involved mixed ethnicity (Tang et al., 2011), and the genotyping data of the other study (Yi et al., 2011) had already been published by Kaklamani et al. (2008b). As shown in Table 2, risk estimates in both pooled and stratified analyses indicated that individuals with rs1501299 TT/GT genotypes have decreased risk of cancer, supporting that rs1501299 TT/GT genotypes might be a promising biomarker in predicting cancer risk. Our results demonstrated that rs1501299 appeared to be associated with decreased cancer risk under all the tested genetic models in pooled analyses. Given the genetic variation rarely exert, it was plausible to speculate that not only genetic variation of ADIPOQ gene but also some factors unknown were involved in carcinogenesis. The mechanism is not clear and further meticulous investigation and validation are needed.
Although epidemiological evidence has indicated the associations between ADIPOQ SNPs and cancer susceptibility, the exact role of ADIPOQ SNPs in carcinogenesis has not yet been well elucidated to date. The five haplotype-tagging variants of interest locate in the 5′ near gene (rs266729), intron 1 (rs822395, rs822396), exon 1 (rs2241766), and intron 2 (rs1501299), respectively. ADIPOQ rs1501299 variation was a member of a haplotype block in the ADIPOQ gene, in which rs1501299 share a modest degree of linkage disequilibrium with rs3821799 (r2=0.47), rs3774261 (r2=0.59), rs6773957 (r2=0.59), and rs106358 (r2=0.59), respectively. It has been shown that variant rs3821799 is associated with body weight (Kyriakou et al., 2008), that rs1063538 is associated with increased colorectal cancer risk via interaction with smoking status and body mass index, and that rs6773957 is strongly associated with adiponectin serum level (Hivert et al., 2008; Ling et al., 2009). Additionally, variant rs6773957 was predicted to be involved in the binding site between ADPIOQ gene and miRNA 219-1-3p and/or miRNA 331-5p. Therefore, roles of rs1501299 in carcinogenesis might be explored by focusing on those potential functional SNPs.
All of these observations in this study were suggestive but certainly not conclusive. It is difficult to predict which variant may be the real event causative of the phenomena above. HWE is considered an important parameter for genetic research with the traditional cutoff p<0.05 defined as the deviation from HWE; however, a p-value of 10−3 or 10−4 was designed as significance level in some studies (Balding, 2006). In the current meta-analysis, cancer risk was calculated with or without inclusion of the studies employing HWE p<0.05. Our results indicated that those studies with HWE p-value less than 0.05 should be considered with caution.
Two meta-analyses involving in the five tagging SNPs of ADIPOQ gene were recently published (Supplementary Table S2). Zhou et al. observed that rs2241766 polymorphism was associated with cancer risk in Arabian populations under the recessive model (two studies); however, publication bias is very likely to occur when the analysis conducted depended on less than 10 studies (Higgins et al., 2002; Schmid et al., 2004). Additionally, in most of the epidemiological studies, ethnicity has been often classified into Caucasian, Asian, and African populations. That is the reason why we did not treat Arabian as a separate subgroup as did by Zhou et al. Additionally, Zhou et al. also reported significant findings based on the stratified analyses by the source of control. Theoretically, hospital-based populations (HB) are more likely to carry special genetic variations when compared with population-based populations (PB); however, for meta-analysis, the source of control of each eligible study might be from various departments of the hospital; therefore, the genetic background of HB might be similar to that of PB. With this in mind, stratified analysis by the source of control was not performed in the current meta-analysis. Increasing evidence has indicated that both genetic background and environmental factors contribute to carcinogenesis; however, the effects of genetic background have been often underestimated due to the various inclusion criteria of ethnicity. Actually, most of the studies consisted of mixed ethnicity especially in the globalized world nowadays, which might mainly explain why the stratified estimates based on ethnic subgroup were inconsistent in most studies.
Certainly, there are some unavoidable limitations in our meta-analysis. First, individuals with hereditary or family-related cancer might have a tendency to develop cancer. Unfortunately, such genetic backgrounds for the participants were missing in most of the included studies. Second, the stratified study count was too small to teach reliable findings. Therefore, conclusion should be interpreted with caution, if any.
In conclusion, ADIPOQ rs1501299 variant is associated with decreased risk of developing cancer. However, some other stratified statistically significant associations between ADIPOQ polymorphisms and cancer risk should be considered with caution. And further studies with sufficient power are needed to evaluate such associations.
Funding
This study was supported by the grant from “Project of the Foundation and Application of the Comprehensive Pathologic Diagnostic Platform” Recruitment at technology program of Xinjiang Uygur Autonomous Region (201233142).
Footnotes
Author Disclosure Statement
No competing financial interests exist.
References
Supplementary Material
Please find the following supplemental material available below.
For Open Access articles published under a Creative Commons License, all supplemental material carries the same license as the article it is associated with.
For non-Open Access articles published, all supplemental material carries a non-exclusive license, and permission requests for re-use of supplemental material or any part of supplemental material shall be sent directly to the copyright owner as specified in the copyright notice associated with the article.
