




Abstract
Background: The average length of telomeres as measured in genomic DNA from human peripheral blood leukocytes is proving to be a potential biomarker of great interest, particularly with respect to studies of aging, specific diseases, and the effects of various stresses on overall health. Aims: The aim of this study was to establish an effective real-time quantitative polymerase chain reaction (qPCR) method for telomere length measurement on the Roche LightCycler® 480 (LC480) real-time PCR platform. Methods: Measurement of relative average telomere length was achieved by comparing products amplified from telomere-specific primers and single copy reference gene primers in a ratio (T/S). Results: Extensive testing led us to conclude that a modification of the original two-plate T/S assay was more compatible with this platform than the recently developed single-plate assay, and that choice of hot-start Taq polymerase and intercalating dye were critical factors. Conclusions: This modified assay generates reliable measurements as judged by correlation with data derived by the telomeric restriction fragment Southern blot-based method.
Introduction
H
Several methods can be used to measure telomere length, including telomeric restriction fragment (TRF) analysis by Southern blotting (Harley et al., 1990), quantitative polymerase chain reaction (qPCR) (Cawthon, 2002, 2009), and Flow-FISH that combines fluorescent in situ hybridization with flow cytometry (Rufer et al., 1998). These methods each measure different aspects of telomere length in cell populations, single cells or individual chromosomes, and each has its own limitations. For example, TRF measurement requires large amounts of good quality DNA and is not amenable to high-throughput analysis; Flow-FISH requires metaphase-arrested cells or proliferating cells and cannot be applied retrospectively to cohorts for which DNA has been extracted. The requirement either for relatively large amounts of DNA (TRF) or live cells (Flow-FISH) led us to choose the qPCR method. In addition, qPCR is more amenable than other methods to analysis of many samples.
Currently, qPCR is the preferential method of telomere length measurement. This method requires the amplification of telomeric DNA (T) and a single copy reference gene (S) from genomic DNA (Cawthon, 2002). This can be performed in either a single or multiplex reaction format (monochrome multiplex quantitative PCR [MMQPCR]), providing a relative measure of average telomere length using the T/S ratio (Cawthon, 2002, 2009). The qPCR methods correlate well with data derived by the TRF assay, although qPCR methods are reported to have a greater measurement error than TRF and can show substantial variability across laboratories, necessitating careful quality control (QC) and multiple sampling to assure reliability (Aviv et al., 2011).
The original qPCR method was implemented on the ABI Prism 7700 (Cawthon, 2002), and MMQPCR was established on the Bio-Rad MyiQ Single Color Real-Time PCR platform (Cawthon, 2009). The majority of studies report using Applied Biosystems real-time PCR platforms, such as the ABI 7000 or 7900. The Roche LightCycler® 480 real-time PCR (LC480) machine has 384-well capability and is in widespread use for many applications in research and diagnostic laboratories, although it appears to have only rarely been used for telomere length measurements (Gil and Coetzer, 2004). We experienced considerable technical challenges establishing a reliable qPCR method for T/S ratio measurement on the LC480 platform and report the critical assay design parameter values we discovered to establish a reliable qPCR method for telomere length measurement on this machine.
Materials and Methods
Samples
DNA was obtained from subjects who had consented to extensive genetic analyses, and all procedures were approved by the Southern Health and Disability Ethics Committee (Christchurch, New Zealand). The assay was applied to subjects from two longitudinal studies. The first cohort was the Christchurch Health and Development Study (CHDS) (n=677), which has followed a birth cohort to age 35 years (Fergusson and Horwood, 2001). The second was the Christchurch Health, Aging and Lifestyle Cohort (CHALICE) (n=351), based on a population sample of 50-year-olds (Schluter et al., 2013). Whole peripheral blood samples were drawn in EDTA tubes and frozen at −20°C until extracted. DNA was extracted from the CHDS samples using a modified sodium chloride precipitation procedure (Lahiri and Nurnberger, 1991), and from CHALICE samples using NucleoMag® Blood DNA extraction kits (Macherey-Nagel) on a KingFisher (Thermo Scientific) automated robotic platform according to the manufacturer's instructions. The quantity of the DNA was checked using the ratio of absorbance (A260/280) on a NanoDrop 2000 (Thermo Scientific). Three QC DNA samples used in the assay were chosen to provide T/S ratios of different length: a 50-year-old for the shorter length; a 7-year-old child for medium length; and mouse embryonic stem cell lines for the longer length (McHugh et al., 2008; Varela et al., 2011). Data were analyzed with linear models, correlation coefficient, and box plots in R 2.8.1 (Team, 2013).
Electrophoresis
Agarose gel electrophoresis was used to determine the quality of genomic DNA samples and to separate TRF using a 0.8% agarose/TAE solution (w/v). Products were visualized with SYBR® Safe DNA gel stain (LifeTechnologies), run adjacent to a GeneRuler™ 1 kb ladder (Fermentas Life Sciences) and electrophoresed at around 20 V/cm. PCR products were resolved using the automated MultiNA (Shimadzu) microchip electrophoresis system using the DNA-500 kit (Shimadzu).
TRF analysis
Southern blotting was performed using a TeloTTAGGG assay kit (Roche Applied Sciences), following the manufacturer's protocol. Digested genomic DNA was subjected to gel electrophoresis on an 11 cm 0.8% agarose gel at 5 V/cm. The resolved DNA fragments were transferred onto Hybond™-N+ membrane (Amersham Pharmacia Biotech), then hybridized with a telomere-specific digoxigenin (DIG)-labeled probe, and detected with chemiluminescence. TRF length analysis was performed using TELORUN (Ouellette et al., 2000).
LC480 qPCR telomere length assay method
The telomere length assay finally implemented was adapted from the published original qPCR protocol (Cawthon, 2002). This method provides relative quantification of average leukocyte telomere length by measuring the number of telomere repeats (T) in a genomic DNA sample relative to the amount of single copy reference gene (S), and expressed as a T/S ratio. qPCR for the telomeric DNA and single copy reference gene were performed, in duplicate, in separate qPCR reactions on the LC480, ensuring that the T and S reactions for each sample were located in the same relative position in a 384-well plate format.
Primers for the telomere PCR were telg (5′ACACTAAGGTTTGGGTTTGGGTTTGGGTTTGGGTTAGTGT3′) and telc (5′TGTTAGGTATCCCTATCCCTATCCCTATCCCTATCCCTAACA3′) (Cawthon, 2009) used at a final concentration of 900 nM. Primers for the single copy reference gene ALB (albumin) PCR were albu (5′CGGCGGCGGGCGGCGCGGGCTGGGCGGAAATGCTGCACAGAATCCTTG3′) and albd (5′GCCCGGCCCGCCGCGCCCGTCCCGCCGGAAAAGCATGGTCGCCTGTT3′) (Cawthon, 2009), used at a final concentration of 900 nM. The final reaction mix contained 0.2 mM each dNTP, 2 mM MgCl2, 1.25 U HOT FIREPol® DNA Polymerase (Solis BioDyne), HOT FIREPol Buffer B1, 1.5 μM SYTO®9 fluorescent dye (LifeTechnologies), and 20 ng genomic DNA in a total volume of 15 μL.
The thermal cycling profile for the telomere PCR consisted of the following steps: Stage 1, 95°C for 15 min; Stage 2, 2 cycles of 94°C for 15 s, 49°C for 15 s; Stage 3, 35 cycles of 94°C for 15 s, 62°C for 10 s, 74°C for 15 s with signal acquisition. Cycling conditions for ALB PCR were: Stage 1, 95°C for 15 min; Stage 2, 2 cycles of 94°C for 15 s, 49°C for 15 s; Stage 3, 40 cycles of 94°C for 15 s, 62°C for 10 s, 88°C for 15 s with signal acquisition. Melt curve analysis was performed at the end of each run to verify the specificity of PCR amplification products.
Standard curves were included in each run ranging from 1.56 to 100 ng and prepared by two fold serial dilutions of a reference genomic DNA sample. LightCycler 480 software 1.5.0 (Roche) was used to determine sample concentration of both T and S by using the second derivative method to convert the cycle threshold (Ct) to nanograms of DNA. The T/S ratio was calculated by dividing the telomere product by the ALB product and the average taken of the duplicate measures.
The modified assay was subjected to several QC criteria. To test reproducibility, four replicates of three QC genomic DNA samples of varying telomere length were included in every run. To control for position effects two replicates of each control were located on the left side of the 384-well plate (column 1+2) and two replicates on the right hand side (column 23+24). The efficiency of the assay was assessed by ensuring the standard curve for both the telomere and single copy reference gene fell within the range of 90-110% (Bustin et al., 2009) and that every point in the curve generated the same T/S ratio to certify that the assay accounted for the initial differences in sample concentration if any were present. Finally, the no-template control was always checked to ensure no product appeared until at least seven cycles beyond the lowest concentration on the standard curve. If any of these QC criteria failed, the assay run was repeated.
If the assay passed these QC measures, then the resulting data were subjected to additional checks. For the data from each sample to be acceptable it had to fall within the range of the standard curve, the amplicon melt curve had to display the appropriate temperature profile with no evidence for nonspecific amplification, and the coefficient of variation (CV) for the replicates for either product had to be below 10%. If the sample did not pass it was re-assayed a maximum of three times, at which point it was rejected and excluded from future analyses.
Results
We initially set out to establish the MMQPCR method published by Cawthon (2009), which involves the co-amplification of two products in the same PCR reaction, using a complex primer design and a single fluorescent dye. However, this complex reaction format proved problematic. When the telomeric amplification products were analyzed, a strong primer-dimer band occurred in our no-template control reactions and this band was indistinguishable from the expected genuine product required for telomere length measurement (Fig. 1). The primer-dimer may have arisen as the primers telg and telc used in the MMQPCR assay are very prone to primer dimer formation through the hybridization of a perfect 3 bp complement on the 3′ termini as shown in Cawthon (2009). To avert this issue, the method employs a hot-start polymerase, which is activated at a high temperature in the denaturation phase of the PCR cycling. Therefore, we evaluated 12 hot-start polymerases from several suppliers, including enzymes with different hot-start activation mechanisms such as antibody mediation or chemical modification (Kellogg et al., 1994). We observed that 6 of the 12 hot-start enzymes generated a strong primer dimer band with telg and telc, in the absence of genomic DNA (Fig. 1), and this was not restricted to hot-start enzymes of a particular category. Another three polymerases performed poorly in the assay, generating little or no telomere specific PCR product. Only three out of the 12 polymerases tested yielded the desired result with no primer dimer formation in the no-template control: HOT FIREPol® (Solis BioDyne); Roche GC Rich (Roche); and LightCycler 480 probes master (Roche).
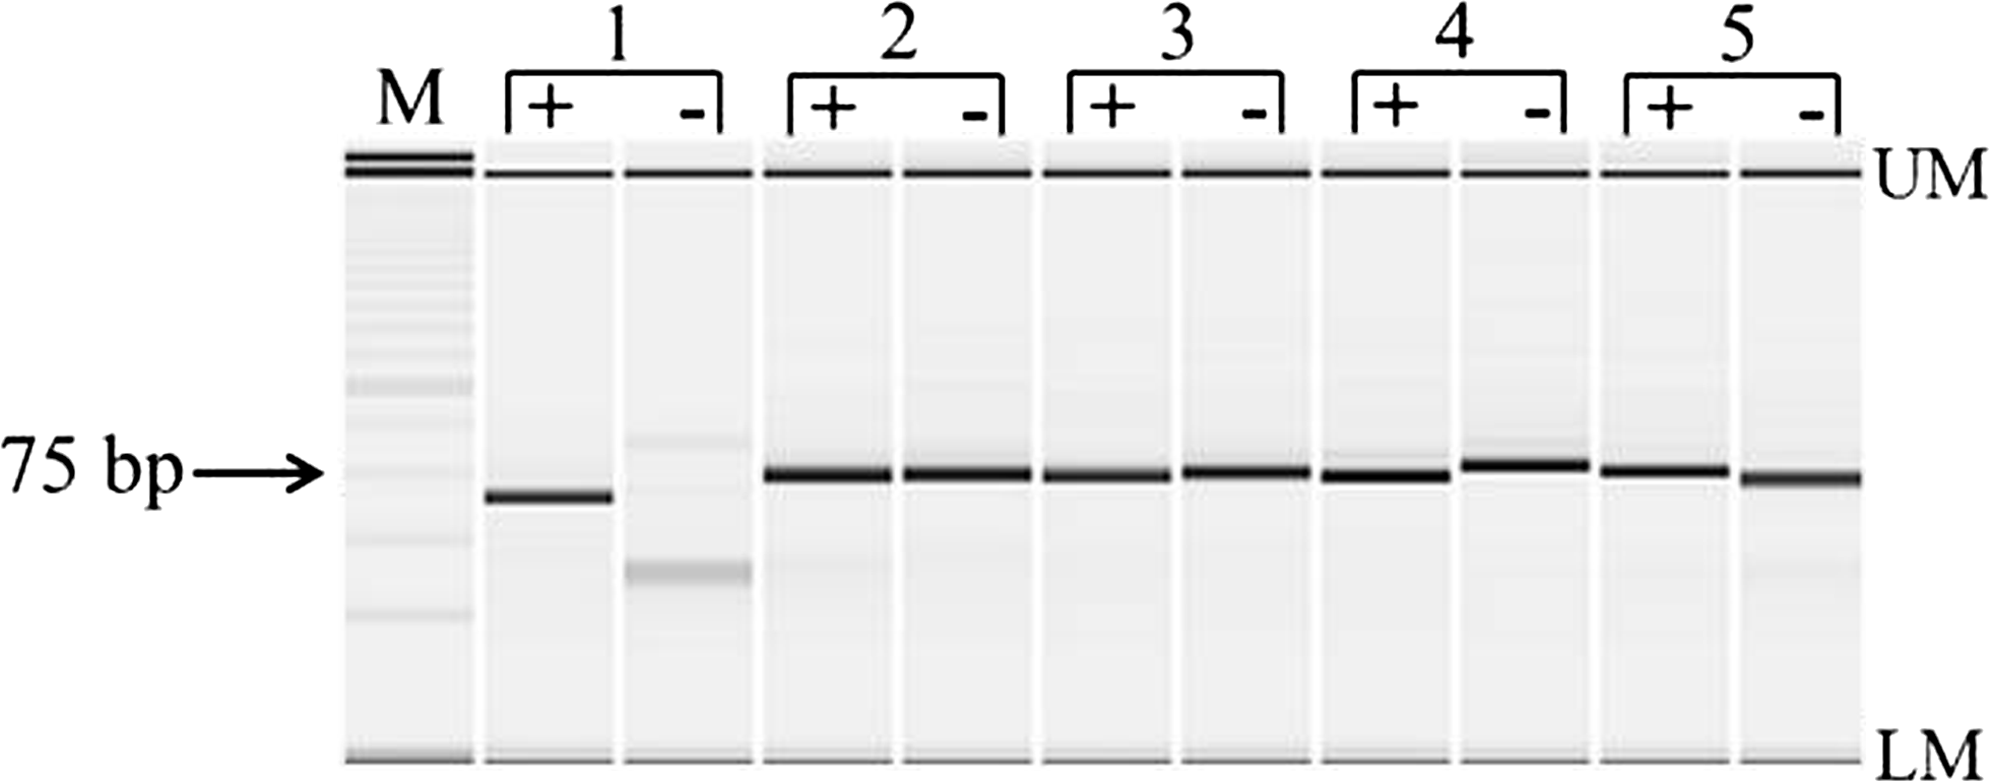
Efficacy analysis of hot-start polymerases. PCR products were resolved on the MultiNA microchip electrophoresis system and stained with SYBR® Gold Nucleic Acid Gel Stain to visualize the amplification of the 79 bp telomere product using five different hot-start polymerases. The apparent variation in telomere product size between samples is an artifact of the MultiNA system when resolving products of small size. Lane M contains the 25 bp size standard (DNA-500 Kit; Shimadzu), with the upper and lower internal standard markers represented by UM and LM. Each pair of lanes contains either genomic DNA (+) or water (−). The results for five different hot-start polymerases are illustrated: HOT FIREPol® (1), TAQ-Ti (2), TaKaRa Ex Taq HS (3), Hotmaster taq (4), and Paq 5000 (5). The only polymerase that did not generate a primer dimer in the no template (water) control was HOT FIREPol® (1); the other four presumably had residual polymerase activity before heat denaturation, leading to formation of the evident primer dimer (expected size 79 bp). PCR, polymerase chain reaction.
SYBR green (Molecular probes), the fluorescent dye used in the original assay protocol (Cawthon, 2002) gave a noisy background, making determination of accurate Ct values and quantification difficult. We therefore switched to the intercalating dye SYTO®9 (LifeTechnologies), which gave an enhanced and stable fluorescent signal. Additionally, SYTO®9 is a saturating dye that enabled accurate melt curve analysis of the two amplicons (T and S), which SYBR green did not, allowing for the monitoring of potential interference due to non-specific amplification.
Furthermore, the analysis software on the qPCR platform available to us (LightCycler 480; Roche) was unable to process the two amplicons in this complex format and could only provide Ct values for the telomere amplicon. These data were therefore exported and manually separated into two independent Excel spreadsheets, before conversion with the LC480 software into a format that could then be used for analysis by the program LinRegPCR (Ramakers et al., 2003).
Even after addressing these issues we experienced difficulty establishing a reliable MMQPCR assay, predominantly due to a considerable amount of assay variation. To determine the source of variation, we tested a series of potential confounders on the LC480 platform by running assays with the same genomic DNA sample in every well of the 384-well plates. We applied these assays to test for evaporation due to plate seal leakage, pipetting errors, differential effects due to time of assay setup (including degradation of reaction components such as the fluorophore), plate position effects, differences in plastic-ware, and behavior of the thermal cycler. The most striking finding from this series of experiments was that severe position effects were consistently observed (Fig. 2A).
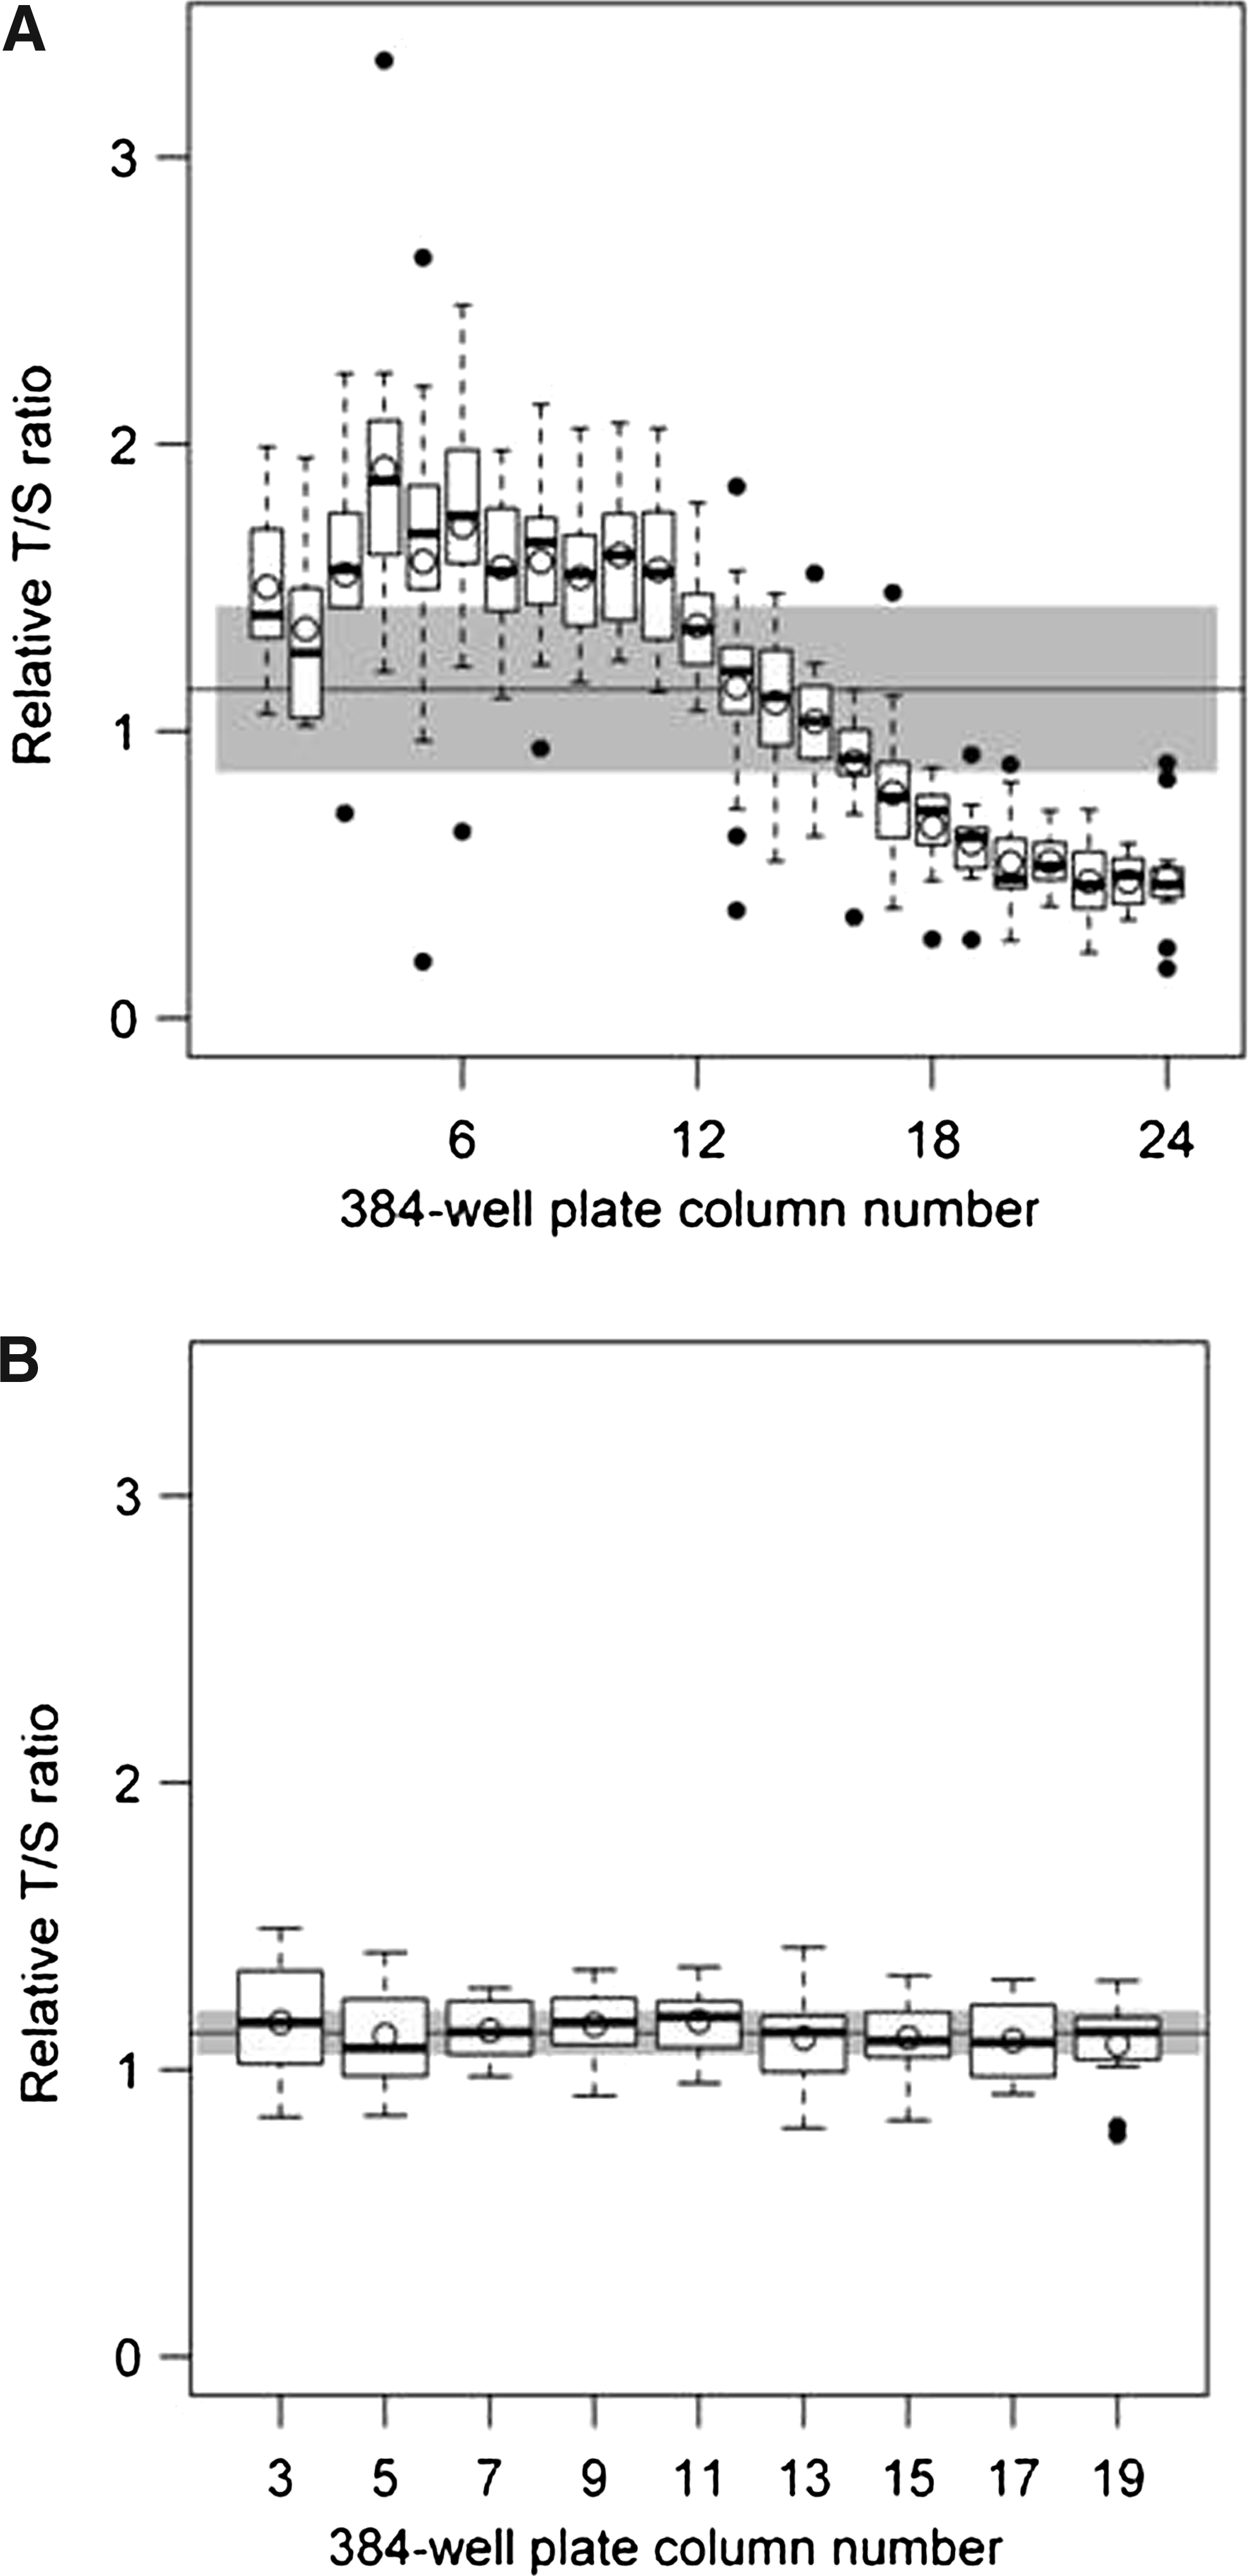
LC480 plate effects. To observe the significance of the position effects, a single DNA sample was run across an entire 384-well plate for both the MMQPCR method
To confirm these effects and determine the source, the performance of the machine's Peltier block was tested by loading a single PCR product across one row of a 384-well plate, then examining the melting point (Tm) of the product by high-resolution melt curve analysis (Von Keyserling et al., 2011). The PCR product has a distinct Tm due to its base composition, and if the apparent Tm measured by melting curve varies then this indicates inconsistent temperatures across the Peltier block. During this experiment we observed a Tm shift of 0.6°C degrees across the 24 columns of the PCR plate (data not shown). Temperature heterogeneity has been observed in several qPCR platforms, particularly at the edges and corners of plate-based instruments (Wilhelm et al., 2000; Herrmann et al., 2007).
Therefore, we abandoned the MMQPCR method on the LC480 platform and implemented the original Cawthon (2002) method. During development of this method we found the original qPCR primers tel 1, tel 2, 36B4u, and 36B4d (Cawthon, 2002) gave inconsistent amplification and poor reproducibility, as did primer pairs ASPG3F, ASPG4R, tel1b, and tel2b (Côté et al., 2012). This led us to test the MMQPCR primers telg, telc, albu, and albd (Cawthon, 2009), which we found to work well. Further minor modifications were made to the original Cawthon (2002) qPCR assay such as omitting DTT and DMSO as neither improved the amplification efficiency in our hands (data not shown), and a change in the thermal cycling profiles for each amplicon (as described in Materials and Methods).
Southern blotting was used to validate the results obtained from the modified qPCR assay. Twenty control samples of varying telomere length were assayed using both the T/S and the TRF method (Fig. 3). This gave a good overall correlation (r2=0.71 or r=0.853; Fig. 4) equivalent to the correlation of r=0.847 reported by Aviv et al. (2011).
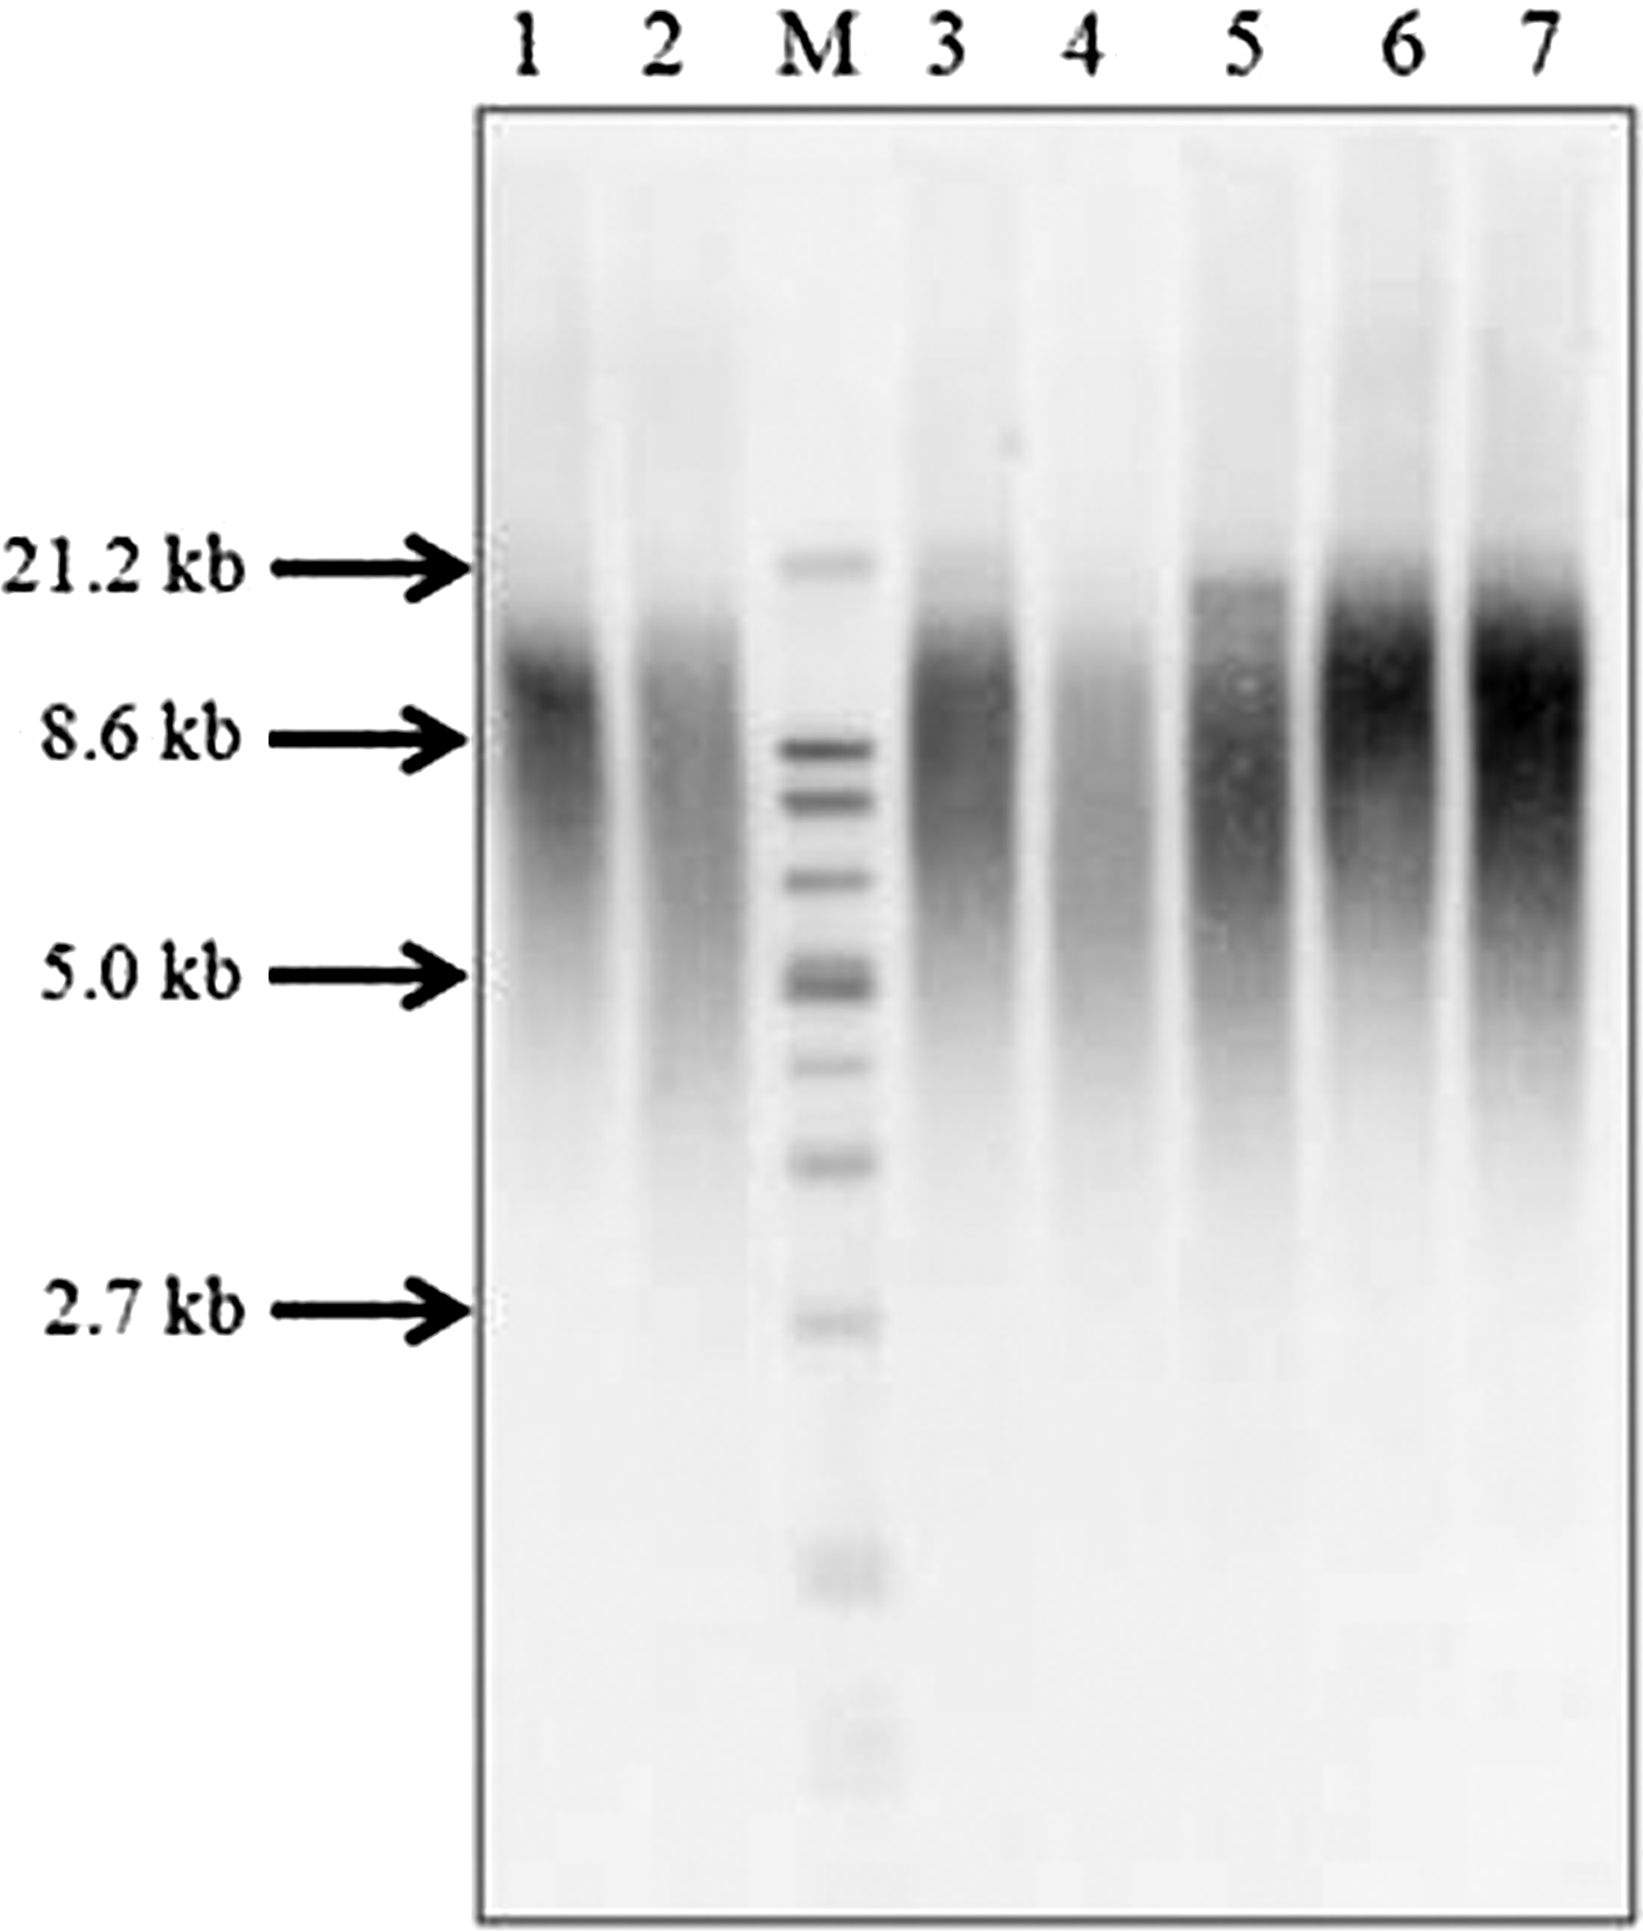
Example of Southern blot used for TRF assay. TRF was used to validate the results obtained from the qPCR assay. Lanes 1-7 contain different (CHALICE) DNA samples digested with HinfI and RsaI, to give telomere-specific smears of different length and intensities. Lane 5 contains the reference DNA sample used for normalization. Lane M contains the size standard ranging from 21.2 to 1.9 kb. CHALICE, Christchurch Health, Aging and Lifestyle Cohort; TRF, telomeric restriction fragment.
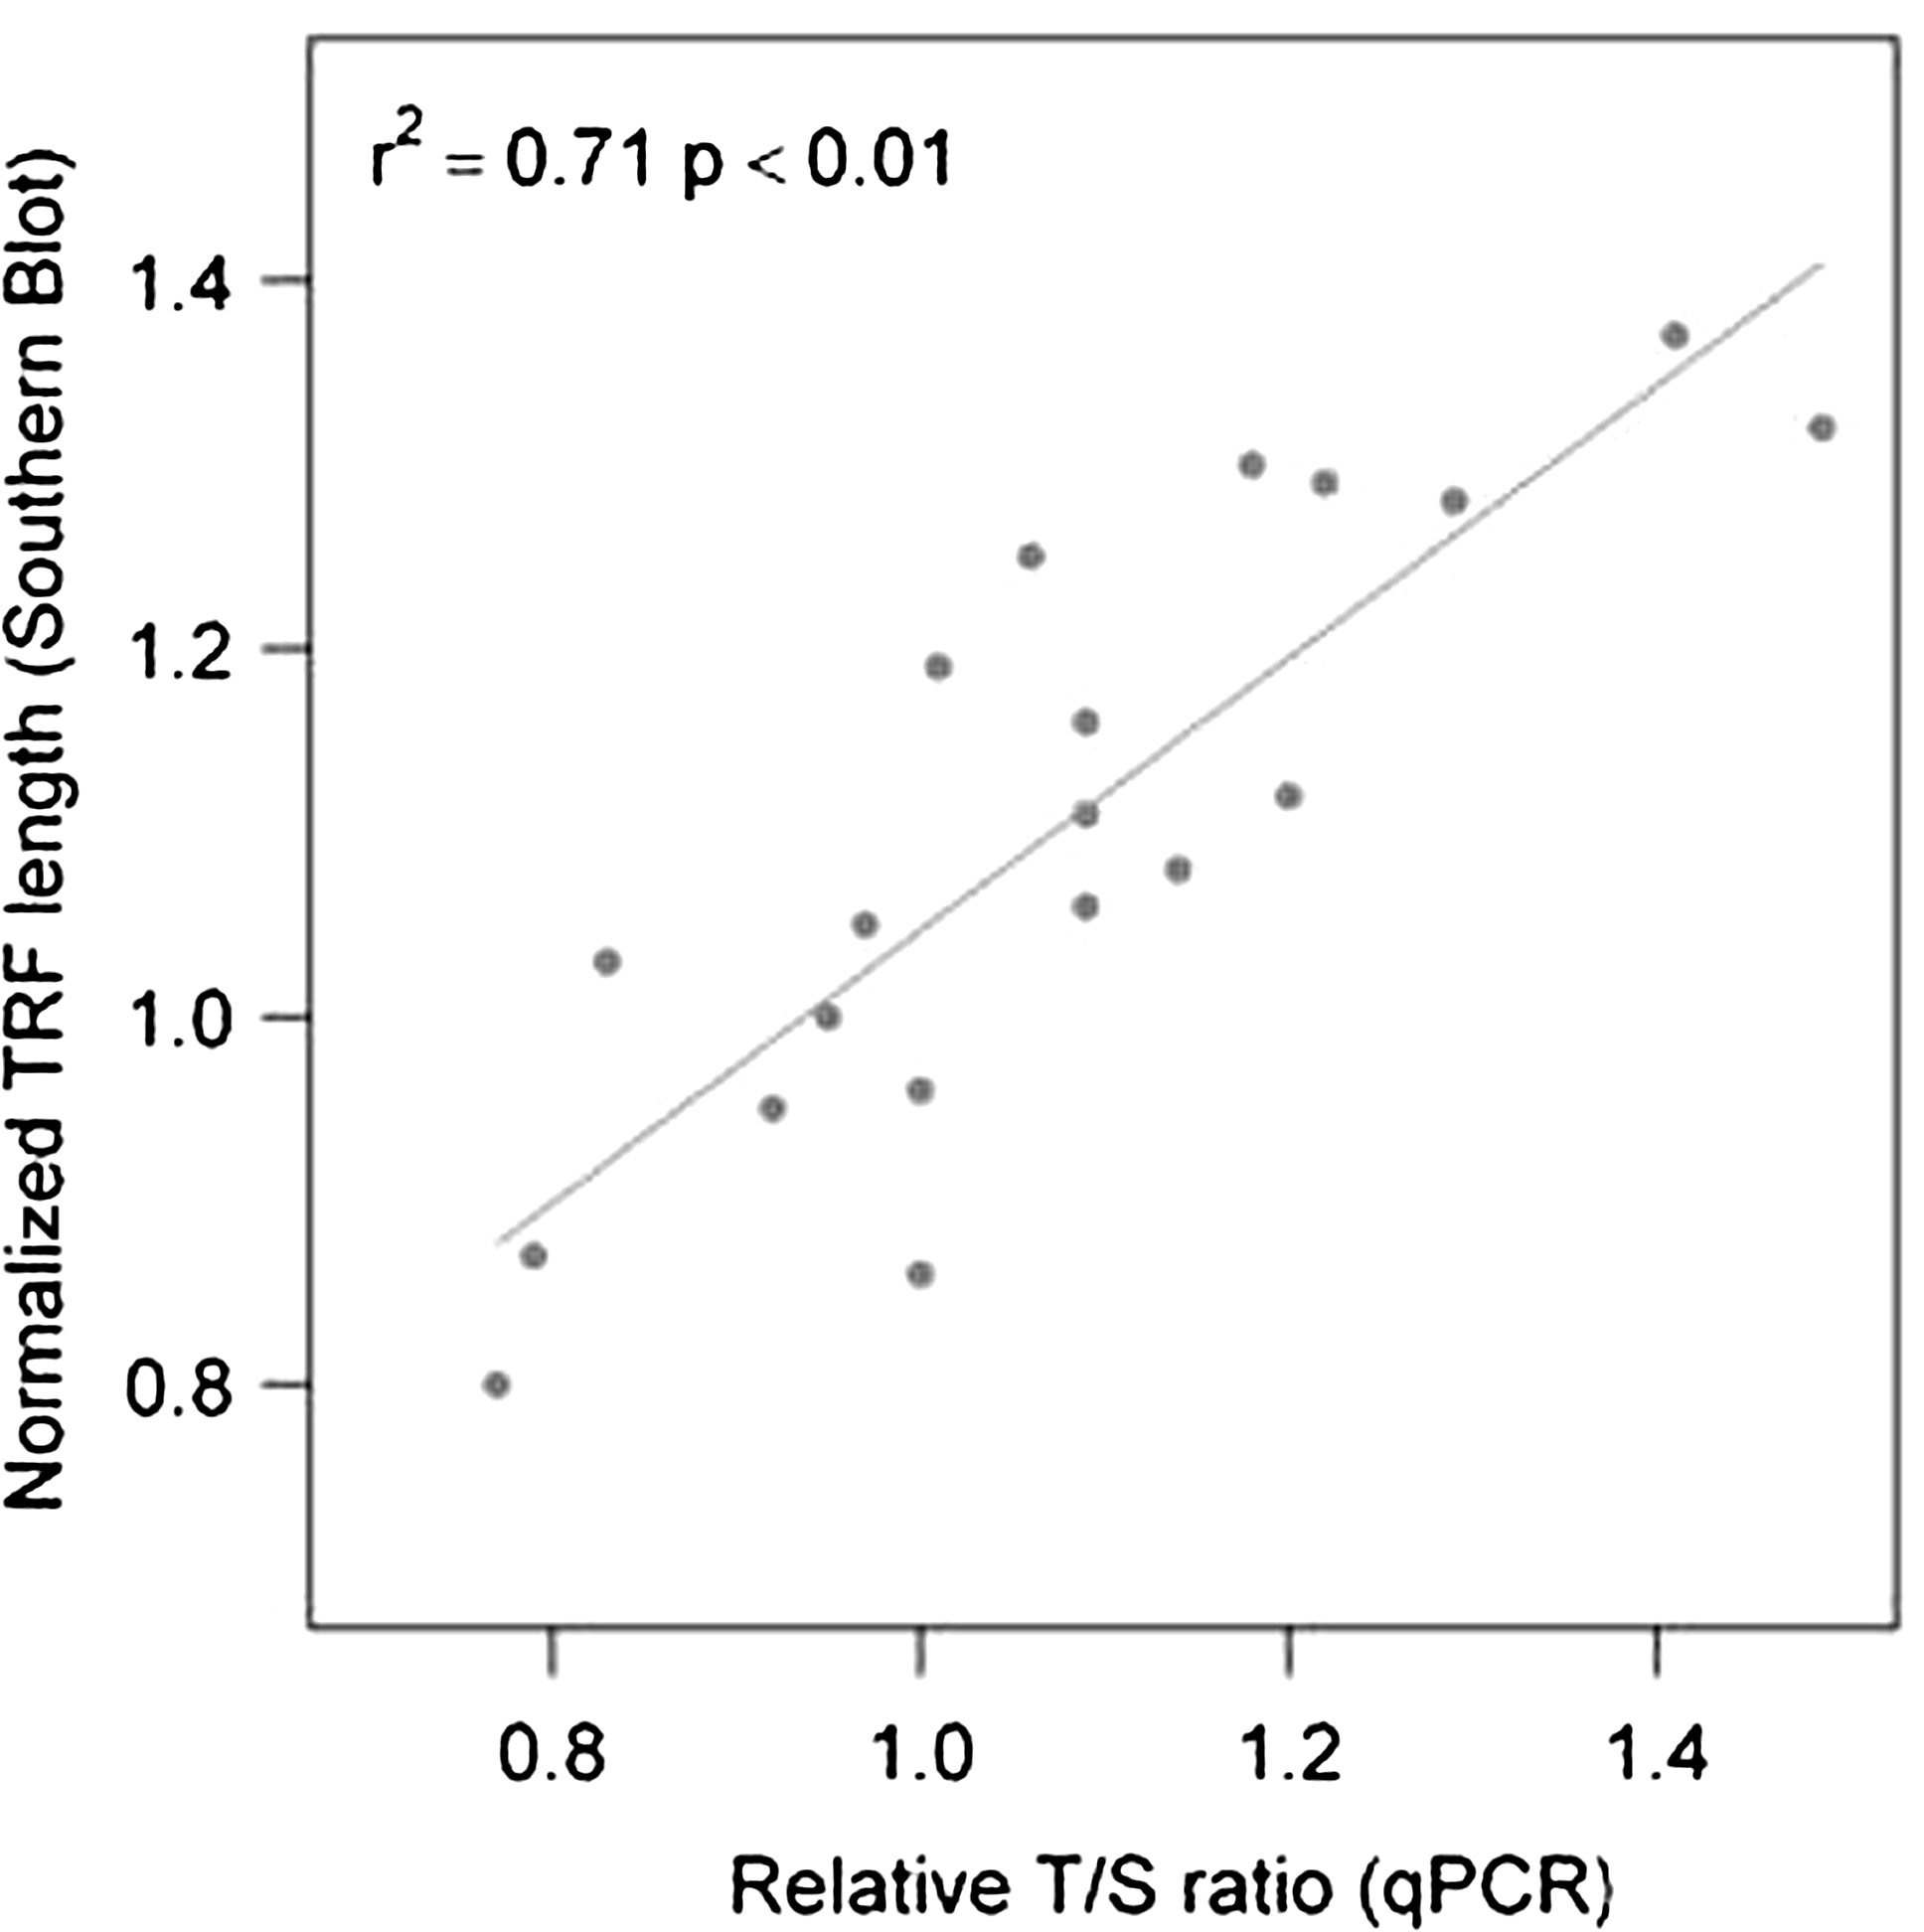
Correlation of qPCR versus TRF. Normalized mean TRF length was determined by Southern blot for 20 genomic DNA samples, and compared with relative T/S ratio data generated by the modified qPCR assay. All samples were normalized to a reference sample that had a mean TRF of 7.7 kb. Each T/S value is the average of duplicate measurements and each mean TRF length was done using one measurement. The R2=0.71 was determined using R.
The modified assay was used to examine telomere length in 1028 subjects. The average telomere length measurement for the CHDS cohort (n=677) was 1.184±0.371, and for the CHALICE cohort (n=351) 1.104±0.153. Assay performance was evaluated by calculating variation of all samples within a plate (intra-plate variation), and the variation of the three QCs between plates (inter-plate variation). This was done separately for the T and S plates. For CHDS the intra-plate variation was 12% for T and 10% for S, and the inter-plate variation was 9% for T and 11% for S. For CHALICE the intra-plate variation was 3% for T and 7% for S, and the inter-plate variation was 6% for T, and 5% for S. The CVs for CHALICE were significantly lower than for CHDS. This is most likely attributable to higher DNA quality of the CHALICE samples as these were much more recently extracted than CHDS.
Discussion
In this article we have explored a number of issues relating to the qPCR measurement of leukocyte telomere length, and adapted the method for use on the Roche LightCycler® 480 platform. During development of the MMQPCR assay we found that the choice of hot-start polymerase was critical to success (Fig. 1). The appearance of a primer-dimer in the no-template control reaction occurred with the same kinetics as product formation in reactions containing genomic DNA, indicating that the primer-dimer was most likely forming in the presence of genomic DNA, and limiting the production of genuine telomeric PCR product (data not shown). The multiplexed quantitative nature of the MMQPCR assay for the analysis of telomere repeats required the use of the primer pair telg-telc. Design constraints meant it is not possible to avoid the 3 bp 3′ overlap but this should be too unstable to form a product at high temperature. Formation of the primer-dimer most likely resulted from residual activity of the hot-start polymerase before heat denaturation. These data led us to conclude that many commercially available hot-start polymerases have residual activity at temperatures well below the advertised denaturation temperature, and that the telg-telc primers, with their propensity for forming primer dimers due to their 3′ three base pair overlap, are very sensitive to this residual activity.
We experienced difficulty establishing a reliable MMQPCR assay on this platform for two reasons. The first was due to complexities in extraction and analysis of data, which could not be carried out using the Roche LC480 machine software because of the multiplexed nature of the data. This required exporting of datasheets to external software and a considerable amount of manual manipulation. The second issue was the significant plate position effects, which had a marked impact on assay variability (Fig. 2A). The inconsistent temperatures found across the Peltier block of the LC480 presumably impacted on the accuracy of the T/S ratio determination by affecting DNA denaturation and primer annealing. As MMQPCR employs a very complex temperature cycling profile, the reaction mix contains multiple primers, and the single dye-dual product design is technically demanding, it is reasonable to expect that MMQPCR will be more sensitive to such plate position effects than traditional single amplicon PCR formats (Fig. 2B).
Although an early report described adaptation of the telomere length assay (Cawthon, 2002) for the LC480 platform (Gil and Coetzer, 2004), we found the primers described in this modified assay had low efficiency and led to poor amplification, and we could not reliably generate telomere length data with this method.
Our final assay protocol incorporates multiple QCs for machine variation and other potential sources of artifact or variation, but generates reliable measurements as judged by correlation with data derived by the TRF Southern blot-based method. We also established that the MMQPCR approach was incompatible with the LC480 platform, and found that reliable data could only be obtained by implementing a modified two-plate form of the original qPCR method for telomere length measurement (Cawthon, 2002). We believe this assay protocol provides a well-controlled, reproducible method for telomere length measurement on the LC480 platform.
Footnotes
Acknowledgments
We thank Dr. Michael Kirwan (Queen Mary University of London, Blizard Institute of Cell and Molecular Science, London) for assistance with the MMQPCR data analysis.
Author Disclosure Statement
No competing financial interests exist.