




Abstract
Background: The matrix metalloproteinases (MMPs) are a family of highly conserved, metal-dependent proteolytic enzymes that play an important role in tumor invasion and metastasis. Many studies have been carried out on the association between polymorphisms in the MMP1, MMP2, MMP3, MMP7, and MMP9 genes and urinary cancer risk. However, the data from these published studies are conflicting and have low statistical power. Methods: In this study, we performed a meta-analysis of 12 different publications from the PubMed and WanFang databases, published up to May 2015, to better assess the purported associations. Odds ratios (OR) and 95% confidence intervals (CI) were determined to reveal association strengths. Results: Some significant associations were found. For the MMP1 -1607 1G/2G polymorphism, a negative association was identified for the 2G allele in bladder cancer (2G2G+2G1G vs. 1G1G: OR = 0.57, 95% CI = 0.36-0.93, pheterogeneity = 0.001) and renal cell carcinoma (2G1G vs. 1G1G: OR = 0.57, 95% CI = 0.39-0.82, pheterogeneity = 0.567). For the MMP2 -1306 C/T polymorphism, there was a negative association with the T allele for bladder cancer in the Asian population (TT+TC vs. CC: OR = 0.41, 95% CI = 0.18-0.94, pheterogeneity = 0.195). For the MMP7 -181 A/G polymorphism, a decreased bladder cancer risk was found (G-allele vs. A-allele: OR = 0.81, 95% CI = 0.66-0.98, pheterogeneity =0.325). Conclusion: In summary, our study showed evidence that genetic polymorphisms in MMP1 for all populations, but only in the Asian population for MMP2 and MMP7, may protect against bladder cancer risk. Future studies with larger sample sizes are warranted to further evaluate these associations in more detail.
Introduction
M
MMP1, MMP2, MMP3, MMP7, and MMP9 are five important members of the MMP family. The MMP1 gene is localized on 11q22 and is critical in modeling and remodeling the ECM (Brinckerhoff et al., 2000). MMP2, which is located on chromosome 16q13, is also known as the 72 kDa gelatinase A. It primarily hydrolyzes type IV collagen, the major structural component of the basement membrane (Stamenkovic, 2000). MMP3, which is also called stromelysin-1, is located on chromosome 11q, is known to lyse basal membrane collagen and to induce the synthesis of other MMPs, such as MMP1 and MMP9 (Mannello et al., 2005). MMP7 (also known as matrilysin), which is located on chromosome 11q21-22, degrades elastin, proteoglycans, fibronectin, and type IV collagen (Wilson et al., 1996). MMP9, which is located on chromosome 20q11.2-q13.1 and is also known as the 92 kDa gelatinase B, processes a proteolytic activity against type IV collagen and has been shown to facilitate vascular smooth muscle cell migration (Gum et al., 1996).
A single-nucleotide polymorphism (SNP) is found at -1607 bp in the MMP1 promoter, where a guanine (G) insertion creates an Ets binding site, 5′-GGA-3′, flanking an activated protein-1 site. The 2G allele of the polymorphism has been reported to be related to an increased risk of several types of cancer and their progression or patient survival (Rutter et al., 1998). A C to T transition at position -1306 (rs243865) in the MMP2 promoter abolishes an Sp-1 binding site and consequently decreases its activity (Price et al., 2001; Yu et al., 2004). In addition, a recent study demonstrated that the promoter activity of the -1306C/-735C haplotype was stronger than that of the -1306T/-735T haplotype, suggesting a synergistic effect of these two polymorphisms (Yu et al., 2004).
In a transient transfection study, the promoter activity of the MMP7 -181 (rs11568818) G allele is two- to threefold higher than that of the A allele, which may induce elevation of MMP7 mRNA transcription and subsequently increase its protein levels (Jormsjö et al., 2001). For the MMP9 gene, the -1562 (rs3918242) C to T substitution has also been shown to upregulate the promoter activity. Thus, the presence of the -1562T allele is associated with the decreased capacity of a putative transcription repressor protein, binding to the promoter region, with a subsequent increase in gene expression (Zhang et al., 1999). Other four nonsynonymous coding SNPs were also selected in our analysis: MMP3 (45E/K) G/A, MMP9 (279R/Q) A/G, MMP9 (574R/P) T/C, and MMP9 (668Q/R) A/G. There is currently insufficient information about the gene expression and function of these polymorphisms.
Numerous studies on the association of these eight polymorphisms with urinary cancer susceptibility have been carried out, however, the results remain inconclusive. A quantitative synthesis to accumulate data from different studies is needed to provide better evidence on these associations. Here, in this report, we performed a meta-analysis of 12 publications to estimate the effect of eight polymorphisms: MMP1 -1607 1G/2G (Hirata et al., 2004; Kader et al., 2006; Albayrak et al., 2007; Piccoli et al., 2007; Tasci et al., 2008; Tsuchiya et al., 2009; Srivastava et al., 2010a; Wieczorek et al., 2013), MMP2 -1306 C/T (Zhong et al., 2005; Kader et al., 2006; Srivastava et al., 2013a; Wieczorek et al., 2013), MMP3 (45E/K) G/A (Kader et al., 2006; Srivastava et al., 2010b), MMP7 -181 A/G (Srivastava et al., 2010a; Wieczorek et al., 2014), MMP9 -1562 C/T (Zhong et al., 2005; Kader et al., 2006; Wieczorek et al., 2013), MMP9 (279R/Q) A/G (Kader et al., 2006; Tasci et al., 2008; Srivastava et al., 2010b), and MMP9 (574R/P) T/C (Kader et al., 2006; Srivastava et al., 2010b), MMP9 (668Q/R) A/G (Kader et al., 2006; Srivastava et al., 2010b) on urinary cancer risk.
Materials and Methods
Literature search and data extraction
We conducted searches on the PubMed database (www.ncbi.nlm.nih.gov/) and the WanFang database (www-wanfangdata-com-cn.web.bisu.edu.cn/), the last search was updated in May 2015, with the keywords “MMP”or “matrix metalloproteinase,” “polymorphism” or “variant,” and “cancer” or “tumor,” and without any restriction on language or publication year. We also screened the references of the retrieved and review articles by a hand search. Eligible studies had to meet the following criteria: (1) the study assessed the correlation between urinary cancer (bladder cancer, prostate cancer, and renal cell carcinoma) and at least one of the polymorphisms cited above [MMP1 -1607 1G/2G, MMP2 -1306 C/T, MMP3 (45E/K) G/A, MMP7 -181 A/G, MMP9 -1562 C/T, MMP9 (279R/Q) A/G, MMP9 (574R/P) T/C, MMP9 (668Q/R) A/G]; (2) case-control studies; (3) control subjects matched with case patients for age and gender; and (4) only full-text articles were included. The major exclusion criteria were: (1) no control population; (2) no available genotype frequency; (3) duplication of the previous publications; and (4) articles with a clear bias of accrual.
Two of the authors reviewed the results of each of the database searches to make sure that published articles were not missed. Data were collected on the first author's last name, the year of publication, the country of origin, ethnicity, the cancer type, the total number of subjects included (both cases and controls), the source of controls, the age range between the case and control groups, the genotype methods, and the Hardy-Weinberg equilibrium (HWE) of the control group.
Statistic analysis
Odds ratios (OR) with 95% confidence intervals (CI) were used to measure the strength of the association between MMP polymorphisms and cancer risk, based on the genotype frequencies in the cases and controls. Subgroup analysis, stratified by cancer type, was performed first. If one cancer type contained only one individual study, it was combined into the other cancers' subgroup. Ethnicity was categorized as European, Asian, African, and Mixed. Source of control subgroup analysis was performed on two classifications: population based and hospital based.
The fixed-effects model and the random-effects model were used to calculate the pooled OR. The statistical significance of the summary OR was determined with the Z-test. The heterogeneity assumption was evaluated with a chi-square-based Q-test among the studies. A p-value of more than 0.10 for the Q-test indicated a lack of heterogeneity among the studies. In cases where significant heterogeneity was detected, the random-effects model (DerSimonian and Laird method) was used (DerSimonian et al., 1986) or else the fixed-effects model (Mantel-Haenszel method) was chosen (Mantel et al., 1959).
We investigated the association between genetic variants and urinary cancer risk in dominant genetic model (MM+MW vs. WW), heterozygote comparison (MW vs. WW) and allelic contrast (M-allele vs. W-allele). M-allele means mutational allele, and W-allele means the wild allele. The funnel plot asymmetry was assessed with the Egger's test. Publication bias was assessed by both Egger's test and Begg's test (Hayashino et al., 2005). All statistical tests for this meta-analysis were performed with Stata software (version 11.0; StataCorp LP, College Station, TX).
Results
Eligible studies
Of the 291 abstracts retrieved through the search criteria from PubMed database, 26 were irrelevant, leaving 265 for consideration and reading of the abstract or full article. Of the 265 abstracts, 32 were meta-analyses, 16 were systematic review articles, 203 were about other gene polymorphisms or other kinds of cancer, and, finally, 14 were left for collecting related information. After deep investigation and selection, another three articles were excluded because each article just included one MMP gene polymorphism for just one type urinary cancer, which could not be combined for meta-analysis (Awakura et al., 2006; Srivastava et al., 2013b; Yaykaşli et al., 2014). We also found only one Chinese article in the WanFang database. As a result, 12 case-control articles were included in our meta-analysis: (Hirata et al., 2004; Zhong et al., 2005; Kader et al., 2006; Albayrak et al., 2007; Piccoli et al., 2007; Tasci et al., 2008; Tsuchiya et al., 2009; Srivastava et al., 2010a, 2010b; Wieczorek et al., 2013, 2014; Srivastava et al., 2013a) (Fig. 1). The characteristics of the 12 eligible studies are presented in Table 1.

Flowchart illustrating the search strategy for matrix metalloproteinases (MMPs) polymorphism and the risk of urinary cancer.
PB, population based; HB, hospital based; PCR-RFLP, polymerase chain reaction-restriction fragment length polymorphism; NA, not available; BCA, bladder cancer; PCA, prostate cancer; RCC, renal cell carcinoma; MMP, matrix metalloproteinase; SNP, single-nucleotide polymorphism.
In our article, eight SNPs were analyzed. There were eight articles, including 1689 cancer cases and 1690 controls, for the MMP1 -1607 1G/2G SNP (four about bladder cancer, two about prostate cancer, and two about renal cell carcinoma); four articles, including 1020 cancer cases and 960 controls, for the MMP2 -1306 C/T SNP; three articles, including 838 cancer cases and 735 controls, for the MMP9 -1562 C/T SNP; two articles, including 440 cancer cases and 399 controls, for the MMP7 -181 A/G SNP; three articles, including 907 cancer cases and 942 controls, for the MMP9 (279R/Q) A/G SNP; two articles, including 726 cancer cases and 737 controls, for the MMP3 (45E/K) G/A SNP; two articles, including 756 cancer cases and 760 controls, for the MMP9 (574R/P) T/C SNP; and two articles, including 745 cancer cases and 745 controls, for the MMP9 (668Q/R) A/G SNP. The distribution of genotypes among the control samples was consistent with HWE in all studies except four: Kader et al. (2006), Albayrak et al. (2007), Srivastava et al. (2010b), and Wieczorek et al. (2013). Polymerase chain reaction-restriction fragment length polymorphism (PCR-RFLP), DNA sequencing, and TaqMan® Real-Time PCR were used as genotyping methods in all publications.
Quantitative synthesis
For the MMP1 -1607 1G/2G SNP, overall, a decreased association with urinary cancer risk was observed under heterozygote comparison (2G1G vs. 1G1G) (OR = 0.70, 95% CI = 0.53-0.92, pheterogeneity = 0.010) and the dominant genetic model (2G2G+2G1G vs. 1G1G) (OR = 0.69, 95% CI = 0.51-0.94, pheterogeneity = 0.000) (Table 2). In the cancer type subgroup, this pattern of positive association was maintained in bladder cancer (heterozygote comparison: OR = 0.61, 95% CI = 0.42-0.89, pheterogeneity = 0.036, Fig. 2; dominant genetic model: OR = 0.57, 95% CI = 0.36-0.93, pheterogeneity = 0.001) and renal cell carcinoma (heterozygote comparison: OR = 0.57, 95% CI = 0.39-0.82, pheterogeneity =0.567, Fig. 2; dominant genetic model: OR = 0.59, 95% CI = 0.42-0.83, pheterogeneity = 0.465; allelic contrast (2G vs. 1G): OR = 0.75, 95% CI = 0.59-0.96, pheterogeneity = 0.231). However, there was no association between this SNP and prostate cancer. Moreover, no association was found in the ethnic subgroup analysis for this SNP.
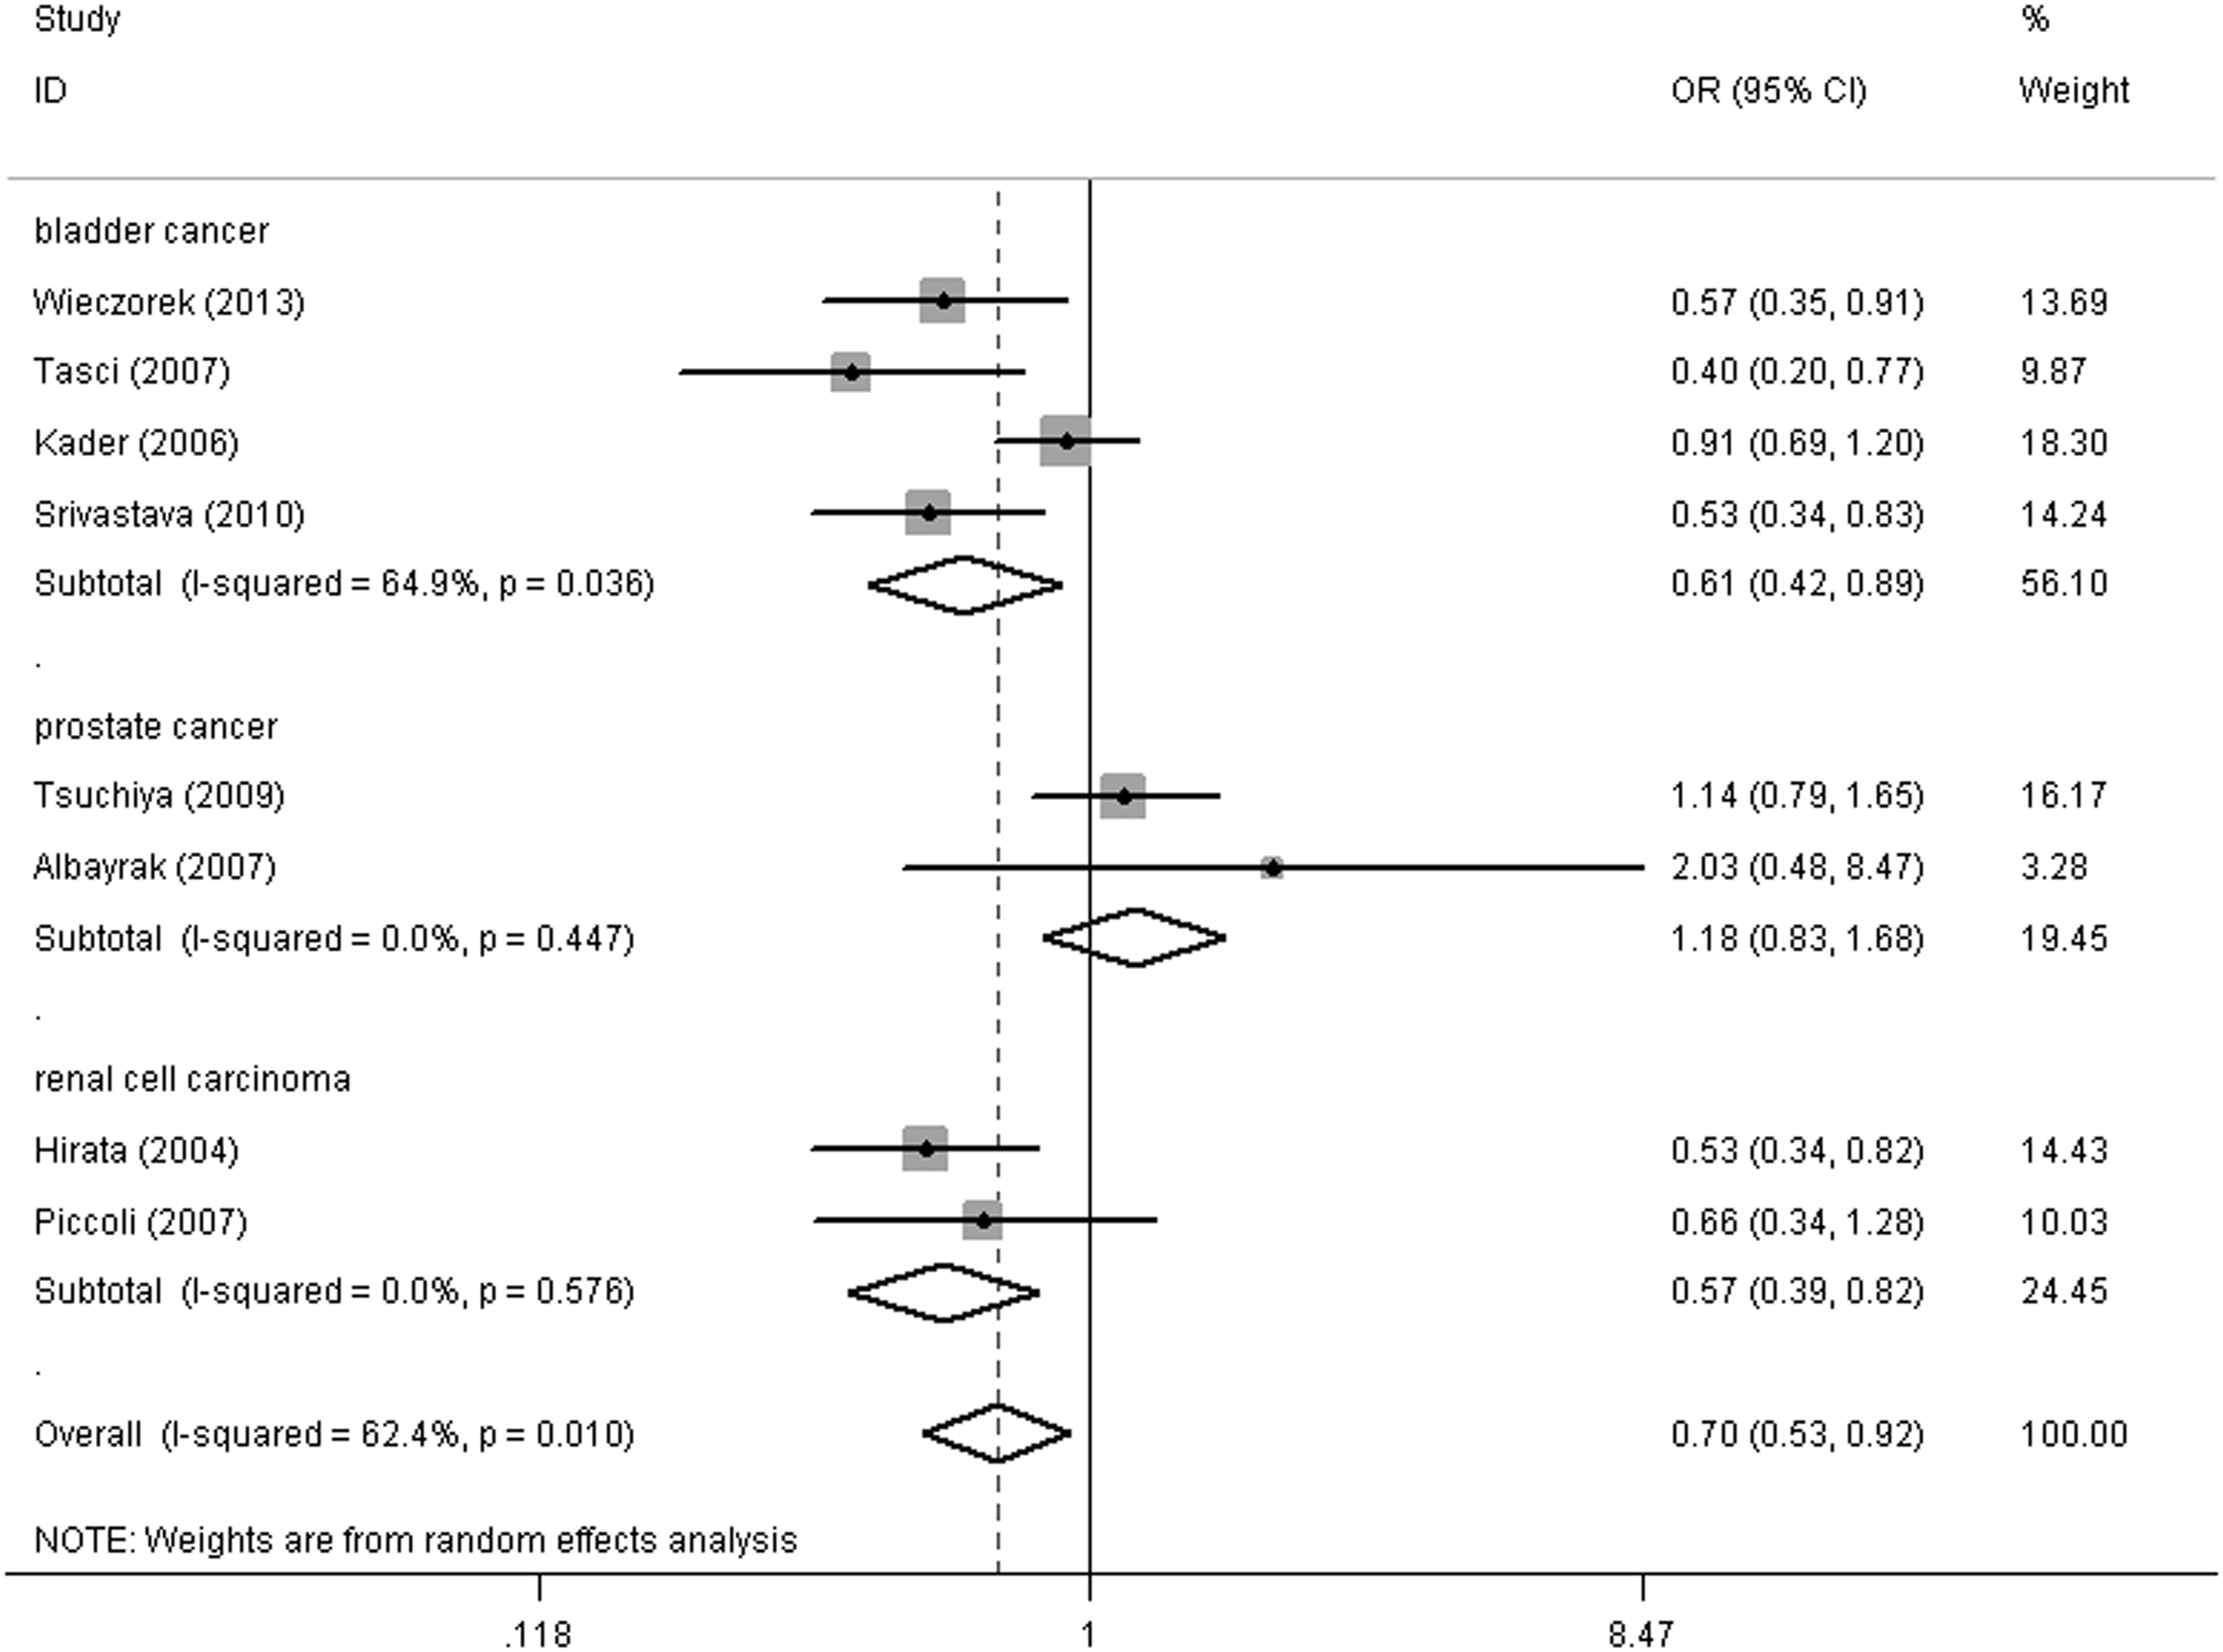
Forest plot of urinary cancer risk associated with the MMP1 -1607 1G/2G polymorphism (heterozygote comparison) in the cancer type subgroup. The squares and horizontal lines correspond to the study-specific odds ratio (OR) and 95% confidence interval (CI). The area of the squares reflects the weight (inverse of the variance). The diamond represents the summary OR and 95% CI.
Number of comparisons.
p-value of Q-test for heterogeneity test.
CI, confidence interval; OR, odds ratio.
Regarding the MMP2 -1306 C/T SNP, the results of the meta-analysis are presented in detail in Table 2. No statistically significant association was detected for bladder cancer risk. Interestingly, in the ethnicity subgroup analysis, it was found that there was a decreased risk of bladder cancer for this polymorphism in the Asian population (dominant genetic model [TT+TC vs. CC]: OR = 0.41, 95% CI = 0.18-0.94, pheterogeneity = 0.195, Fig. 3), but not in Caucasians.
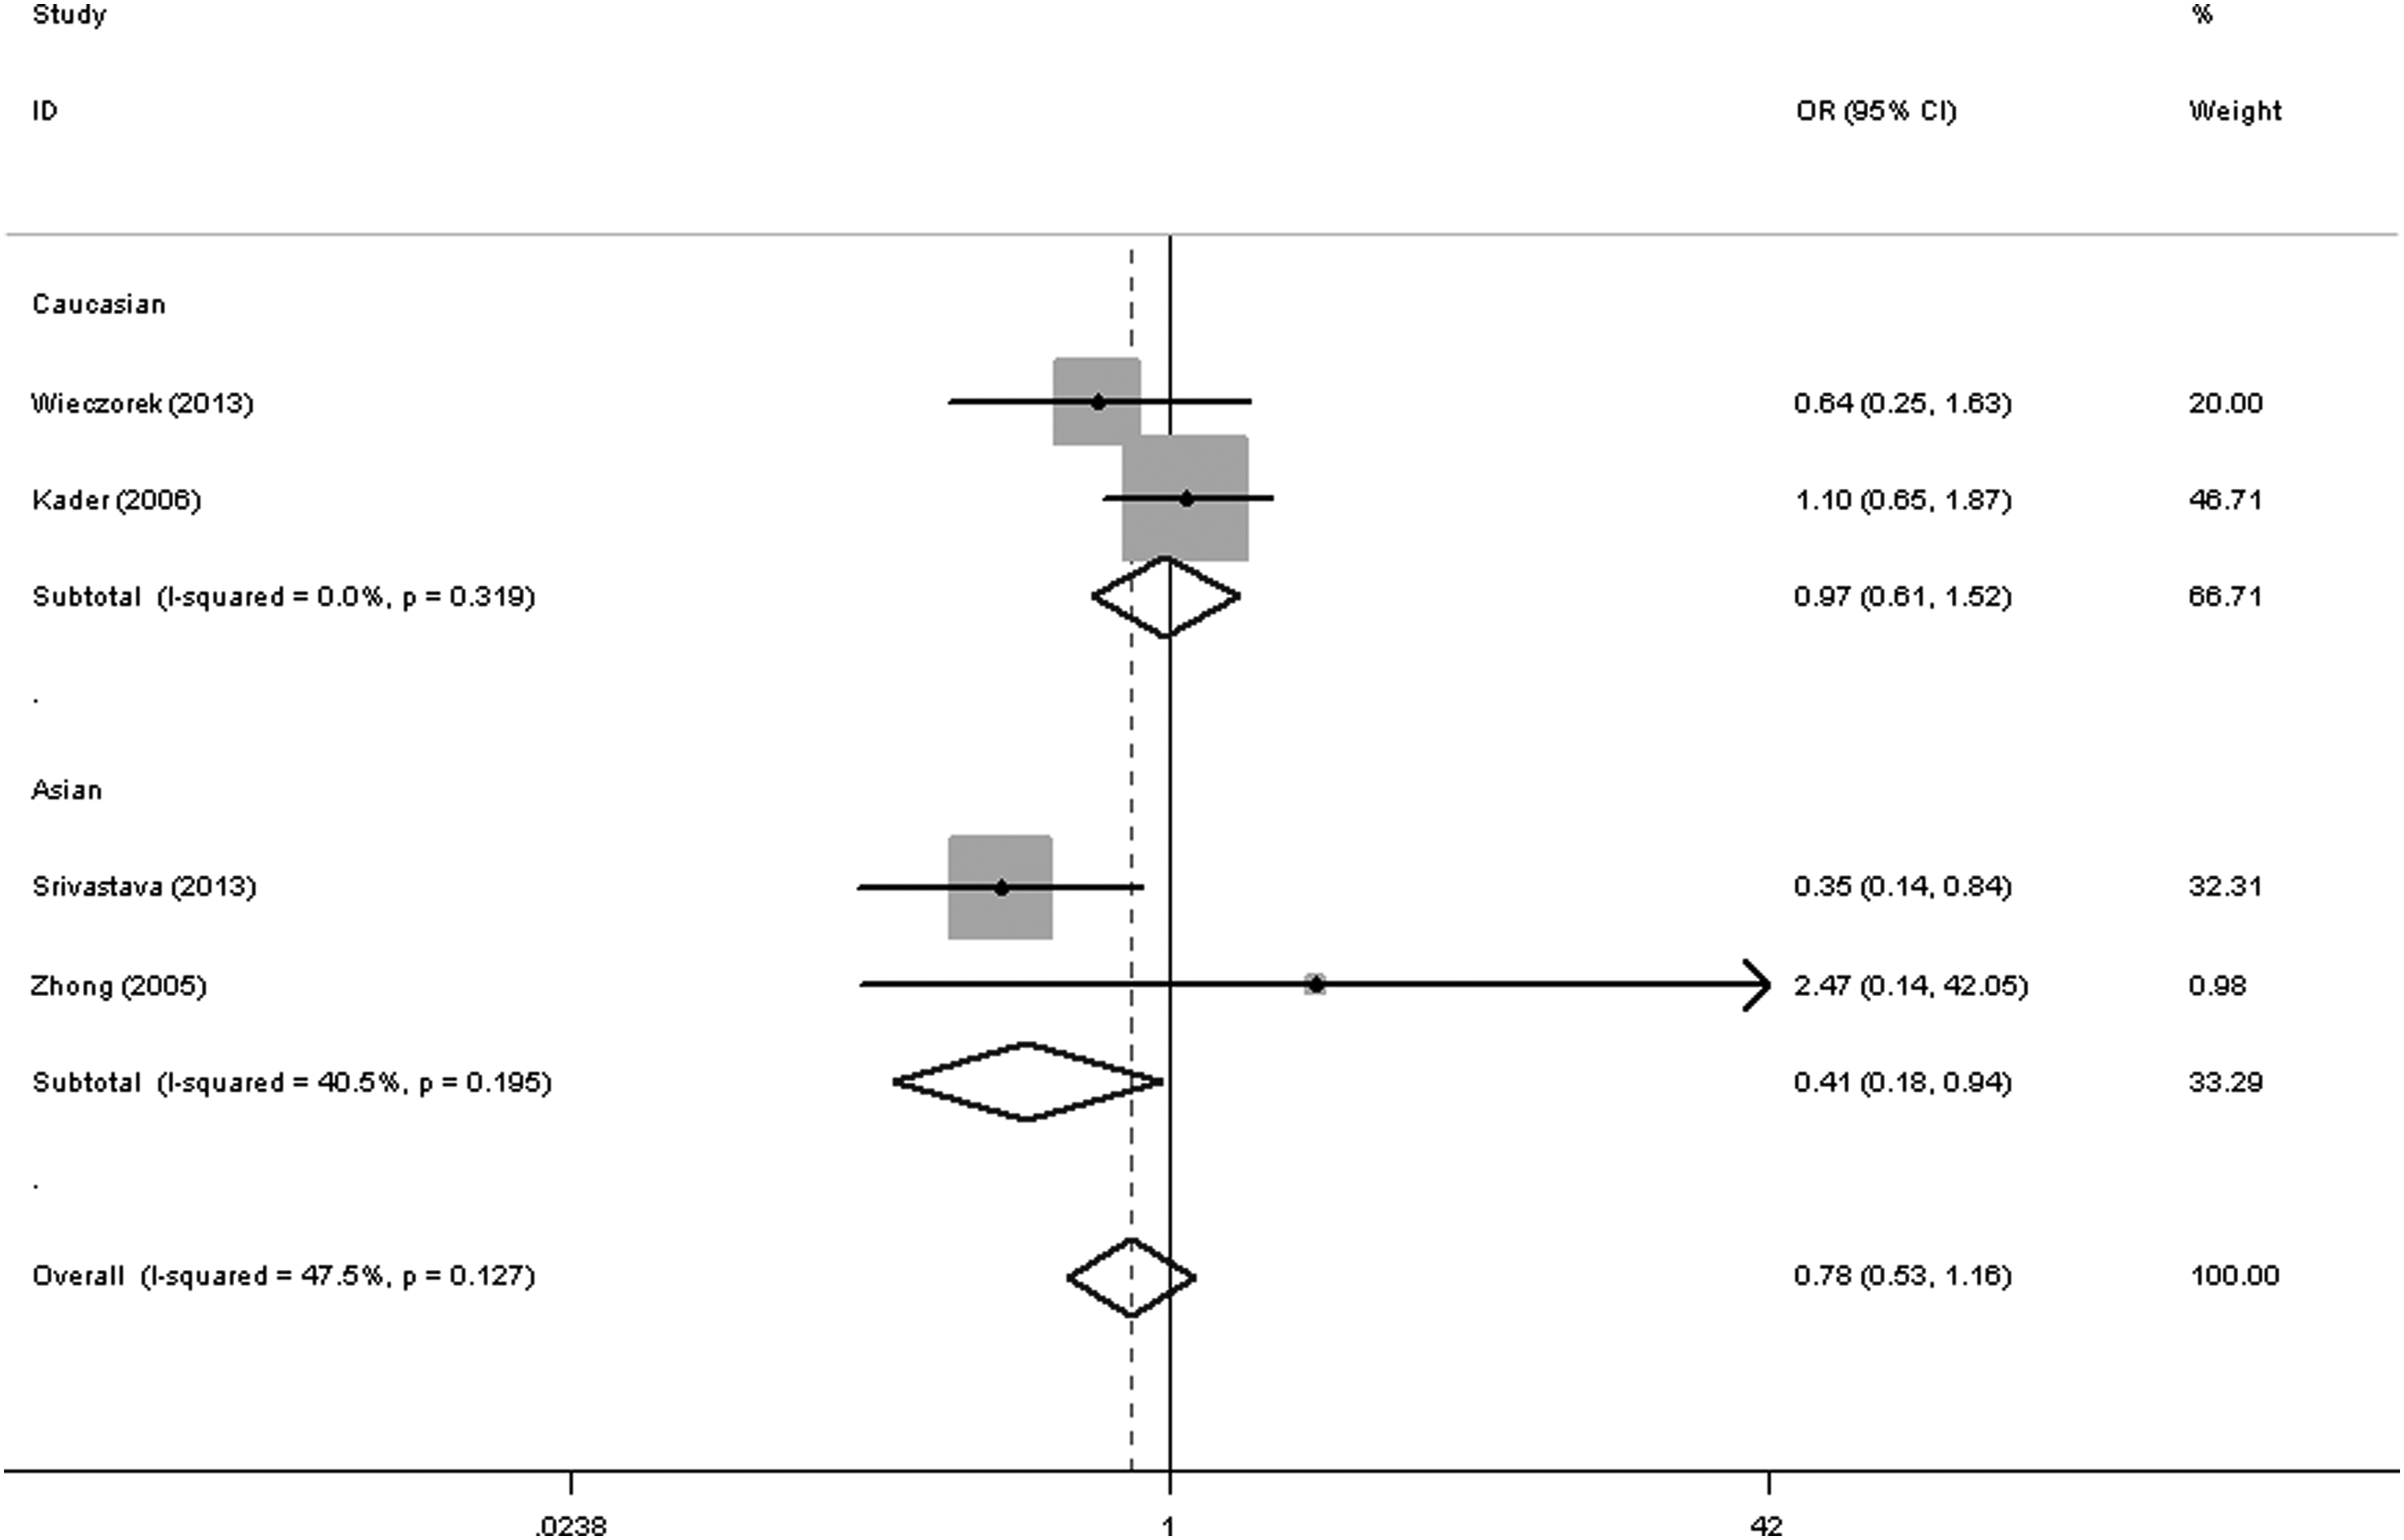
Forest plot of bladder cancer risk associated with the MMP2 -1306 C/T polymorphism (dominant genetic model) in the whole. The squares and horizontal lines correspond to the study-specific OR and 95% CI. The area of the squares reflects the weight (inverse of the variance). The diamond represents the summary OR and 95% CI.
Regarding the MMP7 -181 A/G status, all studies were about bladder cancer. Significant decreased associations were found in overall comparisons, and significant associations were also found for both ethnicity groups (heterozygote comparison [GA vs. AA]: OR = 0.57, 95% CI = 0.39-0.83, pheterogeneity = 0.502; dominant genetic model [GG+GA vs. AA]: OR = 0.59, 95% CI = 0.41-0.83, pheterogeneity = 0.404; allelic contrast [G vs. A]: OR = 0.81, 95% CI = 0.66-0.98, pheterogeneity = 0.325, Fig. 4 and Table 2).
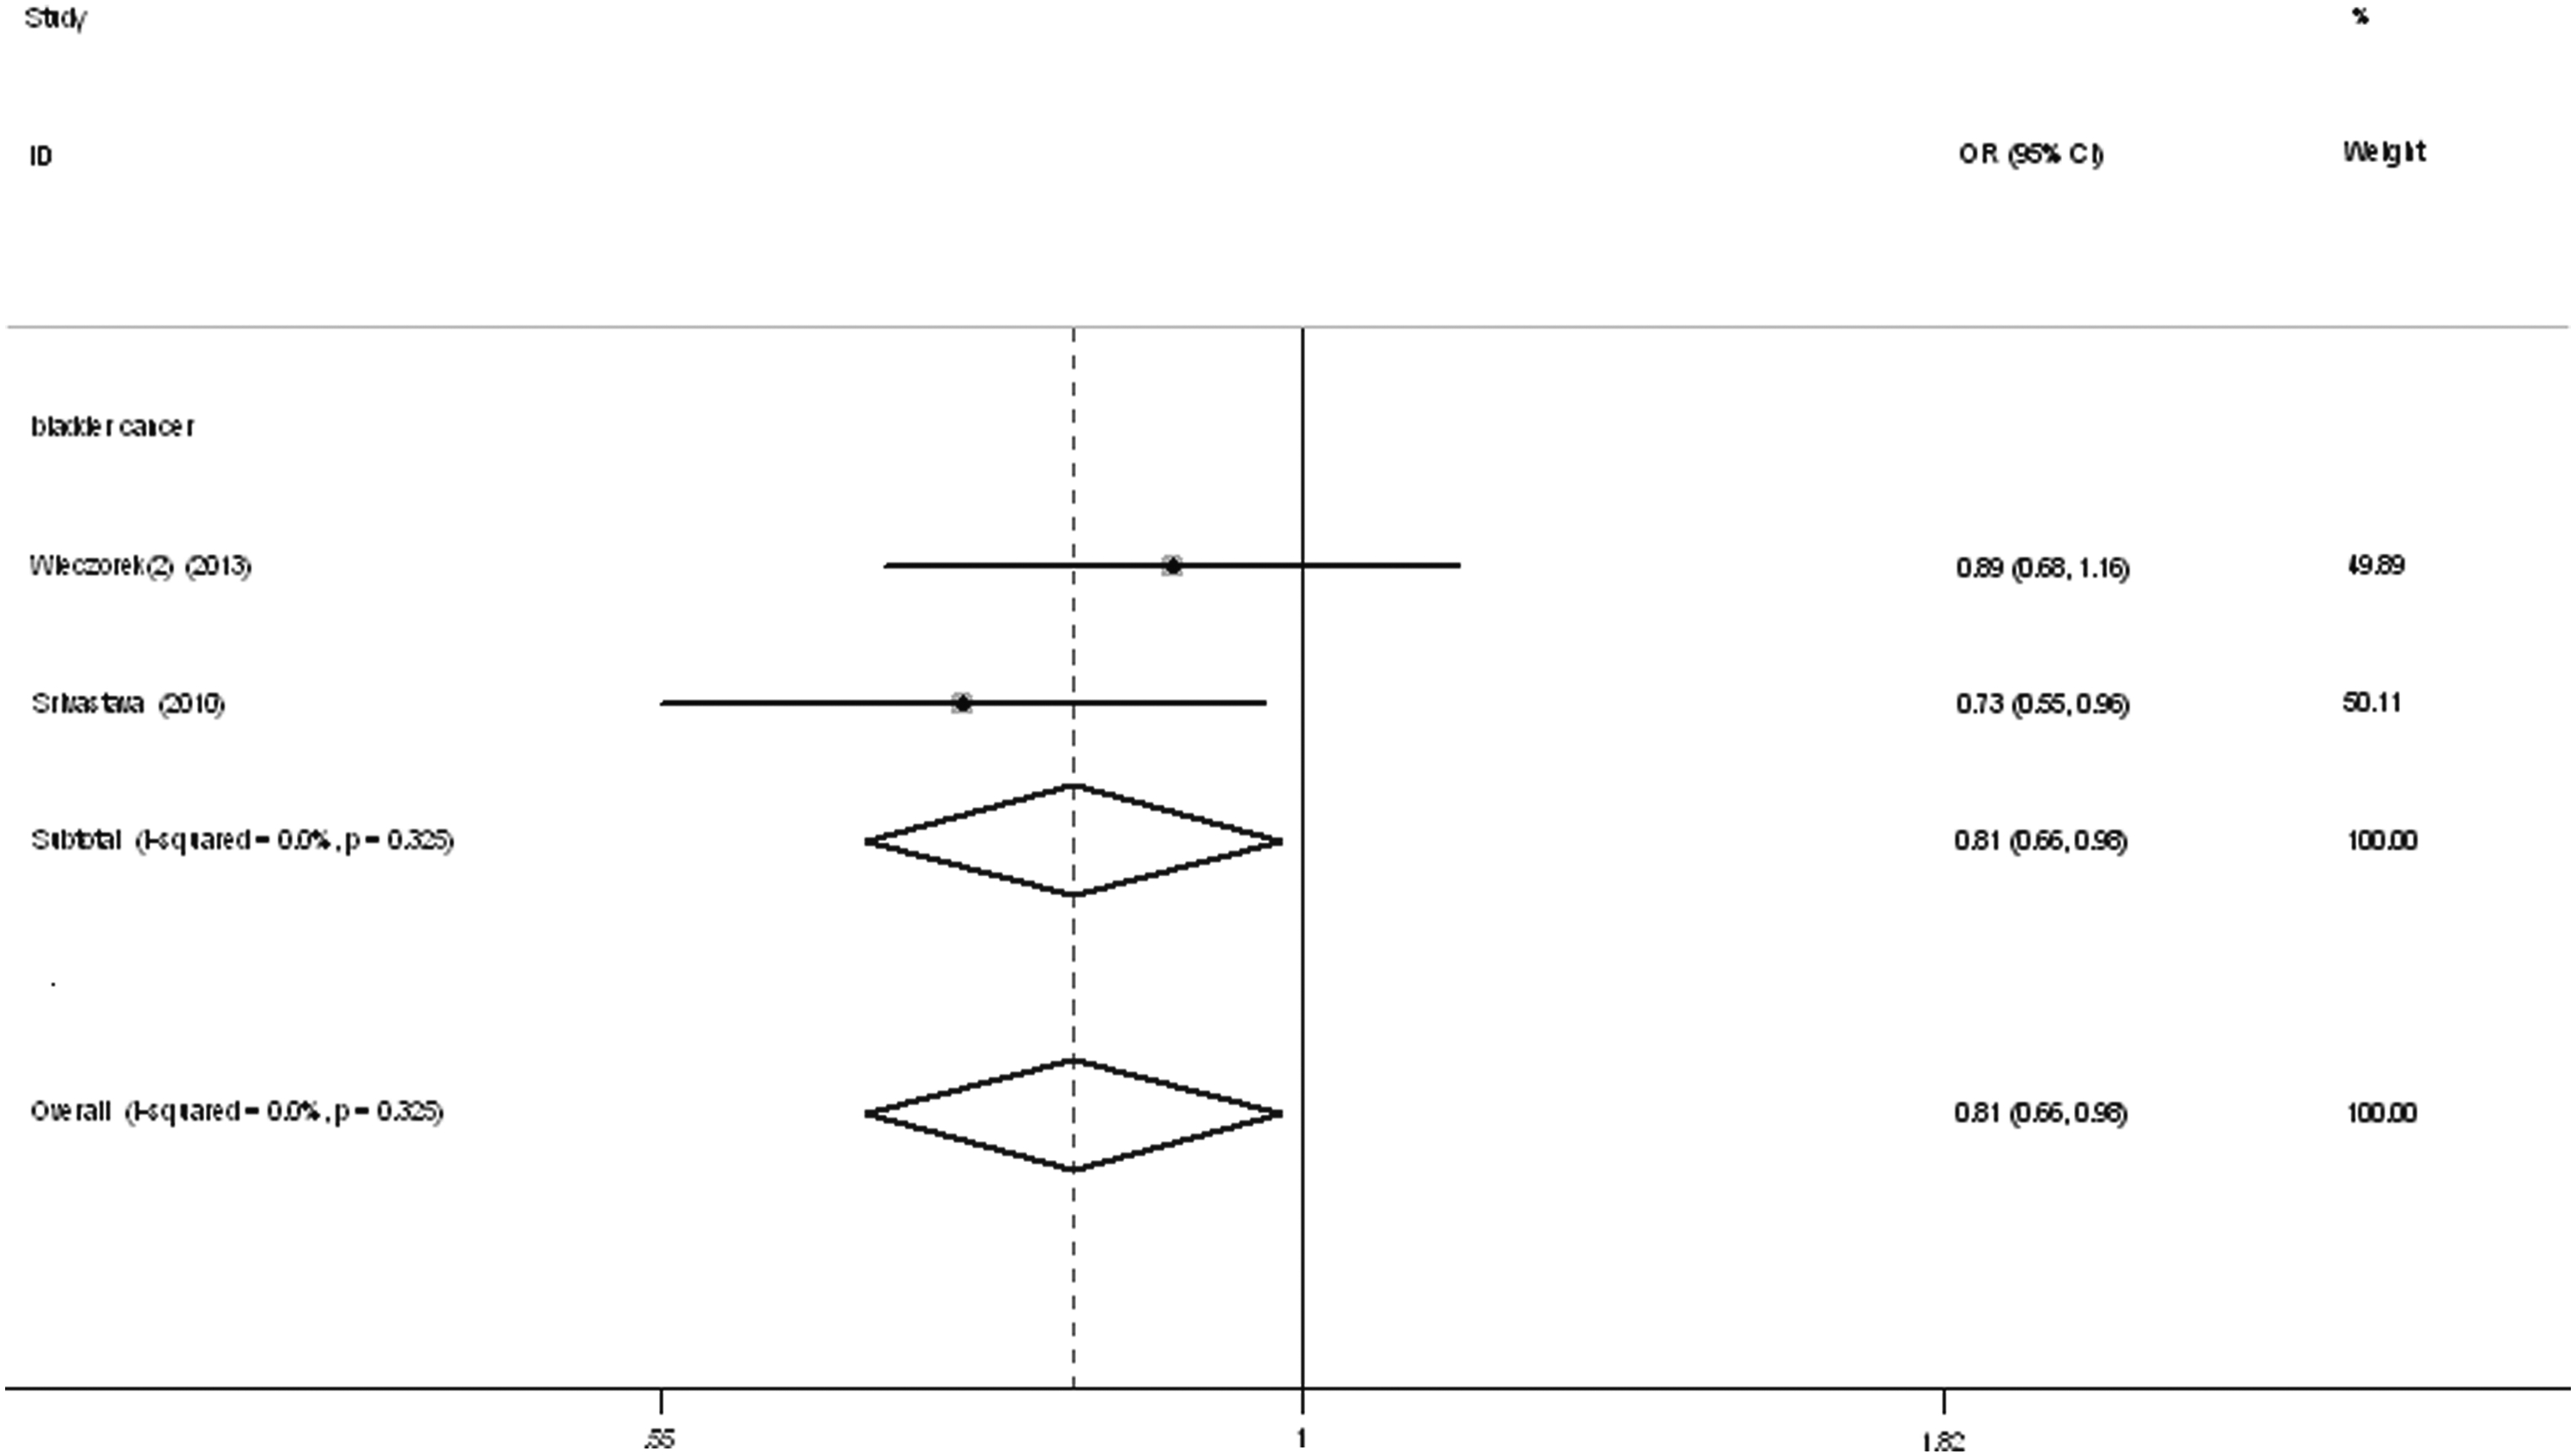
Forest plot of bladder cancer risk associated with the MMP7 -181A/G polymorphism (allelic contrast) in the whole. The squares and horizontal lines correspond to the study-specific OR and 95% CI. The area of the squares reflects the weight (inverse of the variance). The diamond represents the summary OR and 95% CI.
To our regret, no association was detected between urinary cancer risk and the MMP9 -1562 C/T SNP, the MMP9 (279R/Q) A/G SNP, the MMP3 (45E/K) G/A SNP, the MMP9 (574R/P) T/C SNP, or the MMP9 (668Q/R) A/G SNP (Table 2).
Publication bias
The Begg's funnel plot and Egger's test were performed to access any publication bias in the literature. The shape of the funnel plots seemed asymmetrical in allele comparison for MMP polymorphisms, suggesting the presence of publication bias. Egger's test was then used to provide statistical evidence of funnel plot symmetry. As expected, the results have not shown an obvious evidence of publication bias (data not shown).
Discussion
SNPs are the most abundant form of genetic variation in the human genome. By convention, a point mutation is referred to as a SNP when the frequency of the minor (rarer) allele exceeds 1% in at least one population (Sherry et al., 1999). For example, an SNP in a regulatory region may have an influence on gene transcription, an SNP located in an RNA splice site may affect RNA splicing, an SNP in the 3′-untranslated region of a gene may have an effect on mRNA stability, and an SNP in the coding region may result in an amino acid substitution in the encoded protein. It is thought that SNPs contribute to interindividual variability in susceptibility to common diseases such as cancer (Bond et al., 2007).
To date, the MMP family includes >25 extracellular proteinases and these enzymes are considered highly influential in the development of cancer and in tumor invasiveness and progression. They may be clinically important for their ability to degrade the various components of the ECM and basement membrane (Wieczorek et al., 2013). In previous studies, several polymorphisms in the promoters of a number of MMP genes have been well characterized. These polymorphisms may affect the production or gene expression of these MMPs in an allele-specific manner (Piccoli et al., 2007; Tsuchiya et al., 2009; Wieczorek et al., 2013; Yaykaşli et al., 2014). Furthermore, there is an increasing evidence indicating that these functional polymorphisms may contribute to interindividual differences in a wide spectrum of cancer susceptibility (Decock et al., 2008; Pereira et al., 2012; Wieczorek et al., 2012).
The importance of MMP genetic polymorphisms with significant associations for variant cancer types has been reported by different meta-analyses: Zhang et al. (2015) showed that the TT genotype of the MMP9 -1562 C/T polymorphism might be a risk factor for breast cancer; Yang et al. (2014) suggested that the MMP7 -181 A/G polymorphism may contribute to gastric cancer susceptibility; Wang et al. (2012) reported that the MMP2 C735T and C1306T polymorphisms were both associated with lung cancer risk, and patients with high MMP2 expression levels had poorer overall survival; Liu et al. (2011) found that polymorphisms of MMP1 (-1607) and MMP3 (-1612) increased the risk of colorectal cancer; and Zhang et al. (2013) suggested that both the MMP2 -1306 C/T and MMP3 -1171 5A/6A polymorphisms were associated with head and neck cancer risk.
Several studies on MMP polymorphisms and urinary cancer (bladder cancer, prostate cancer, and renal cell carcinoma) have been published: Hirata et al. (2004), Zhong et al. (2005), Awakura et al. (2006), Kader et al. (2006), Albayrak et al., (2007), Piccoli et al. (2007), Tasci et al. (2008), Tsuchiya et al. (2009), Srivastava et al. (2010a), Srivastava et al., (2010b), Wieczorek et al. (2013), Srivastava et al. (2013a), Srivastava et al. (2013b), Wieczorek et al. (2014), and Yaykaşli et al. (2014). However, no powerful and convincing conclusion has been confirmed. To the best of our knowledge, this is the first meta-analysis to explore the association between MMP gene polymorphisms and urinary cancer risk, involving ∼7120 cancer cases and 7008 controls. We found that MMP1 -1607 1G/2G (2G-allele), MMP2 -1306 C/T (T-allele), and MMP7 -181A/G (G-allele) polymorphisms were associated with significantly decreased urinary cancer risk, especially bladder cancer.
Some factors could have influenced these results, however. First, it is now widely accepted that differences in the distribution of various ethnicities between cases and controls may be a source of confounding when pooling studies. Second, cancer is a multifactorial disease that results from complex interactions between many genetic and environmental factors; this means that there will not be a single gene or single environmental factor that has large effects on cancer susceptibility (Pharoah et al., 2004). Environmental factors (e.g., tobacco smoke, dietary factors, infectious agents, and radiation) add to the carcinogenic load to which humans are exposed, but the exact numbers for this added risk are generally less well established.
Some limitations should be considered when interpreting these results. First, although we have collected all eligible studies, the total sample size was still not very large. When we did stratified analysis by cancer type or ethnicity, the sample number was smaller. Second, publication bias might have occurred and our Egger's test results may have a substantial risk of being affected by such bias. Third, the interactions between gene-gene, gene-environment, and even different polymorphic loci of the same gene may modulate cancer risk. Fourth, our meta-analysis was based on unadjusted estimates. A more precise analysis should be conducted if individual information, including other covariates such as age, sex, and cancer stage, becomes available.
In summary, our meta-analysis suggests that genetic polymorphisms in MMP1 for all populations, but MMP2 and MMP7 only in the Asian population, may protect from bladder cancer risk and play a protective role in future therapy; these polymorphisms may also be considered as tumor markers. Hereby, future studies with large sample sizes and simultaneous analysis of several SNPs in one or more MMP polymorphisms are needed to enable reliable assessments of urinary cancer susceptibility and clinical outcome.
Footnotes
Author Disclosure Statement
No competing financial interests exist.