




Abstract
Background:
Obesity, one of the most common disorders observed in clinical practice, has been associated with energy metabolism-related protein genes such as uncoupling proteins (UCPs). Herein, we evaluated UCPs as candidate genes for obesity and its morbidities.
Methods:
A total of 268 obese and 185 nonobese children and adolescents were enrolled in this study. To determine dyslipidemia, hypertension, and insulin resistance, laboratory tests were derived from fasting blood samples. UCP1-3826 A/G, UCP2 exon 8 deletion/insertion (del/ins), and UCP3-55C/T variants were also genotyped, and the relationships among the polymorphisms of these UCPs and obesity morbidities were investigated.
Results:
The mean ages of the obese and control groups were 11.61 ± 2.83 and 10.74 ± 3.36 years, respectively. The respective genotypic frequencies of the AA, AG, and GG genotypes of UCP1 were 46.3%, 33.2%, and 20.5% in obese subjects and 46.5%, 42.2%, and 11.4% in the controls (p = 0.020). G alleles were more frequent in obese subjects with hypertriglyceridemia (42.9%; p = 0.048) than in those without, and the GG genotype presented an odds ratio for obesity of 2.02 (1.17-3.47; p = 0.010). The polymorphisms of UCP2 exon 8 del/ins and UCP3-55C/T did not influence obesity risk (p > 0.05). The I (ins) allele was associated with low HDL cholesterolemia (p = 0.023).
Conclusion:
The GG genotype of the UCP1-3826 A/G polymorphism appears to contribute to the onset of childhood obesity in Turkish children. The GG genotype of UCP1, together with the del/del genotype of the UCP2 polymorphism, may increase the risk of obesity with synergistic effects. The ins allele of the UCP2 exon 8 del/ins polymorphism may contribute to low HDL cholesterolemia.
Introduction
T
Because the genome-wide association studies have already identified single-nucleotide polymorphisms related to several complex conditions, great efforts have been made to identify genes associated with several disorders, and many studies have focused on genes related to energy expenditure, such as those encoding adrenergic receptors and mitochondrial UCPs (Silva and Rabelo, 1997; Valve et al., 1998; Verdi et al., 2015).
UCPs are believed to transport fatty acid anions from the inner surface of the inner mitochondrial membrane to its outer surface (Garlid et al., 1996). UCP1 plays important roles in the metabolic and energy balance and regulation, cold- and diet-induced thermogenesis, and decreasing the production of reactive oxygen species by mitochondria, all of which are mechanisms associated with the pathogenesis of obesity and/or type 2 diabetes mellitus (DM2) (Dalgaard and Pedersen, 2001). UCP1 plays an important thermogenic role in brown adipose tissue by virtue of its capacity to uncouple mitochondrial respiration from oxidative phosphorylation in a regulated manner (Silva and Rabelo 1997). UCP2 and UCP3 are located within 150 kb of each other on chromosome 11q13 (Pecqueur et al., 1999). Activation of UCP2 may attenuate glucose-stimulated insulin secretion by pancreatic β cells (Rutter, 2001). UCP3 is predominantly expressed in skeletal muscles. Because of its suspected function, UCP3 is one of the many genes that may be associated with early obesity or its effects (Boss et al., 1997).
Some well-known polymorphisms of UCPs have been reported to be functional variants on gene expression: the UCP1-3826 A/G polymorphism has been associated with reduced mRNA expression (Csernus et al., 2013), and a relationship between A to G substitution of the UCP1 gene and an increased capacity to gain weight (Valve et al., 1998; Otabe et al., 2000; Csernus et al., 2013) and resistance to a low-calorie diet have been observed (Valve et al., 1998). The UCP2 45 bp exon 8 deletion/insertion (del/ins) polymorphism has been associated with mRNA processing or transcript stability (Jun et al., 2009). Schrauwen et al. (1999) reported that Pima Indians carrying the −55T allele present a significantly higher UCP3 mRNA concentration than −55C homozygotes, thereby suggesting that the −55T allele can increase UCP3 mRNA expression. The UCP3-55T variant has shown a protective role against fat accumulation, especially in children with low levels of physical activity (Walder et al., 1998).
In this study, UCPs were examined as candidate genes for obesity and were also investigated for association with obesity-associated disturbances such as hypertension, dyslipidemia, and insulin resistance.
Materials and Methods
Participants and study area
A total of 268 obese children and adolescents who were followed at the Hospital of the School of Medicine at Gaziosmanpasa University, Tokat, Turkey, were enrolled in this study. Another 185 nonobese school-aged children from outpatient of pediatric clinics were recruited for the control group. The study protocol was in accordance with the Helsinki Declaration of the World Medical Association and ethical standards, and approval of this study was received from the Ethics Committee of Gaziosmanpasa University School of Medicine (14-KAEK-204). Informed consent was obtained and questionnaires used to gather information were answered by parents and the participants themselves.
Weights were measured using a digital scale (Seca Corp., Chino, CA) and taken while the patients were barefoot and wearing light clothing. Height was measured using a portable stadiometer (Seca Corp.). Body mass index (BMI) was calculated as weight in kilograms divided by height in square meters (kg/m2). The subjects were diagnosed as obese according to a BMI of >95 percentile considering the sex- and age-specific growth curves and cutoff levels proposed by Neyzi et al. (2008).
Laboratory tests
Laboratory tests, including glucose, insulin levels, and lipid profiles, were derived from fasting blood samples drawn only from obese participants. Blood samples were also subjected to genetic analysis for UCP polymorphisms. Besides genetic analyzes, the control group was not subjected to laboratory tests.
Serum fasting glucose, insulin, triglycerides (TGs), and high-density lipoprotein cholesterol (HDL-C) were detected using reagent kits from Roche Diagnostics adapted to the COBAS 6000 Autoanalyzer (Roche Diagnostics, Indianapolis, IN).
Definition of hypertension, insulin resistance, and dyslipidemia
Blood pressure (BP) was measured using a digital sphygmomanometer (OMRON 705IT; Omron Healthcare Co., Kyoto, Japan). If the measured BP was high according to age, sex, and height, the mean of two measurements was noted. Hypertension was defined as a BP ≥95th percentile according to age, sex, and height (Falkner and Daniels, 2004).
The homeostasis model assessment of insulin resistance index (HOMA-IR) was calculated using the following equation: HOMA-IR = fasting insulin (μU/mL) × fasting glucose (mg/dL)/405). The HOMA cutoff for insulin resistance diagnosis was 3.16 (Keskin et al., 2005).
Dyslipidemia was defined as the existence of any of these criteria: TGs >105 mg/dL in children <10 years of age and >136 mg/dL in children ≥10 years of age and HDL-C <35 mg/dL (Sangun et al., 2011).
Genetic analysis
Blood samples were collected from each subject, and DNA was extracted from peripheral blood samples using a GeneAll® ExgeneTM Blood SV Genomic DNA Kit according to the manufacturer's instructions. UCP1-3826 A/G, UCP2 exon 8 del/ins, and UCP3-55C/T gene polymorphisms were analyzed by a polymerase chain reaction (PCR)-based restriction fragment length polymorphism (RFLP) method. PCR was performed in a total volume of 25 μL containing 25-50 ng of genomic DNA, 0.8 nmol/μL of each primer, 1.5 mM MgCl2, 2.5 μL of 10 × PCR buffer, 0.3 mM dNTP, and 1 U Taq DNA polymerase (Fermentas, Shenzhen, China). The PCR primers, PCR programs, product sizes, and restriction enzymes are shown in Table 1. The amplified products were run on 3% agarose gel, stained with ethidium bromide, and visualized under ultraviolet light.

Statistical analysis
Data are expressed as mean ± standard deviation or frequency and percent. Independent samples t-test was used to compare continuous normal data between groups. The χ2 test was used to compare categorical data between/among groups and evaluate the Hardy-Weinberg equilibrium of the distribution of genotypes in patients and controls. A p < 0.05 was considered significant. Analyses were performed using SPSS 19 (IBM SPSS Statistics 19; SPSS, Inc., Somers, NY).
Results
The UCP1-3826 A/G, UCP2 exon 8 del/ins, and UCP3-55C/T variants were genotyped, and associations between the UCP1, UCP2, or UCP3 polymorphisms and BMI, hypertension according to systolic/diastolic systemic BP, and obesity-related biochemical traits (e.g., HDL-C, TG, fasting glucose, insulin, HOMA-IR) in obese children and adolescents were examined. The clinical and laboratory characteristics of the study participants are shown in Table 2.
Data are shown as mean ± standard deviation or frequency, percentage.
BMI, body mass index; HDL-C, high-density lipoprotein cholesterol, HOMA-IR, the homeostasis model assessment of insulin resistance index; IR, insulin resistance; TGs, triglycerides.
The respective genotype frequencies of the AA, AG, and GG genotypes of UCP1 were 46.3%, 33.2%, and 20.5% in obese subjects and 46.5%, 42.2%, and 11.4% in control subjects (p = 0.020), and the allelic frequency of the G allele was 37.1% in obese subjects and 32.4% in controls (p = 0.146). The genotype frequencies observed were in Hardy-Weinberg equilibrium. G alleles were more frequent (42.9%) in obese subjects with hypertriglyceridemia than in obese subjects with normal levels of TGs (34.4%; p = 0.048). Table 3 shows the clinical characteristics of the study participants according to the genotypes of the UCP1, UCP2, and UCP3 polymorphisms.
Data are shown as n (%).
Statistical significance is shown in bold.
D, deletion (del);
Homozygotes for the UCP1 GG genotype showed an odds ratio (OR) for obesity of 2.02 (1.17-3.47; p = 0.010; Fig. 1). The BMI levels of the GG genotype (25.56 ± 5.38) were significantly higher than those found in subjects with other (AA and AG) genotypes (23.83 ± 6.34; p = 0.028). By contrast, HDL-C levels were significantly lower for carriers of the GG genotype (44.66 ± 13.72) than for carriers of other genotypes (AG and AA, 49.14 ± 11.89; p = 0.017). The means of quantitative variables are indicated in Table 4.
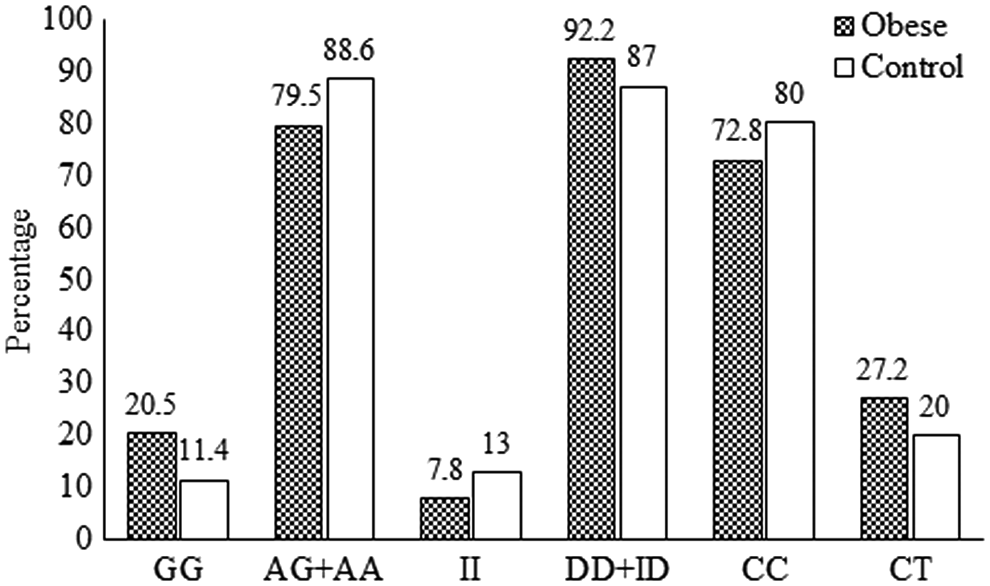
Comparisons of percentages of genotypes of UCPs in obese and control participants. GG homozygous genotype with AG and AA genotypes for UCP1 (χ2 = 6.593; p = 0.010; odds ratio [95% CI] = 2.02 [1.17-3.47]). II homozygous genotype with ID and DD genotypes for UCP2 (p > 0.05). CC homozygous genotype with CT heterozygotes for UCP3 (χ2 = 3.119; p = 0.077). D, deletion (del);
Data are shown as mean ± standard deviation.
Statistical significance is shown in bold.
Different superscript letters indicate a statistical significant difference.
UCP2 exon 8 del/ins polymorphisms did not influence the risk of obesity (p > 0.05; Table 3), and homozygotes of ins/ins were associated with lower BMI levels compared with del/del (DD) homozygotes (p = 0.036; Table 3). The ins allele was associated with low HDL cholesterolemia (p = 0.023; Table 3).
While the UCP3-55C/T polymorphisms were not associated with any risk for obesity (p = 0.077), the CC homozygote genotype and C allele were indicated as factors for hypertension in obese subjects (p = 0.043, OR = 1.88 [1.02-3.49] and p = 0.006, OR = 1.71 [0.96-3.03], respectively; Table 3).
To better understand the possible synergistic implication of UCP1 and UCP2 in the development of human obesity, we have divided the study participants into two groups: the first group included subjects who were carriers of both the GG homozygote of the UCP1 polymorphism and the DD homozygote of the UCP2 polymorphism (group 1) and the second group included all other participants (group 2). Group 1 generally showed an OR of 2.69 (p = 0.014) for obesity, and obese subjects in this group demonstrated an OR of 3.57 (p = 0.010) for low HDL cholesterolemia. Table 5 summarizes the clinical characteristics of participants who had both the genotypes, GG genotype of the UCP1 polymorphism and the DD genotype of the UCP2 polymorphism.
Data are shown as n (%).
Statistical significance is shown in bold.
Discussion
Considering its morbidities, obesity is an important health problem among children. The condition has been suggested to result not only from excess food intake but also from low energy expenditure. When hereditary properties are considered, polymorphisms of genes related to energy metabolism are believed to promote increased susceptibility to developing obesity.
The results of this study support an association between UCP polymorphisms and obesity and low HDL cholesterolemia because GG homozygous genotype carriers showed a twofold higher risk of developing obesity than noncarriers. Because of the role of UCPs in energy expenditure, we suggest that childhood-onset obesity is associated with UCP polymorphisms.
The GG genotype of the UCP1-3826 A/G polymorphism may independently exert a significant effect on obesity development, and GG genotype individuals indicated twofold higher risks of developing obesity than individuals with other genotypes of UCP1-3826 A/G polymorphisms. Associations between UCP1-3826 A/G polymorphisms and obesity-related phenotypes and phenomena, such as BMI (Matsushita et al., 2003; Nakano et al., 2006), lipid/lipoprotein (Kotani et al., 2008), and DM2 (Sramkova et al., 2007), have been described. Nakano et al. (2006) reported that A/G heterozygotes present higher BMIs than A/A and G/G homozygotes in young Japanese males. In contrast to this study and in agreement with Evans et al. (2000), however, we found that GG homozygotes were associated with higher BMI. Some researchers have reported no association between BMI and the UCP1-3826 G polymorphism (Evans et al., 2000; Kotani et al., 2008). Differences in study populations could strongly influence study findings. The effects of gene polymorphisms may sometimes be observed more extensively in a population under specific situations (i.e., obese population, diseased population, or ethnicity), leading to differences in data compared with earlier reports.
The GG genotype of the UCP1-3826 G polymorphism has been demonstrated to exert a significant effect on high HDL-C status and low TGs (Kotani et al., 2008). By contrast, in the present study, the GG genotype of UCP1 was related to decreased HDL-C values and high TGs, thereby suggesting higher risks of developing cardiovascular disease. The current research examined HDL-C and TGs only in obese children, while previous studies examined these parameters in healthy Japanese adults. As discussed above, obesity and ethnicity may affect findings among studies. In agreement with our study, Kiec-Wilk et al. (2002) and Oh et al. (2004) reported that GG genotype carriers present statistically significant lower HDL-C levels and higher TGs than noncarriers.
In agreement with other researchers who found no associations between UCP1-3826 A/G polymorphisms and DM2 (Brondani et al., 2014), significant differences between fasting glucose and insulin levels and HOMA-IR values according to the polymorphisms studied were not observed in this work.
In the present study, in agreement with the study of Ochoa et al. (2007), UCP2 exon 8 del/ins polymorphisms were not linked to obesity; however, homozygotes of DD in UCP2 exon 8 polymorphisms were associated with high BMI levels, inconsistent with the suggestion of no correlation between UCP2 and BMI (Evans et al., 2000). In the UCP2 polymorphism, the del allele is associated with low HDL cholesterolemia. This polymorphism has been the subject of recent reports with conflicting findings. In Spanish children, obesity was associated with a haplotype that included del alleles (Ochoa et al., 2007). Unlike in the present study, research, including a smaller sample of children, indicated that the ins variant is related to obesity and that children with the del/ins genotype have markedly higher BMIs than those with the DD genotype (Yanovski et al., 2000). The ins/ins homozygous genotype has also been correlated with high BMI levels in obese German (Evans et al., 2000) and Hungarian (Csernus et al., 2013) populations. Consistent with our findings, however, the ins allele frequency did not differ between obese and normal-weighing German children (Tu et al., 1998). Supplementary results were obtained in a study that showed carriers of the 45 bp insertion featuring higher metabolic rates than those without this insertion (Kovacs et al., 2005). This impact on energy metabolism could explain the higher obesity risk of these alleles in noncarriers than in carriers.
Although linkages have been reported between markers close to the UCP2 gene and diabetes (Fleury et al., 1997), a prediabetic phenotype in Pima Indians (Pratley et al., 1998), and insulin levels and insulin resistance (Ochoa et al., 2007), we found no association between the polymorphism and insulin levels, insulin resistance, and HOMA-IR values in obese children. These discrepancies can be partly explained by differences in study design (e.g., phenotypical measurements, characteristics of the participants, ethnic origin, age, gender, sample size, and statistical analysis).
Obese subjects who were carriers of both the GG homozygotes of the UCP1 polymorphism and the DD homozygotes of the UCP2 polymorphism were at significantly higher risk for developing obesity and low HDL cholesterolemia than those who were not. A synergistic effect of the two polymorphisms has been reported by a number of groups (Fumeron et al., 1996; Valve et al., 1998; Evans et al., 2000), in agreement with the present findings. A low HDL cholesterol level is a major risk factor for atherosclerosis (Lewis and Rader, 2005). Thus, the synergistic effect of the UCP1 and UCP2 polymorphisms may be a risk factor for cardiovascular disorders.
While UCP3-55C/T polymorphisms were not associated with obesity, CC homozygous carriers of the UCP3-55C/T polymorphism showed a risk for hypertension in obese children consistent with previous studies (Cha et al., 2007; Csernus et al., 2013), but no risk for atherosclerotic diseases, inconsistent with Meirhaeghe et al. (2000). A previous study suggested a positive correlation between UCP3-55 TT polymorphism and BMI (Otabe et al., 2000), but we did not observe this relationship because TT homozygous carriers were not found in this work. The UCP2 polymorphism has been linked to hypertension in Japanese adults (Ji et al., 2004); the polymorphism of UCP3 does not appear to show such a relationship. The 55 CT genotype of UCP3 presents increased risk of insulin resistance in obese subjects (Ochoa et al., 2007).
Conclusion
Our observations suggest that, although not the main or only factor of obesity development, the GG genotype of the UCP1-3826 A/G polymorphism could contribute to the onset of childhood obesity in Turkish children. When the synergistic effect of certain polymorphisms, each conferring a small increase in the risk to the individual, is considered, the GG genotype of UCP1 together with the DD genotype of UCP2 polymorphism may increase the risk of obesity by twofold. UCP polymorphisms may also contribute to obesity-related disorders, including dyslipidemia and hypertension. A combination of polymorphisms in one or more candidate genes may contribute to the development of most cases of obesity. Thus, obesity, similar to other metabolic disorders, is a complicated process that involves environmental, nutritional, and genetic (i.e., polymorphisms) factors. Further studies are needed to better understand the role of genetic polymorphism and functional activity of UCP genes in the pathogenesis of obesity.
In conclusion, we found that a genetic variant of UCPs appears to be associated with childhood-onset obesity and its morbidities.
Footnotes
Acknowledgment
This work was supported by Gaziosmanpasa University Scientific Research Projects Fund. Project number: 2014/53.
Author Disclosure Statement
No competing financial interests exist.