




Abstract
Background:
Long noncoding RNAs (lncRNAs) have recently been recognized as a new layer of biological regulation. They participate in mRNA regulation and may be useful as prognostic factors and drug targets. Colorectal cancer (CRC) is a common tumor that is characterized by its high mortality rate. Despite improvements in screening of CRC, the prognosis is still poor. Therefore, there is an urgent need to develop effective biomarkers for the detection of CRC. This study was designed to measure the expression of several oncogenic lncRNAs, including PANDAR, MALAT1, PCAT6, CCAT1, UCA1, MEG3, CCAT2, and BCAR4, in blood samples of healthy individuals and CRC patients.
Methods:
Total RNA was isolated from whole blood of 63 CRC patients and 40 controls and the expression of the lncRNAs was determined by real-time polymerase chain reaction and measured by REST2009 software. All p-values <0.05 were considered statistically significant.
Results:
The results showed that the expression levels of MALAT1, CCAT1, and PANDAR were significantly upregulated with 1.86, 4.54, and 4.68-fold higher levels (p < 0.05), respectively, in the blood of CRC patients compared to the controls. However, the other lncRNAs examined were not significantly expressed differentially in CRC blood samples.
Conclusion:
The findings of this study suggest that the expression of MALAT1, CCAT1, and PANDAR in blood could serve as potential biomarkers for CRC prognosis.
Introduction
Mammalian genome is composed of <2% of protein-encoded region (Tang et al., 2013). The International Human Genome Sequencing Consortium showed that human genome is composed of about 25,000 protein-coding genes only (Li et al., 2016). After the discovery of RNA, various regulatory RNAs, of different sizes and shapes, have been recognized (Pink et al., 2011). Studies showed that those regulatory RNAs were transcribed but did not encode proteins, and they were classified as mRNA splicing and RNA genes comprising translation machinery and its regulation (Liu et al., 2016). However, the discovery of transcribed RNAs that do not encode for proteins but have specific functions emphasizes that RNAs have roles beyond their role in the translation of DNA (Huth et al., 2014).
The nonprotein-coding RNAs (ncRNAs) are classified based on their lengths into two groups: small ncRNAs of <200 nucleotides and long noncoding RNAs (lncRNAs) of >200 nucleotides (Shi et al., 2015). lncRNAs are a heterogeneous highly abundant group and are similar in their structures to protein-coding genes (Gaudet et al., 2014). They have promoter sequences, exons, and introns but not open reading frames (Bolton et al., 2014). Although many functions of lncRNAs are still unknown, they play critical roles in human diseases most notably cancers. Furthermore, they are suggested to be promising biomarkers for cancer prognosis and diagnosis (Xu et al., 2014).
Colorectal cancer (CRC) is one of the most common cancers among men and women worldwide (Lü et al., 2015). Moreover, due to its rapid and advanced progression at the time of diagnosis, it is registered as a high mortality rate cancer (Ding et al., 2015). Usually, CRC results from the accumulation of environmental, epigenetic, and acquired genetic factors (Mármol et al., 2017). Most of CRC patients reached advanced stage of cancer before the appearance of real symptoms; this leads to poor survival rate (Ding et al., 2015). Most screening methods used for CRC diagnosis ranged from noninvasive stool or blood tests to complicated imagining techniques such as colonoscopy, capsule endoscopy, colonography, and flexible sigmoidoscopy (Matsuda et al., 2015). Studies suggested that alteration in epigenetic factors occurs more frequently than genetic factors. lncRNAs are one of the epigenetic factors, which may have role in regulating protein coding and noncoding genes (Shi et al., 2015). Moreover, they regulate many biological functions such as cell growth, apoptosis, post-transcription, epigenetic regulation, and have an important role in the development of cancer (Xu et al., 2014). According to various studies, the expression of lncRNAs varies between normal and tumor tissues, as well as among cancer types. These findings revealed that lncRNAs might act as critical regulators in tumorigenesis (Xu et al., 2014). Some lncRNAs are oncogenic, they are upregulated in cancers, whereas some act like tumor suppressors and they are downregulated in tumors (Smolle et al., 2014). Therefore, the expression level of lncRNAs in CRC may become an indicator of the cancer characteristics, as the epigenetic regulation and aberrant expression of lncRNAs in cancer occurs before phenotypic changes (Xu et al., 2014). However, less is known about their expression in CRC patients in Saudi Arabia. Hence, this study aimed to measure the expression levels of randomly selected oncogenic lncRNAs, including MEG3, PCAT6, UCA1, CCAT2, BCAR4, MALAT1, PANDAR, and CCAT1, in blood samples of healthy individuals and CRC patients. Those selected lncRNAs were chosen based on previous studies that showed their contributions to many aspects of cancer tumorigenesis, including CRC.
Materials and Methods
Study design
From January 2016 to August 2016, 5 mL of whole blood samples in EDTA tubes were collected from 63 CRC patients and 40 healthy subjects who visited oncology clinics and blood banks at King Abdulaziz University Hospital and King Fahad General Hospital in Jeddah, KSA. All participants were selected with the following inclusion criteria: Saudis, age ranged from 20 to 60 years, and agreed to participate in this study by signing a consent that applies Helsinki's declaration of human rights. The 63 CRC patients in this study were classified histopathologically according to the TNM staging system as follows: low grades CRC patients (n = 16) representing (n = 7) grade I and (n = 9) grade II, and high grades CRC patients (n = 47) representing (n = 16) grade III and (n = 31) grade IV. The chemotherapy regimen used were designed according to the extent of the tumor. In this study, all grade I patients did not receive any chemotherapy, grade II patients received first-line Xelox in 3-week treatment cycles (oxaliplatin [IV] 130 mg/m2 [day 1] followed by oral capecitabine 1000 mg/m2 twice daily [day 1, evening, to day 15, morning]), whereas, grades III and IV patients were treated with an adjuvant combined regimen of Xelox, Xeloda, Xeliri, and Bevacizumab. The chemotherapeutic course was different according to the patient's overall health status and the presence of metastatic tumor. The ethical approval was obtained from the permanent committee for academic council's affairs at King Abdulaziz University, Jeddah, KSA (reference no. 172110497). The practical experiments were performed at cancer and mutagenesis unit at King Fahd Medical Research Center in King Abdulaziz University, Jeddah, Saudi Arabia.
Real-time polymerase chain reaction primers design
Primers for real-time polymerase chain reaction (RT-PCR) were designed to measure the expression of lncRNAs (Table 1). The primers sequence of lncRNAs were obtained using USCS browser. The mRNA sequence was taken and by using the primer 3 web tool; primers were designed after confirming the characteristics of all primers. Moreover, sequences of primers were confirmed in (in silico PCR) by using USCS browser.
Real-Time Polymerase Chain Reaction Primers of Long Noncoding RNAs Involved in the Study
Determination of RNA concentration and quality
QIAGEN-QIAamp RNA blood mini kit (catalog no. 52304; Qiagen, Germany) was used for RNA extraction from whole blood according to the manufacturer's instructions. The total RNA was eluted with 30-50 μL of RNase-free water. The concentration of RNA was determined by reading the absorbance at wavelength of 260 nm with a DeNovix DS-11 spectrophotometer. To ensure significance, the A260 readings should be >0.15 and this corresponds to 44 μg/mL of RNA. The ratio of absorbance at A260/A280 was calculated to determine the purity of RNA, which was around (1.9-2.1). Any sample failed to follow the purity criteria was excluded.
Synthesis of complementary DNA
To synthesize complementary DNA (cDNA), the reagents of High-Capacity cDNA Reverse Transcription Kit (catalog no. 4368814; Thermo Fisher Scientific, Lithuania) were combined to form reverse transcription master mix. RNA samples (300 ng) were added to the mixture, after necessary normalization step, with nuclease-free water. The reactions were prepared and thermocycler reactions were programmed according to the manufacture's protocol. RNase Inhibitor (catalog no. N8080119; Thermo Fisher Scientific, IN) was used to prevent the degradation of RNA. All cDNAs samples were kept in −20°C until used. In parallel, reactions lacking reverse transcriptase were performed to detect the presence of amplification form of residual genomic DNA in downstream PCR.
Optimization of lncRNAs primers
The optimization experiments were performed on the cDNAs samples of 28 subjects (18 CRC patients and 10 controls) to check the quality, the design of primers, and the RT-PCR conditions. After the melting curves of the primers were checked, the RT-PCR experiments were performed on the total samples (n = 103 patients and controls). In this research, RPL11 was used as a housekeeping lncRNA.
Quantitative RT-PCR
To perform RT-PCR, Universal 2 × PowerUP™ SYBR® Green Master Mix Kit (catalog no. A25741; Thermo Fisher Scientific, IN) was used. To prepare 20 μL/well reaction, 10 μL of SYBR Green Master Mix, 8 μL of nuclease-free water, 1 μL of specific primer of selected lncRNA, and 1 μL of cDNA were mixed together. The appropriate volume of the reaction was transferred to optical plate and sealed using adhesive cover. The applied thermal cycler condition settings were dependent on the primer melting temperature (TM), which was <60°C for all primers used in this study. Both reactions preparation and thermal cycling program were designed as mentioned in the SYBR Green's methods (Table 2). For each gene, cDNA samples, −RT (no reverse transcriptase), and no template control (diethyl pyrocarbonate treated water) were analyzed in triplicate to assess the efficiency of the primers and the reproducibility of the expression results.
Thermal Cycling Conditions (Primer Tm <60°c) for Real-Time Polymerase Chain Reaction
Statistical analysis
All expression levels from RT-PCR raw data were normalized and corrected in the REST 2009 software before the target gene expression was assessed. For each gene, three independent experiments were performed. The mean of the CT values from three experiments was calculated and the relative expression for the test gene was determined by dividing its relative expression by the mean of the RPL11 that was used as a control. Differences were considered significant at p < 0.05. All data were statistically analyzed and graphically represented using GraphPad Prism version 7 (San Diego, CA). The comparison between two independent groups was made by Mann-Whitney U test. The multivariate regression analysis was made to study the correlation between many parametric variables and their effect on certain event.
Results
Determination of participants' physical characteristics
This study was performed on 63 CRC patients and 40 healthy controls. When a comparison between different physical characteristics in patients and controls were made, results obtained by the Mann-Whitney U test showed that there was significant difference in age (p = 0.04) and waist to hip ratio (WHR) (p = 0.02). In contrast, weight (p = 0.0004) and body mass index (BMI) (p = 0.0011) showed highly significant differences between these two groups (Table 3). The multivariate regression analysis showed that among all physical characteristics, only obesity had a significant correlation with BMI and WHR more than other factors (Table 3).
Physical Characteristics Comparison Between Colorectal Cancer Patients and Controls
p<0.05, **p<0.01, ***p<0.001.
BMI, body mass index; WHR, waist to hip ratio.
Expressions of lncRNAs in CRC
The expression of lncRNAs in the blood of CRC patients was determined and compared with healthy controls. The comparison made by REST2009 showed that among the eight lncRNAs, only three showed significant differences with a high-fold change expression level in CRC patients. The three significant expressed lncRNAs were MALAT1, PANDAR, and CCAT1 with expression level of 1.86, 4.68, and 4.54-fold changes and (p < 0.05), respectively (Fig. 1). In contrast, the nonsignificant expressed lncRNAs were MEG3, PCAT6, UCA1, CCAT2, and BCAR4. The expression level and the p-values of these nonsignificant lncRNAs in CRC blood samples were as follows: MEG3 expression was 1.98-fold change (p = 0.29), PCAT6 expression was 2.3-fold change (p = 0.08), UCA1 expression was 2.28-fold change (p = 0.07), CCAT2 expression was 1.77-fold change (p = 0.41), and BCAR4 expression was 2.23-folds (p = 0.14) (Fig. 2).

The expression of significant lncRNAs (MALAT1, PANDAR, and CCAT1) in CRC patients using RT-PCR. As shown from the data, the relative expression (fold change) of these lncRNAs were significantly upregulated with 1.86, 4.68, and 4.54 for MALAT1, PANDAR, and CCAT1, respectively, in CRC patients compared with controls (*p < 0.05). CRC, colorectal cancer; lncRNA, long noncoding RNAs; RT-PCR, real-time polymerase chain reaction.
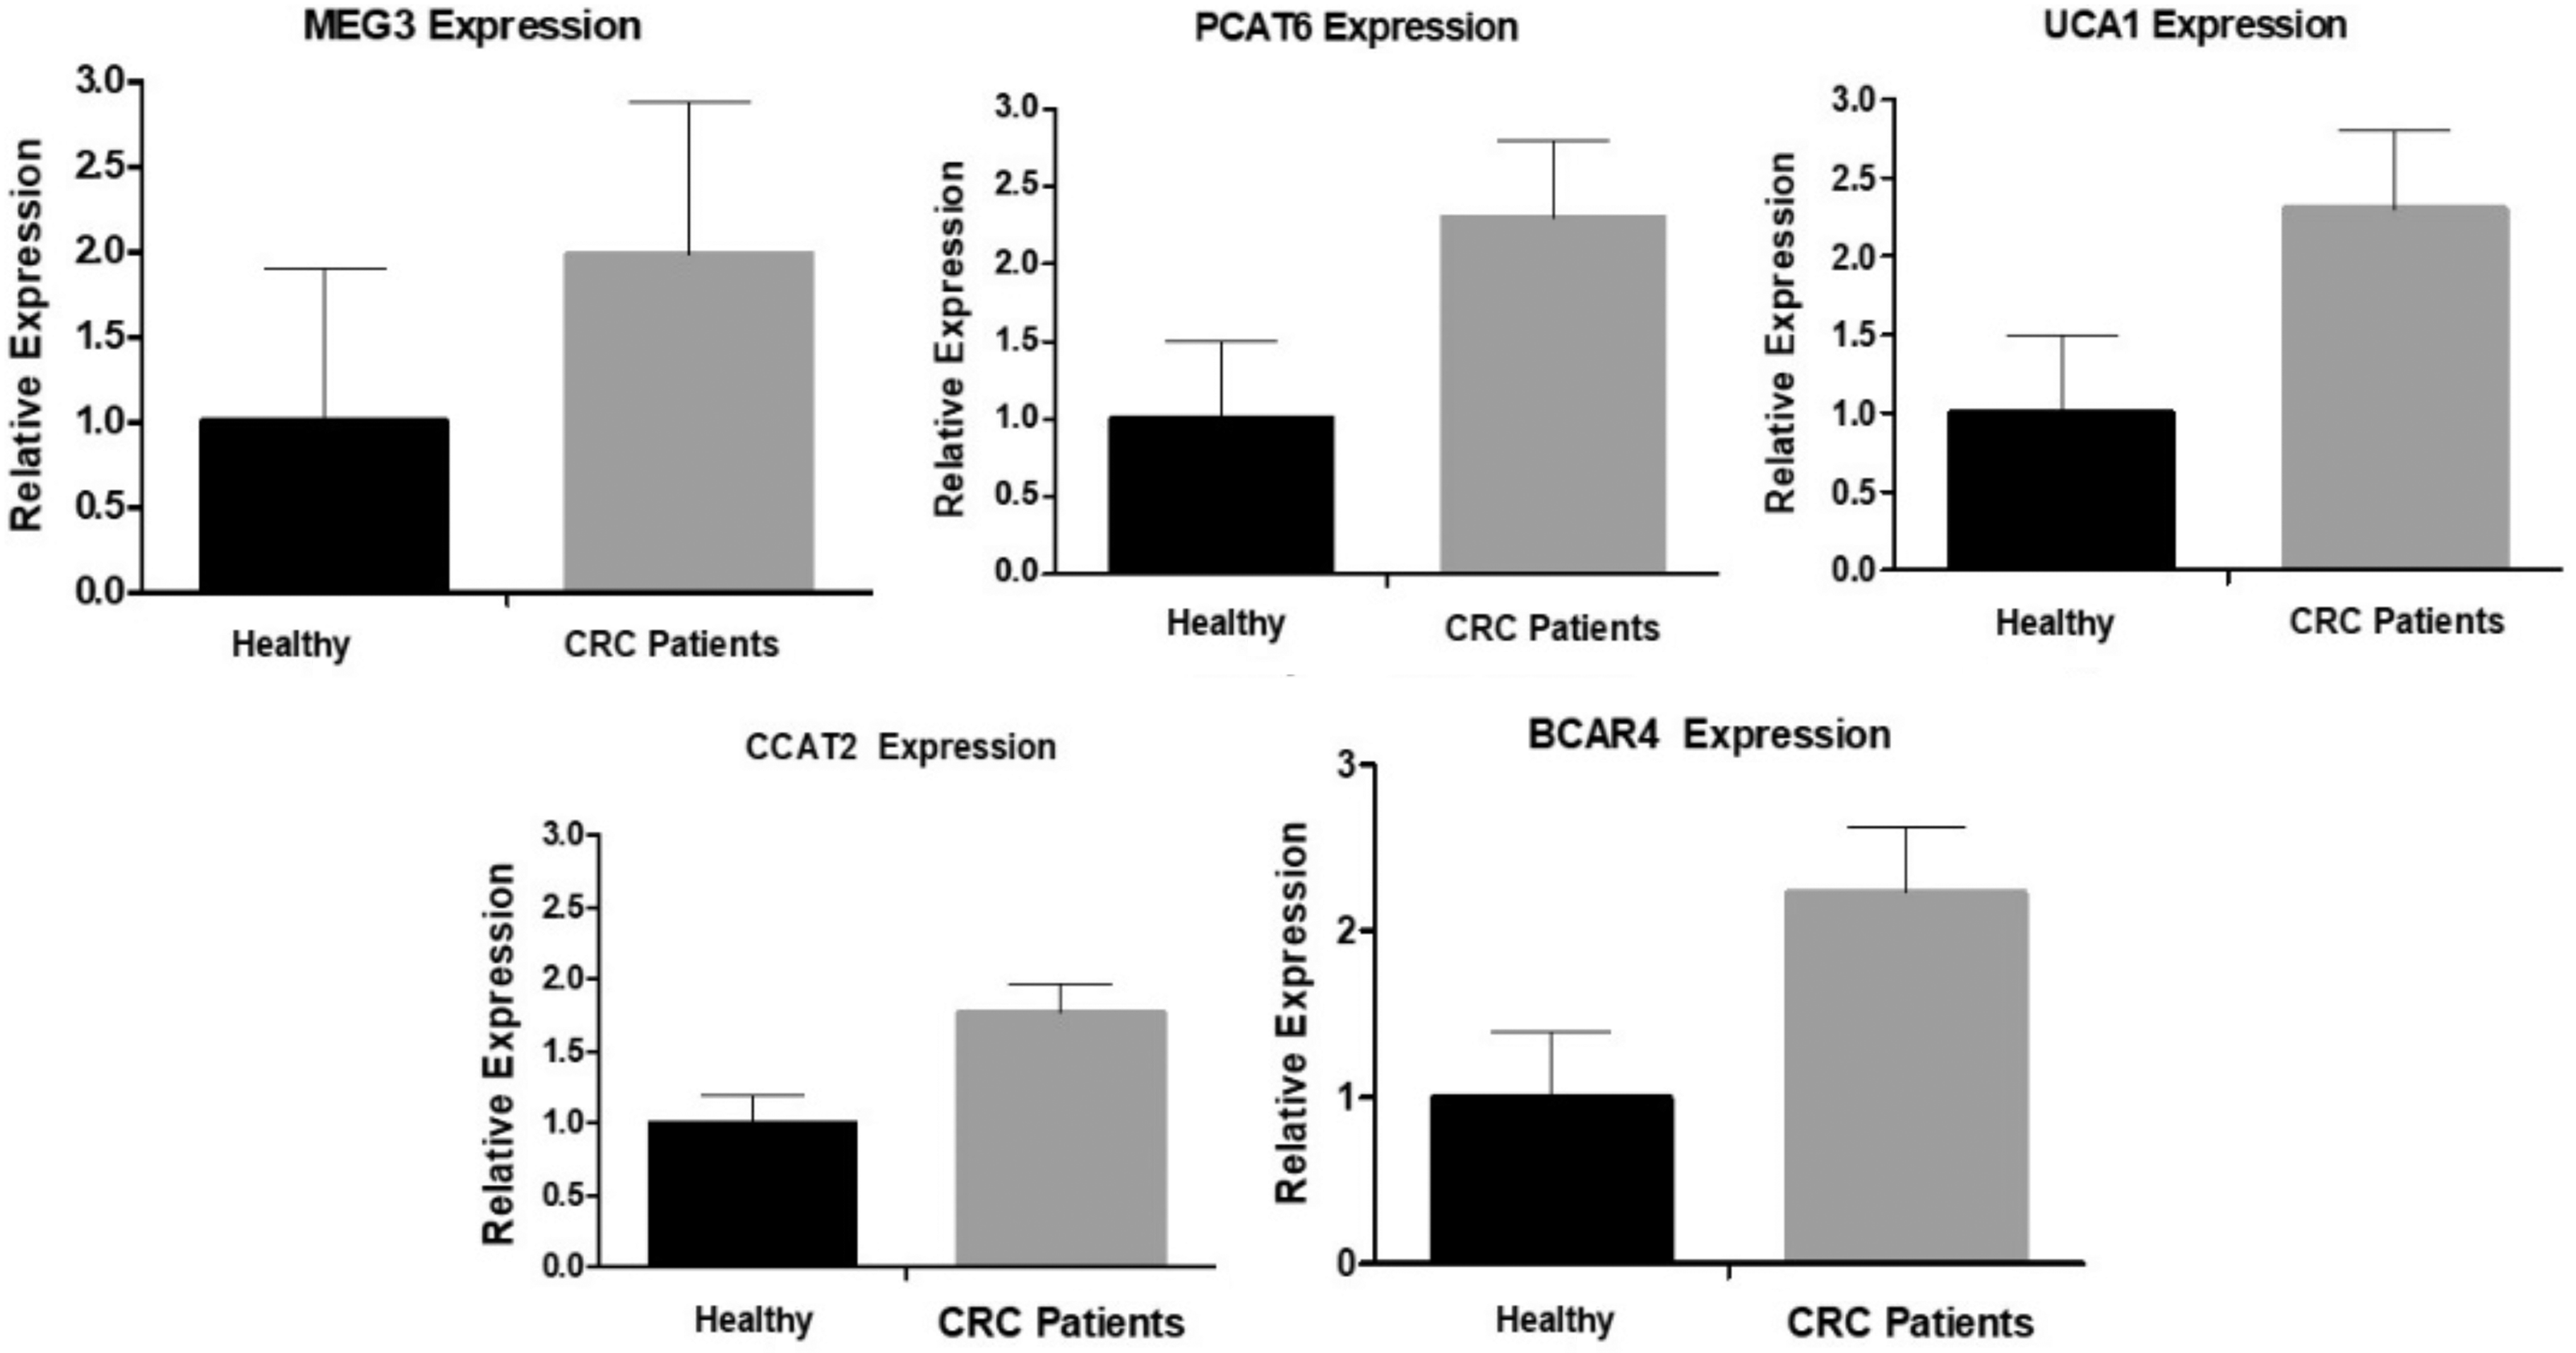
The expression of nonsignificant lncRNAs in CRC patients. RT-PCR was used to determine the expression level of lncRNAs in blood of CRC and healthy subjects. The comparison of the relative expression of lncRNAs in CRC patients on REST2009 showed that MEG3, PCAT6, UCA1, CCAT2, and BCAR4 were not significantly different when compared with the relative expression in healthy controls (p > 0.05).
Discussion
Recently, dysregulation of ncRNAs, more specifically lncRNAs, has been discovered in different human diseases such as cancer (Chen et al., 2017). They have been studied in tumor progression and initiation, based on their effects on cellular and molecular pathways (Xiong et al., 2017). CRC is one of the most common cancers in Saudi Arabia. In terms of occurrence, the incidence is more common in men than in women (Alsanea et al., 2015). Although advances in technology result in the development of novel less invasive and effective screening methods (Zhao et al., 2012), many CRC patients are still dying at late stages of cancer (Liu et al., 2016). Usually, molecular functions of lncRNAs are complex and occur at different levels during cancer developing stages, including the transcriptional, post-transcriptional, and epigenetic levels (Xu et al., 2014). Detection of these circulating lncRNAs in the blood of cancer patients could be used in distinguishing them very specifically and with high sensitivity from normal people at early stages (Bolha et al., 2017). Therefore, there is an immediate need to study the molecular pathways of CRC to develop effective biomarkers for prognosis and treatment at early stage of the disease. This study aimed to determine the expression level of selected oncogenic lncRNAs, including MEG3, PCAT6, UCA1, CCAT2, BCAR4, MALAT1, PANDAR, and CCAT1, in the blood samples of CRC and healthy subjects in Jeddah, Western region of Saudi Arabia. This study revealed that there was no significant expression of MEG3, PCAT6, UCA1, CCAT2, and BCAR4 in CRC blood samples when compared with control blood samples. In contrast to our results, recent studies illustrated abnormal expression of MEG3 in many cancers. According to Fang and Fullwood (2016), MEG3 causes progression and development of CRC and regulates cell proliferation in the tissues of CRC patients. Moreover, PCAT6 was found to be upregulated in prostate and lung cancer tissues. PCAT6 was also negatively correlated with the survival of lung cancer patients and correlated positively with their metastasis (Gao et al., 2016). Regarding to UCA1, Han et al. (2014) showed that it was highly upregulated in CRC cells and tissues, and associated with poor prognosis of cancer patients. CCAT2 is highly expressed in CRC tissues as well as in gastric, breast, and lung carcinoma tissues (Ding et al., 2015). Regarding the expression of BCAR4, it was reported that this lncRNA can cause advanced breast cancer as it has metastatic role in breast cancer (Xing et al., 2014).
Interestingly, the results of this study also showed that MALAT1, PANDAR, and CCAT1 were significantly upregulated in the blood of CRC patients compared with healthy subjects. Regarding MALAT1, the result was in agreement with another study done on CRC tissues (Zheng et al., 2014). Zheng and his team found that MALAT1 was significantly expressed in CRC tissues and its higher levels serve as a negative prognostic marker in stages II and III of cancer patients. Moreover, Yang et al. (2015) reported that MALAT1 was overexpressed in CRC tissues with lymph node metastasis. Conversely, knockdown of MALAT1 cause inhibition of CRC growth and metastasis. Hu et al. (2016) demonstrated that MALAT1 enhances AKAP-9 expression by promoting the expression of SRPK1 and phosphorylating SRSF1 in CRC cells. Furthermore, Hu et al. (2016) and Zhou et al. (2016) suggested that MALAT1 might contribute to the development of ovarian cancer and it has role in the growth and migration of ovarian cancer cells.
Studies performed on the new member of lncRNAs, PANDAR, which is localized on chromosome 6, revealed that the upregulation of PANDAR inhibits the activation of proapoptotic genes FAS, NOXA, and PUMA through transcriptional factor NF-YA (Chen et al., 2017). Sang et al. (2016) reported a significant upregulation of PANDAR in breast cancer cells, which functions as a regulator for breast cancer cell cycle through suppressing G1/S transition of breast cancer cells. Furthermore, a study done by Zhan et al. (2016) demonstrated a novel involvement of PANDAR in bladder cancer. According to them, PANDAR was upregulated in bladder cancer tissues and its overexpression may promote proliferation and suppress apoptosis of the bladder cancer cells. In addition, Peng and Fan (2015) showed high expression of PANDAR in hepatocellular carcinoma tissues and its overexpression was correlated with HBsAg and alpha fetoprotein (AFP) levels, liver cirrhosis, tumor nodule, TNM staging, and vascular invasion. Moreover, they also reported that knockdown of PANDAR can repress cell proliferation, cycle progression, and colony formation.
In addition, this study showed that CCAT1 was significantly upregulated in CRC patients compared with the controls. CCAT1 was identified initially in colon cancer. Recently, it was found to be upregulated in hepatocellular and gastric cancer tissues compared with normal tissues (Chen et al., 2017). CCAT1 could be activated by Myc and few oncogenic miRNAs such as miRNA-115 and miRNA-218-5p (Ma et al., 2015). Recent studies suggested that CCAT1 was highly expressed in various cancers as Cao et al. (2017) reported that the upregulation of CCAT1 in epithelial ovarian cancer tissues is associated with FIGO stage, lymph node metastasis, and historical grade. The results of this study are in agreement with Zhao et al. (2016), who demonstrated that high expression of CCAT1 in CRC plasma may be used as predictive biomarker for screening of CRC. Ma et al. (2015) studied the overexpression of CCAT1 in gallbladder cancer tissues and found that the knockdown of CCAT1 was associated with the invasion and proliferation of gallbladder cells through miRNA-218-5p.
In conclusion, as far as we are aware, this is the first report in Saudi Arabia that studied the effect of significant expression of oncogenic lncRNAs in the blood of CRC patients. The findings of this study suggest that the expression of MALAT1, CCAT1, and PANDAR in blood could serve as potential biomarker for CRC prognosis. However, there were a number of limitations in this study due to small number of subjects that also limited the statistical power in some comparisons. Therefore, more studies with larger cohort of subjects and with CRC tissue samples should be performed in the future for more confirmation of these findings.
Footnotes
Author Disclosure Statement
No competing financial interests exist.