




Abstract
Background:
Obesity and insulin resistance are common features accompanying polycystic ovary syndrome (PCOS).
Aim:
To analyze the impact of obesity on the expression of the visfatin and sterol regulatory element-binding protein (SREBP)-1c genes among a group of Egyptian women with PCOS, and to assess their suitability as PCOS biomarkers.
Subject and methods:
Seventy healthy women (control group) (35 nonobese and 35 obese) and 140 women with PCOS (70 nonobese and 70 obese) were enrolled in this study. The visfatin and SREBP-1c genes' expression analyses were performed via real-time polymerase chain reaction. Serum visfatin and SREBP-1c protein levels were measured with ELISA kits.
Results:
Among PCOS patients, upregulation of visfatin and SREBP-1c expression was observed. We did not identify significant differences between the obese and nonobese PCOS patients nor between obese and non-obese controls. The mRNA expression levels of both genes were significantly positively correlated with their serum protein levels, as well as with fasting serum insulin levels, homeostatic model assessments of insulin resistance (HOMA-IR), luteinizing hormone (LH) ratios, LH/follicular stimulating hormone ratios, total testosterone, and free androgens. We observed significant negative correlations between visfatin and SREBP-1c expression levels and sex hormone binding globulin levels in all studied groups. Receiver operating characteristic curve analyses revealed that combining the visfatin and SREBP-1c expression data increased the sensitivity (95.92%) and specificity (93.2%) for PCOS diagnoses.
Conclusion:
Upregulation of visfatin and SREBP-1c was observed among PCOS patients. These genes may play a role in the pathogenesis of PCOS independent of obesity. Combined visfatin and SREBP-1c analyses could be used as a noninvasive biomarker for PCOS.
Introduction
Polycystic ovary syndrome (PCOS) is a heterogeneous, heritable endocrinopathy disorder, affecting 4-8% of women during their reproductive period (Goodarzi et al., 2011). Environmental factors including toxins, geography, socioeconomic status, diet, and nutrition play an important role in the expression of PCOS genetic traits and may also trigger or exacerbate PCOS pathology (De Melo et al., 2015). PCOS is characterized by hyperandrogenism, chronic anovulation, and polycystic ovaries confirmed by ultrasonography (The Rotterdam ESHRE-ASRM-Sponsored PCOS Consensus Workshop, 2004). Patients with PCOS may present with infertility, obesity, amenorrhea, manifestations of hyperandrogenemia, and features of metabolic disturbances including dyslipidemia and insulin resistance (IR) (Haoula et al., 2012; Gottschau et al., 2015). Women with PCOS are prone to develop type II diabetes, arteriosclerosis, and coronary artery diseases (Dumesic et al., 2015).
The pathogenesis and the underlying mechanisms of PCOS are still unknown and it has various phenotypes comprising normal-weight and insulin-resistant or insulin-sensitive, obese and insulin-sensitive or insulin-resistant types (Lim et al., 2012).
Obesity occurs in about 20-70% of PCOS patients, however, IR may occur independent of obesity in 50-70% of PCOS (Dunaif et al., 1989). Previous investigations have addressed the possibility that IR and hyperinsulinemia may be central to the pathogenesis of PCOS (Holst et al., 1997). Moreover, PCOS is considered to be a low-grade chronic inflammatory state (Horton et al., 2002). IR may be induced by inflammatory cytokines through the direct or indirect action on insulin signaling postreceptor molecules in PCOS. Therefore, inflammation may play a key role in the pathogenesis of IR in PCOS (Shimomura et al., 1997).
It has been proposed that the molecules secreted by adipose tissue play a role in PCOS pathogenesis. Visfatin is one of the recently identified adipocytokine secreted from visceral fat cells that has been suggested to play a role in the development of IR and diabetes (Fukuhara et al., 2005).
Treatment with visfatin acutely reduced plasma glucose level. Moreover, higher plasma glucose levels were reported in mice with knocked out visfatin gene (Fukuhara et al., 2005). These results suggested that visfatin possesses insulin-like activity and might play a role in reducing IR by binding to insulin receptors. Furthermore, visfatin is considered a proinflammatory and immune modulating cytokine (Kralisch et al., 2005). These results suggest that visfatin might play a role in the pathophysiology of PCOS. Previously, visfatin was measured in PCOS at the serum protein level, however, the results were controversial (Filippatos et al., 2007; Panidis et al., 2008). The contradictory results regarding association between visfatin and obesity or PCOS were behind the integration of visfatin in our study.
The action of insulin is mediated by a family of transcription factors known as sterol regulatory element-binding proteins (SREBPs) that control the expression of genes concerned with fatty acids, cholesterol, and other lipids synthesis. These metabolites are important for the function of granulosa cell by providing the substrates required for developing oocyte and steroidogenesis after luteinization (Horton et al., 2002). SREBP has three isoforms designated SREBP-1a, SREBP-1c, and SREBP-2. SREBP-1, which is situated on chromosome 17p11.2, plays a role in both fatty acid biosynthesis and metabolism. SREBP-2 was found to be related to cholesterol regulation (Shimano, 2009).
There is evidence for the expression of SREBP-1c isoform from the granulosa cells of the ovary (Richardson et al., 2005). Shimomura et al. (1997) examined a wide range of tissues and recorded a 2.8-fold increase in SREBP-1c expression over SREBP-1a in the human ovary.
These results provide evidence for the functional role of SREBP-1c on the steroidogenic cells of the ovary through controlling fatty acid synthesis. Another mechanism has been proposed for regulation of steroidogenesis by SREBP, which is through sterol regulatory element sites located in the promoter region of the steroid acute regulatory protein gene (Lopez and McLean, 1999: Christenson et al., 2001).
High circulating insulin levels found in insulin-resistant conditions such as PCOS might cause upregulation of SREBP-1c expression with consequent change in the cellular function of the ovary (Richardson et al., 2005). Thus, we suggest a functional role of SREBP-1c in the pathophysiology of PCOS.
To our knowledge, no previous studies had analyzed SREBP-1c expression in the peripheral blood mononuclear cells (PBMCs) as a diagnostic biomarker for PCOS. Therefore, the aim of our research was to elucidate the impact of obesity on the expression profile of visfatin and SREBP-1c in women with PCOS and to correlate their expression with metabolic and biochemical parameters of such disease trying to explore the possibility of using them as noninvasive specific biomarkers for PCOS.
Materials and Methods
This study was carried out on patients who were chosen from the Outpatient Clinics of Obstetrics and Gynecology and from the Endocrinology Unit in Internal Medicine Departments at Zagazig University Hospitals. The sample size was calculated on 95% confidence intervals, and 80% power of the study, to be 70 control women [35 normal weight (nonobese) (body mass index [BMI] less than 25 kg/m2) and 35 obese or overweight (BMI more than 25 kg/m2)] and 140 PCOS (70 nonobese and 70 obese or overweight). Subjects were selected depending on the following criteria: nonsmokers or nonalcoholics, did not receive any medication within the preceding 3 months and did not receive oral contraceptive pills within the preceding 6 months.
Patients with the following disorders were excluded: galactorrhea, or any other disorder that has similar clinical symptoms (oligomenorrhea), hypertension, thyroid disorder, hyperprolactinemia, Cushing's syndrome, acromegaly, premature ovarian failure, adrenal virilism, ovarian tumors, or diabetes mellitus (fasting blood glucose >125 mg/d). The presence of at least two of the revised Rotterdam criteria confirmed PCOS diagnosis (The Rotterdam ESHRE-ASRM-Sponsored PCOS Consensus Workshop, 2004): oligomenorrhea (less than 6 cycles per year or menstrual cycles ≥45 days) or amenorrhea (more than 3 months), evidence of PCOS by ultrasonography (an ovarian volume of greater than 10 mL without a dominant follicle or an ovary with 12 follicles or more, with size ranging from 2 to 10 mm in a single plane) or any features of hyperandrogenism [hirsutism (Ferriman-Gallwey score more than eight) with or without acne], together with total testosterone level of more than 0.8 ng/mL. The healthy controls were characterized by having regular menstrual cycles and normal ovaries detected ultrasonographically. The cases were matched with the controls regarding both ethnicity and age. All subjects underwent thorough history taking and complete clinical assessment including waist/hip ratio (WHR) and BMI measurement.
Ethical consideration
This study was accepted by Ethics Committee of Zagazig University, Egypt. Before conducting the study, all subjects gave their informed consent after clarification of the study protocol.
Samples collection and analysis
Collection of blood samples from patients and controls was performed after an overnight fasting and during the first 3 to 5 days of the early follicular phase of the menstrual cycles. In case of amenorrhea, we collected samples independent of the cycle phase. Samples were subdivided into three aliquots: 3 mL of blood were placed into ethylenediaminetetraacetic acid (EDTA) containing tubes for isolation of PBMCs; 1 mL of blood was placed into fluoride containing tubes for estimation of fasting blood glucose. Serum was extracted from the remaining amount of blood and stored at −20°C till being used. Fasting blood glucose determination was done by glucose oxidase method (Spinreact, Ctra, Santa Coloma, Spain). Lipid profiles (triglycerides, total cholesterol, and high-density lipoprotein cholesterol [HDLc]) were estimated using enzymatic photometric methods (Spinreact, Spain) while low-density lipoprotein cholesterol (LDLc) was determined using Friedewald formula where LDLc = Total cholesterol - HDLc - (triglycerides/5) (Friedewald et al., 1972).
Serum estradiol, testosterone, follicular stimulating hormone (FSH), and luteinizing hormone (LH) concentrations were estimated using chemiluminescence enzyme immunoassay kits (CLIA, DIAGNOSTIC AUTOMATION, INC., Los Angeles, CA).
Enzyme-linked immunosorbent assay (ELISA) kits were used to detect the concentration of fasting serum insulin (Invitrogen, ThermoFischer Scientific; Catalog No. KAQ1251) and sex hormone binding globulin (SHBG) (ALPCO Immunoassays; Catalog No. 11-SHBHU-E01). IR was estimated using homeostasis model assessments of insulin resistance (HOMA-IR) index. For calculation of HOMA-IR, fasting plasma glucose (mg/dl) was multiplied by fasting serum insulin (mU/mL), then dividing the product by 405 according to Matthews et al. (1985). The free androgen index (FAI) was defined as the percentage of the ratio between serum testosterone (nM) and SHBG (nM) (Al Kindi et al., 2012).
Estimation of serum visfatin and SREBP-1c concentration
Estimation of serum visfatin levels was performed using Human visfatin ELISA kit according to manufacturer's manual (RayBio, Norcross, GA). Intra-Assay CV <10% and Inter-Assay CV <15%.
SREBP-1c serum levels were measured using Human sterol regulatory element binding protein 1 ELISA Kit according to manufacturer's guidlines (Biosource, San Jose, CA). Intra-assay CV <8% and Inter-assay CV <10%.
Peripheral blood mononuclear cells isolation
Peripheral blood mononuclear cells were separated from blood samples and collected in tubes containing EDTA. An equivalent volume of salt solution was used to dilute the blood samples, which were later layered onto Ficoll-Hypaque (Sigma-Aldrich, St. Louis, MO). Later on we performed density-gradient centrifugation for 30 min at 400 g, followed by removal of the plasma supernatant and isolation of PBMC.
Isolation of the RNA and reverse transcription
Total RNA isolation from PBMCs was achieved using TRIzol reagent (Invitrogen Life Technologies). Reverse transcription of total RNA was accomplished using the Superscript® III reverse transcription kit (Invitrogen) following the guidelines of the manufacturers.
Visfatin and SREBP-1c mRNA expressions analysis
For real-time polymerase chain reaction (PCR) analysis, the QuantiTect SYBR Green Master Mix (Qiagen/SABiosciences) was used according to the manufacturer's protocol on the Roche Light Cycler Real-Time PCR System. Relative quantification was achieved using GAPDH as internal control. The used primers were as follows: for visfatin (Seow et al., 2011): forward, 5′-AAGAGACTGCTGGCATAGGA-3′ and reverse, 5′-ACCACAGATACAGGCACTGA-3′; for SREBP-1c (Skarits et al., 2003): forward, 5′-CGGAGCCATGGATTGCACTTTC-3′ and reverse, 5′-GATGCTCAGTGGCACTGACTCTTC-3′; for GAPDH: forward, 5′-AGGTCGGAGTCAACGGATTTGG-3′ and reverse, 5′-ACAGTCTTCTGGGTGGCAGTGATG-3′. For real-time PCR, 20 μL reaction volume was performed using 10 μL 1 × QuantiTect SYBR Green PCR Master mix, 5 μL template cDNA, 0.5 μL of each primer, and finally 4.5 μL double distilled water. The amplification was performed using initial activation at 95°C for 15 min, then 40 cycles: at 94°C for 15 s (denaturation), at 55°C for 30 s (primer annealing), and finally primer extension at 70°C for 30 s. The expression of data was performed using the delta Ct method where ΔCt = Ct of target gene −Ct of GAPDH.
Statistical analysis
The analysis was performed using SPSS 17 software (SPSS, Chicago, IL).
Quantitative data with parametric distribution were analyzed using Student's t-test to compare between two groups, and two-way analysis of variance test followed by post hoc analysis using least-significant difference to compare between three groups. Quantitative data with nonparametric distribution were analyzed using Mann-Whitney U test to compare between two groups, and Kruskal-Wallis test was used for comparison between three groups. Pearson's correlation coefficient® was used to analyze the association between two continuous variables. p-Value less than 0.05 meant statistically significant value. Receiver operating characteristic curve was used to assess the best cutoff point with its sensitivity, specificity, positive predictive value, negative predictive value, and area under the curve (AUC) and it was done by using Medcalc (version 15.80).
Results
Clinical and biochemical characteristics of the study groups
A summary of the clinical and biochemical characteristics of the study participants was listed in Table 1. PCOS patients exhibited significantly higher levels of fasting serum insulin, HOMA-IR, LH, LH/FSH, total testosterone, and FAI when compared with controls. In contrast, levels of FSH and SHBG were significantly lower in PCOS group when compared with the control group. When stratifying the PCOS and the controls into nonobese and obese (Table 2), the obese PCOS and obese controls had a higher BMI, WHR, fasting serum insulin, HOMA-IR, total cholesterol, triglycerides, and LDL in comparison to their respective nonobese PCOS and nonobese controls. The obese PCOS and obese controls had lower levels of HDL and SHBG when compared with their respective nonobese PCOS and nonobese controls.
Clinical and Laboratory Characteristics of the Study Groups
p-Value <0.05: Significant.
t-Test; **Mann-Whitney test.
BMI, body mass index; FAI, free androgen index; FSH, follicular stimulating hormone; HDLc, high-density lipoprotein cholesterol; HOMA-IR, homeostasis model assessments of insulin resistance; IQR, interquartile range; LDLc, low-density lipoprotein cholesterol; LH, luteinizing hormone; PCOS, polycystic ovary syndrome; SD, standard deviation; SHBG, sex hormone binding globulin; SREBP, sterol regulatory element-binding protein; WHR, waist/hip ratio.
Clinical and Laboratory Characteristics in the Healthy Controls and PCOS Groups when Stratified into Obese and Nonobese
p-Value >0.05: Nonsignificant (NS); p-value <0.05: Significant (S); p-value <0.01: highly significant (HS).
In each row followed by a different lower-case-letter are significantly different by Fisher's LSD test at p ≤ 0.05.
ANOVA, analysis of variance; LSD, least-significant difference.
Gene expression analysis among different groups
Visfatin and SREBP-1c mRNA expression levels in PBMCs were significantly higher in the PCOS group (1.36 ± 0.27, 0.72 ± 0.12 respectively) when compared with the control group (0.45 ± 0.08, 0.52 ± 0.04 respectively; p < 0.001 for each) (Table 1).
In the subgroup analysis (Table 2), visfatin and SREBP-1c mRNA expression levels reported nonstatistically significant difference between obese PCOS and nonobese PCOS patients. Moreover, a nonstatistically significant difference was observed between obese control and nonobese controls (p > 0.05).
Visfatin and SREBP-1c mRNA expressions were significantly higher in the obese PCOS or nonobese PCOS when compared with obese controls or nonobese controls (p < 0.001 for each).
Serum visfatin and SREBP-1c levels among the studied groups
Serum visfatin and SREBP-1c levels among PCOS and controls were presented in Table 1 and Figure 1. PCOS patients had significantly higher serum visfatin levels compared to healthy controls (p < 0.001; Fig. 1a). PCOS patients had significantly higher serum SREBP-1c levels compared with healthy controls (p < 0.001; Fig. 1b).
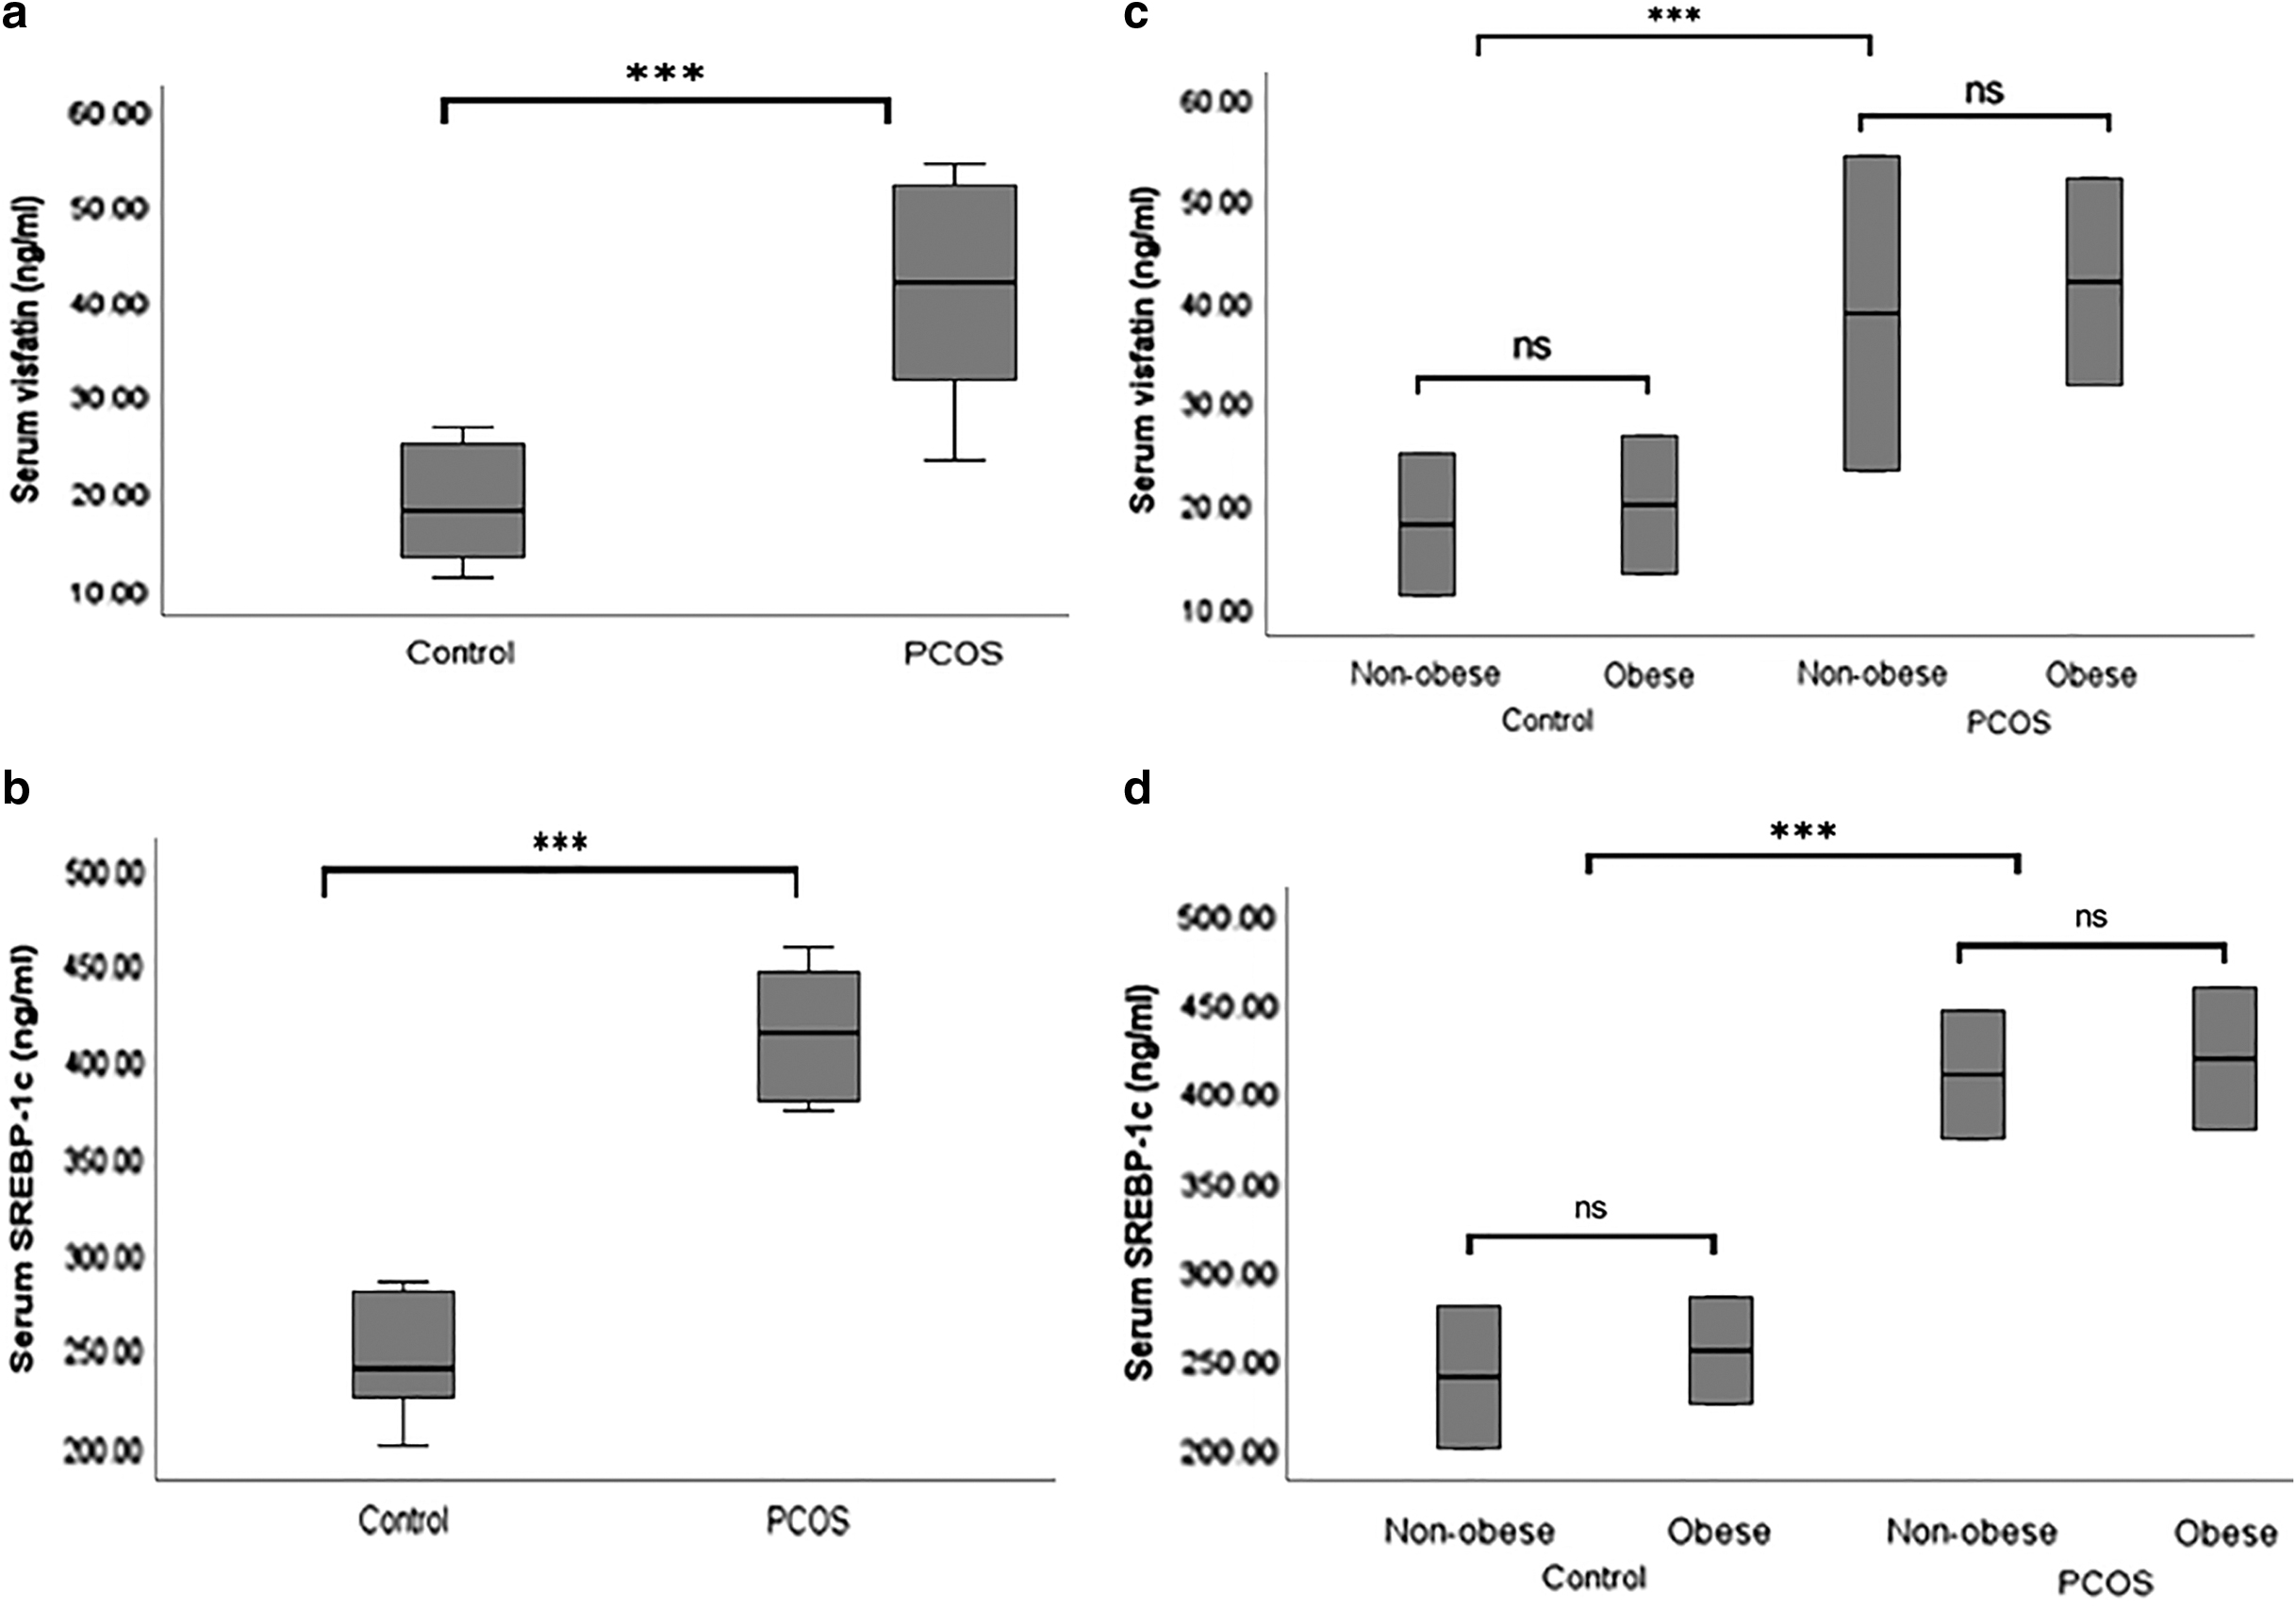
Serum visfatin and SREBP-1c levels among studied groups.
In the subgroup analysis (Table 2 and Fig. 1), for serum visfatin (Fig. 1c), nonstatistically significant difference was observed between obese PCOS patients and nonobese PCOS (p > 0.05). Among the control group, nonstatistically significant difference was reported for between the obese controls and nonobese controls (p > 0.05).
Regarding SREBP-1c (Fig. 1d), nonstatistically significant difference was observed between obese PCOS patients and nonobese PCOS (p > 0.05). Moreover, nonstatistically significant difference was reported between the obese controls and nonobese controls (p > 0.05). Serum visfatin and SREBP-1c levels were significantly higher in the obese PCOS or nonobese PCOS when compared with obese controls or nonobese controls (p < 0.001 for each).
Correlation of gene expression with clinical and laboratory variables
The correlation between visfatin and SREBP-1c and other clinical and laboratory indices in the whole study groups was presented in Table 3.
The Correlation Between Visfatin mRNA Expression or SREBP-1c mRNA Expression with the Clinical and Laboratory Variables in the Whole Study Groups (n = 210)
In all studied groups, both visfatin and SREBP-1c mRNA expression levels significantly correlated positively with fasting serum insulin, HOMA-IR, LH, LH/FSH, total testosterone, and FAI. Moreover, SREBP-1c mRNA expression significantly correlated positively with triglycerides. On the other hand, both visfatin and SREBP-1c mRNA expression levels significantly correlated negatively with SHBG. There was a significant positive correlation between visfatin and SREBP-1c mRNA expressions and their serum protein levels.
In the subgroup analysis (Table 4), both visfatin and SREBP-1c mRNA expression significantly positively correlated with fasting serum insulin, HOMA IR, total testosterone, FAI, and their serum protein levels in the nonobese PCOS, not in the obese PCOS. SREBP-1c significantly correlated positively with triglycerides among obese PCOS (r = 0.460, p < 0.001) and obese controls (r = 0.53, p < 0.001). Nonstatistically significant correlation was observed between visfatin and SREBP-1c with other variables among obese controls or nonobese controls (data not shown).
The Correlation Between Visfatin mRNA Expression and SREBP-1c mRNA Expression with the Clinical and Laboratory Variables in Obese and Nonobese Subgroups Among PCOS Patients
Highly significant differences at p < 0.01.
The ability of visfatin and SREBP-1c to diagnose PCOS
The ability of visfatin and SREBP-1c to diagnose PCOS was presented in Table 5 and Figure 2. Visfatin could diagnose PCOS with 86.4% sensitivity, 88.4% specificity, 85.43% diagnostic accuracy, and 0.890 AUC (Fig. 2a). SREBP-1c showed 80.7% sensitivity, 80.88% specificity, 89.7% diagnostic accuracy, and 0.897 AUC for the diagnosis of PCOS (Fig. 2b). Interestingly, combined visfatin and SREBP-1c showed 95.92% sensitivity, 93.2% specificity, 90.43% diagnostic accuracy, and 0.921 AUC for the diagnosis of PCOS (Fig. 2c).

The Ability of Visfatin and SREBP-1c mRNA Expressions to Discriminate Control and PCOS
AUC, area under the curve; PPV, positive predictive value; NPV, negative predictive value.
Discussion
IR, obesity, and disturbed lipid metabolism are considered the most common characteristics of PCOS (Kern et al., 2001). Therefore, we analyzed the expression of two key genes involved in the regulation of metabolism (visfatin and SREBP-1c) in a sample of Egyptian population with PCOS. In the present study, we demonstrated higher visfatin mRNA expression and serum protein levels in PCOS compared with controls. However, nonstatistically significant difference was observed between obese PCOS or obese controls with their respective nonobese PCOS or nonobese controls. Several studies suggested a significant positive correlation between plasma visfatin and its visceral mRNA expression (Berndt et al., 2005). However, we are the first to correlate PBMCs mRNA expression of visfatin and its serum protein level. Once analyzing the correlation, a significant positive correlation was observed between visfatin mRNA expression with its serum protein levels and markers of IR and hyperandrogenism in the nonobese PCOS but not in the obese PCOS patients. These results implicated that visfatin might play a role in the pathogenesis of PCOS independent of obesity. Currently, the precise explanation of increased visfatin levels in PCOS is still unknown. However, from these results we suggest that elevated visfatin might occur as a compensatory mechanism for diminished insulin sensitivity in these patients.
Similar to our results, Kowalska et al. (2007) demonstrated higher serum visfatin level in the lean PCOS women. They also reported a significant correlation with insulin sensitivity, serum testosterone, and FAI in the lean group but not in the obese group. Moreover, Guducu et al. (2012) supported our finding by reporting nonstatistically significant difference in visfatin serum levels between obese and nonobese PCOS patients.
Seow et al. (2011) reported higher visfatin mRNA expression in PBMCs and omental fat in PCOS patients compared with controls. However, they found nonsignificant correlation between visfatin and BMI. They attributed these findings to insufficient sample size that might negatively affect the statistical power (Seow et al., 2011).
Interestingly, Tan et al. (2006) revealed increased visfatin expression in adipose tissue and elevated plasma visfatin in PCOS women.
Abd ElBaki and Abd E L Moneim, (2010) demonstrated higher serum visfatin levels among PCOS patients than controls and they revealed a more significant increase in the lean PCOS than the obese PCOS subgroup.
Gümüş et al. (2015) had done a study to evaluate the plasma visfatin levels in hirsute female patients with PCOS. They found significant increase in visfatin levels in hirsute women than in non-hirsute PCOS adolescents. Thus, they concluded that plasma visfatin level could be diagnostic in PCOS in hirsute adolescents.
Also Nourbakhsh et al. (2015) revealed that visfatin was elevated in obese children and adolescents and it was associated with IR.
Sun et al. (2015) found that visfatin levels were higher in PCOS compared with controls. However, they reported that increased visfatin expression in PCOS does not correlate with HOMA-IR, BMI, or total testosterone level. They also concluded that circulating visfatin could be used as noninvasive specific biomarker for PCOS.
By the contrary, some previous studies could not find a difference either in serum or plasma visfatin levels between PCOS patients and the controls (Olszanecka-Glinianowicz et al., 2012; Farshchian et al., 2014).
Moreover, Zwirska-Korczala et al. (2008) could not find a difference in visfatin levels between nonobese PCOS patients and nonobese controls.
Lajunen et al. (2012) revealed no association between circulating visfatin levels and PCOS, obesity, or metabolic markers. They concluded that visfatin might have a role as a proinflammatory cytokine only.
Fukuhara et al. (2005) tried to explain the relation between visfatin and androgens. They reported that hyperinsulinemia contributes to the pathogenesis of PCOS by stimulating ovarian androgen secretion, thus the insulin-like activity of visfatin might be responsible for the hyperandrogenism observed.
Previously, Kern et al. (2001) revealed that visfatin could stimulate proinflammatory activity by stimulating TNF-a and IL-6 secretion, thus increasing IR in PCOS.
Up till now, there is no available data about the expression pattern of SREBP-1c in PBMCs of PCOS patients. Our results demonstrated for the first time that SREBP-1c mRNA expression and serum levels were significantly elevated in PCOS compared to controls. Moreover, there was nonstatistically significant difference in SREBP-1c expression between obese PCOS or obese controls with their respective nonobese PCOS or nonobese controls. SREBP-1c correlated with its serum protein levels and markers of IR and hyperandrogenism in the nonobese PCOS subgroup. Thus circulating serum visfatin and SREBP-1c levels may reflect the events occurring at the PBMCs levels. Moreover, these finding suggest that SREBP-1c might play a role in the pathogenesis of PCOS independent of obesity.
The most interesting and novel finding of this study is to know that combined analysis of visfatin and SREBP-1c mRNA expression could diagnose PCOS with high sensitivity and specificity at a cutoff value of >0.98. Therefore, combined assay of visfatin and SREBP-1c might be useful as specific noninvasive biomarkers for PCOS, a finding that has not been proven previously.
In line with our results, Wang et al. (2018) performed their study on rats and revealed that, SREBP-1 and TLR4 expression levels were significantly elevated in PCOS group in comparison with controls. They indicated that the SREBP-1/TLR4 pathway played an important role in PCOS development through a proinflammatory effect.
Tahira et al. (2011) found SREBP-1 to be upregulated in PBMCs in the obese subjects with circadian rhythm pattern of expression.
Interestingly, Shafiee et al. (2017) demonstrated that SREBP-1 gene expression was significantly elevated in the endometrium of PCOS patients compared with controls.
Richardson et al. (2005) reported increased expression of SREBP-1c in the granulosa cells of PCOS. Secretion of SREBP-1c in the granulosa cells of human occurs as a result of insulin action and gonadotropin. The increase in the serum insulin as a result of IR in PCOS causes specific increase in the expression of SREBP-1c that causes overproduction of fatty acids and their metabolites leading to change in the cellular function of the ovary with the development of PCOS (Richardson et al., 2005). This finding has also been confirmed by Horton et al. (2002) who observed a parallel effect of insulin on SREBP-1c expression. Therefore, we suppose that the insulin mimic action of visfatin might be responsible for the observed positive correlation between visfatin and SREBP-1c.
Shimomura et al. (1997) reported high SREBP-1c expression in steroidogenic tissues of the human ovary. They explained the predominance of the SREBP-1c isoform in steroidogenic tissues by increased levels of human chorionic gonadotropin, which is known to increase steroidogenesis, has the effect of increasing SREBP-1c expression.
Against our results, Knebel et al. (2012) performed a cohort including 153 patients complaining of PCOS aiming to study various phenotypes of PCOS. They did not find any association between genetic variations of SREBP-1 and PCOS.
Furthermore, Shimomura et al. (2000) revealed no alteration in the expression of SREBP-1c in the liver of the mouse with high insulin-resistance despite the presence of intense resistance to insulin regarding other functions in the same tissue.
Sewter et al. (2002) revealed reduced expression of SREBP-1c in the skeletal muscles of diabetic patients type 2 while its level in the obese patients was not reduced. They explained their finding by demonstrating that IR is greater in type 2 diabetes than obesity. Moreover, various tissues show quantitative differences in their sensitivity to the influence of IR on the expression of SREBP1.
In conclusion, we revealed for the first time increased PBMCs mRNA expression of visfatin and SREBP-1c in women with PCOS and this is translated at the serum protein level. The positive correlation between visfatin and SREBP-1c with markers of hyperandrogenism and IR in the nonobese PCOS women may indicate a role for visfatin and SREBP-1c in the pathogenesis of PCOS independent of obesity. Interestingly, we suggest combined assay of visfatin and SREBP-1c as noninvasive specific biomarkers for PCOS.
Finally, larger population studies are required to elucidate the fundamental roles of visfatin and SREBP-1c expressions in the development of PCOS.
Footnotes
Acknowledgments
We thank the Biochemistry Department and patients. This research has no sponsors.
Author Disclosure Statement
No competing financial interests exist.
Funding Information
No financial support was recieved for this research.