




Abstract
Aims:
Tacrolimus has extensive pharmacokinetic variability among patients and a narrow therapeutic window. The U.S. Clinical Pharmacogenetics Implementation Consortium recommends a starting dose for tacrolimus of 0.15-0.3 mg/kg/day, which is much higher compared with 0.05-0.15 mg/kg/day used in China. The purpose of this study was to investigate the influence of clinical factors and single nucleotide polymorphisms (SNPs) on tacrolimus concentrations in Chinese renal transplant recipients.
Methods:
This study enrolled 406 tacrolimus-treated patients. After renal transplantation, the first tacrolimus trough concentration and corresponding clinical information were collected from all patients. Matrix-assisted laser desorption/ionization time-of-flight mass spectrometry was used to genotype 15 SNPs. The relationship between the genetic and clinical factors and dose-adjusted tacrolimus trough concentration was examined. The tacrolimus starting dose was predicted using a classification and regression tree analysis.
Results:
Examination of the 15 SNPs and several clinical factors identified the CYP3A5 genotype (p = 5.6 × 10⁻¹¹) and hemoglobin (p = 8.4 × 10⁻¹⁰) as the most significant determinants of tacrolimus C0/D. Accordingly, a concise tacrolimus recommendation dosage model, a classification scheme, and a regression tree were developed.
Conclusion:
A new classification and regression tree model was developed for establishing the starting dose of tacrolimus based on the CYP3A5 genotype and hemoglobin values. This result may help clinicians prescribe an appropriate initial tacrolimus dose. ClinicalTrials.gov ID: 2020-KY-147.
Introduction
Tacrolimus, an effective immunosuppressive drug, is widely used to prevent acute and chronic rejection after solid organ and hematopoietic stem cell transplantation. However, it is characterized by highly variable pharmacokinetics and a narrow therapeutic index (Trull, 1998; Masuda and Inui, 2006). Over the past decades, several genetic factors affecting tacrolimus pharmacokinetics have been identified (Staatz and Tett, 2004; Staatz et al., 2010). Among these factors, CYP3A5 single nucleotide polymorphisms (SNPs) are expected to be the primary determinants of tacrolimus pharmacokinetics in vivo. Therefore, the U.S. Clinical Pharmacogenetics Implementation Consortium (CPIC) recommends that the starting dose of tacrolimus should vary according to the CYP3A5 genotype, with a starting dose of 0.15-0.3 mg·kg−1·day−1 (Birdwell et al., 2015), which is much higher than the starting dose (0.05-0.15 mg·kg−1·day−1) used in Chinese renal transplant recipients (Organ Transplantation Society of Chinese Medical Association, 2019). We aimed to identify factors that affect tacrolimus concentration in Chinese renal transplant recipients.
Besides the CYP3A5 polymorphism, other genetic polymorphisms could affect the pharmacokinetics of tacrolimus (Benkali et al., 2009; Jun et al., 2009; Ogasawara et al., 2013; Genvigir et al., 2016; Liu et al., 2017). Tacrolimus is extensively metabolized by cytochrome P450 (CYP) 3A4 and 3A5 in the liver and small intestine, and it is also subjected to cellular efflux by P-glycoprotein (P-gp), which is encoded by the multidrug resistance (MDR) 1/ABCB1 gene (Jun et al., 2009; Genvigir et al., 2016). In the small intestine, MDR-associated protein 2 (MRP2), which is encoded by the ABCC2 gene, as well as P-gp, play an important role in the efflux of xenobiotics (Ogasawara et al., 2013). In addition, pregnane X receptor (PXR), encoded by the NR1I2 gene, regulates the expression of an array of genes involved in the metabolism of xenobiotics, including CYP3A and ABCB1 genes (Benkali et al., 2009; Liu et al., 2017). Therefore, the varying expression and bioactivity of CYP enzymes, P-gp, and PXR may be associated with individual differences in tacrolimus pharmacokinetics.
Compared to CYP3A5 polymorphisms, the information on associations between the pharmacokinetics of tacrolimus and polymorphisms in CYP3A4, ABCB1, ABCC2, and NR1I2 genes is inconsistent (Ogasawara et al., 2013; Zuo et al., 2013; Genvigir et al., 2016; Liu et al., 2017; Oetting et al., 2018), due to small sample size and interference of the CYP3A5 polymorphism.
Currently, there are some models that include this genetic variable and clinical variables in the model to predict tacrolimus dose (Thervet et al., 2010; Jonge et al., 2012; Golubovic et al., 2016; Tang et al., 2019). Among these models, some developed population pharmacokinetic models using professional software, which is difficult to master and operate for clinicians (Han et al., 2013; Bergmann et al., 2014; Zhu et al., 2018). On the basis of above considerations, in this study, 15 SNPs, including those of CYP3A5, CYP3A4, ABCB1, ABCC2, and NR1I2, and 24 clinical factors were investigated in 406 kidney transplant recipients. Accordingly, a simple classification and regression tree model to predict tacrolimus starting dose was also developed.
Methods
Patients and data collection
A retrospective analysis of recipients who received kidney allograft between January 2016 and September 2018 was performed. Clinical and demographic data were collected from the electronic medical records in the First Affiliated Hospital of Zhengzhou University, China. This study was approved by the Zhengzhou University Medical Research and Ethics Committee (2020-KY-147). The study data has been fully deidentified and confidential information of patients has been deleted, and consequently, the study was free informed consent. Demographic characteristics, drug administration history, and laboratory test results, including erythrocytes, hemoglobin, hematocrit, neutrophils, lymphocytes, alanine aminotransferase (ALT), aspartate aminotransferase (AST), urea nitrogen, serum creatinine (Scr), serum uric acid, serum proteins, serum albumin, total bilirubin (TBIL), direct bilirubin (DBIL), total bile acid, and glomerular filtration rates (GFRs) were obtained from the electronic medical records. Study exclusion criteria were as follows: age less than 18 years, liver and renal transplantation, and second renal transplantation.
In addition, diarrhea and voriconazole treatment can significantly influence tacrolimus concentration, but very few patients had diarrhea or voriconazole treatment after surgery. Therefore, both of them were excluded as well (Lemahieu et al., 2005; Vanhove, et al., 2017). According to the package insert, other drugs that may affect tacrolimus concentration, such as rifampicin, cyclosporin, erythromycin, and ritonavir, were not used in the clinic. The routine drugs, such as proton pump inhibitors and calcium channel blockers, are summarized in Table 1. Finally, a total of 406 patients were enrolled in this study. Each patient was subjected to tacrolimus therapeutic drug monitoring.
Patient Characteristics and Differences in Tacrolimus C0/D and Each Category Variable
Pearson correlation.
Mann-Whitney test.
ALT, alanine aminotransferase; AST, aspartate aminotransferase; DBIL, direct bilirubin; GFR, glomerular filtration rate; TBIL, total bilirubin.
Immunosuppressive regimen
The patients were treated with a combination of tacrolimus, mycophenolate mofetil, and steroids postoperatively. The first oral administration of tacrolimus was initiated within 24 h of transplantation. The initial dosage was calculated by the weight of the patient (0.05-0.15 mg·kg−1·day−1, twice a day) and subsequently adjusted according to the trough blood concentration. Tacrolimus dosage for individual depended on the medical teams. After 3-5 days of regular administration, predose tacrolimus blood samples were collected. The target tacrolimus trough blood concentration was between 8 and 12 ng·mL−1 within 1 month (Organ Transplantation Society of Chinese Medical Association, 2019). The standard steroid regimen was 10-15 mg·kg−1·day−1 (500-1000 mg) of methylprednisolone given intravenously following the surgery, while decreasing the dose each subsequent day to 500, 320, 160, 80, 40, and 20 mg. Enteric-coated mycophenolate sodium or mycophenolate mofetil was initiated at a dose of 720 mg or 1000 mg twice daily.
Therapeutic drug monitoring of tacrolimus
The predose concentration (C0) of tacrolimus in the blood was determined by using an enzyme multiplied immunoassay technique on the Viva-E® drug testing system (Siemens, Newark, DE). According to the manufacturer's instruction, the detection range of tacrolimus was 2.0-30.0 μg/L. The accepted interday/intraday precision and accuracy were less than 20%.
Genotyping analysis
Peripheral venous blood (2-3 mL) was collected and placed in an ethylenediaminetetraacetic acid (EDTA) anticoagulant tube. DNA was isolated using a DNA extraction kit according to the manufacturer's instructions (BioTeke Corporation). The optical density values were detected by the NanoDrop 2000 instrument and the quality of DNA was assessed by 1.25% agarose gel electrophoresis. DNA was transferred to a 96-well plate and stored at −20°C for future use. According to the SNP sequence information provided by NCBI, the primer design, polymerase chain reaction (PCR), and single-base extension primers were determined using Assay Designer 3.1 software. After PCR amplification, shrimp alkaline phosphatase enzyme digestion, a single-base elongation reaction, and resin purification were performed. Each sample was sequentially dotted on the SpectroCHIP chip. Matrix-assisted laser desorption/ionization time-of-flight mass spectrometry (MALDI-TOF MS) was performed and the final results were analyzed with MassARRAY Typer 4.0 software.
Statistical analysis
The dose-adjusted tacrolimus trough concentration (C0/D) is the ratio of tacrolimus trough concentration (C0) divided by the corresponding daily dose (D) expressed as ng·mL−1·mg−1·kg. The dose-weight ratio (D/W) is the daily dose (D) of reaching therapeutic window divided by the body weight (W) expressed as mg·kg−1. Statistical analyses were performed using SPSS 24.0 (SPSS, Inc., Chicago, IL). All results were expressed as the mean ± standard deviation. The Mann-Whitney test and Kruskal-Wallis test were used to analyze categorical variables and C0/D. The Pearson correlation was used to analyze the relationship between continuous variables and C0/D. The Hardy-Weinberg equilibrium was evaluated using the χ2 test. Haploview 4.2 software (Broad Institute, MA) was used to determine the linkage disequilibrium (LD) and haplotypes. The classification and regression tree method was used to split the samples into subgroups by p-value. p-Value <0.05 was considered statistically significant and was set as the segmentation criteria. The minimum number of cases for split nodes was set as 50.
Results
Patient characteristics
A total of 406 renal transplant recipients contributed to 406 plasma samples were included in this study. The ethnicity of all patients was Han Chinese. The demographics, clinical characteristics, and genotypic and tacrolimus trough concentrations distribution of all patients after 3 days of post-transplantation are listed in Table 1 and Figure 1.

The distribution of tacrolimus trough concentration (C0) from 406 patients.
Genotype
The allele frequencies of the 15 SNPs in patients were in accordance with Hardy-Weinberg equilibrium (Table 2). The LD analysis revealed that there was a high degree of LD between CYP3A5*3 and CYP3A5 31611 C > T (D′ = 1.0; r2 = 0.977), a moderate degree of LD between CYP3A5*3 and CYP3A4*1G (D′ = 0.804; r2 = 0.505), and a low degree of LD between CYP3A5*3 and CYP3A4 T > C (rs4646437; D′ = 0.821; r2 = 0.250).
Comparison of the Tacrolimus C0/D in the Different Groups Classified by Genetic Variant Genotypes
C0/D: trough concentration divided by daily dose.
SNP, single nucleotide polymorphism.
Because of the long collection time, blood samples from the 406 patients were divided into two batches for SNP detection. Fifteen SNPs, including ABCB1 3435 C > T (rs1045642), ABCB1 1236 C > T (rs1128503), CYP3A5 31611 C > T (rs15524), CYP3A4*1G (20230 G>A; rs2242480), CYP3A4*18B (857 T > C; rs28371759), CYP3A4 T > C (rs4646437), CYP3A5*3 (6986 A>G; rs776746), NR1I2-25385 C > T (rs3814055), NR1I2 11156 A>G (rs3814057), CYP2C19*2 (681 G>A; rs4244285), ABCC2 1549 G > A (rs1885301), ABCC2 1249 G > A (rs2273697), ABCC2 1019 A>G (rs2804402), ABCC2 3972 C > T (rs3740066), and ABCC2-24 C > T (rs717620), were detected in the first 232 patients. After analyzing the data, it was found that C0/D was correlated with CYP3A5 31611 C > T, CYP3A4*1G, CYP3A4 T > C (p < 0.05), and CYP3A5*3. The estimation of the haplotypes in genes with multiple SNPs (CYP3A5, CYP3A4, and ABCB1) resulted in a haplotype for CYP3A5 rs15524-rs77674 (Supplementary Fig. S1). Since these three SNPs had LD with CYP3A5*3, only the CYP3A5*3 genotype was detected for the 174 patients in the second batch.
Effect of genotypes on the C0/D of tacrolimus
Of the 15 variants, CYP3A5*3 (p = 5.6 × 10⁻¹¹), CYP3A5 31611 C > T (p = 1.0 × 10⁻⁶), CYP3A4*1G (p = 0.001), and CYP3A4 T > C (rs4646437; p = 0.002) showed a significant association with tacrolimus C0/D (Table 2). The tacrolimus C0/D was higher among patients with CYP3A5 *3/*3 genotype (127.95 ± 42.62 ng·mL−1·mg−1·kg) than in those with CYP3A5 *1/*3 (103.23 ± 32.27 ng·mL−1·mg−1·kg) or CYP3A5 *1/*1 (88.32 ± 29.49 ng·mL−1·mg−1·kg) genotypes (Fig. 2). Further analysis found that 68.75% (66 out of 96) of patients with CYP3A5 expressers (*1/*1 and *1/*3) had tacrolimus C0 < 8 ng·mL−1, and 64.23% (88 out of 137) of patients with CYP3A5 nonexpressers (*1/*1) had tacrolimus C0 > 12 ng·mL−1. In addition, CYP3A5 combined genotypes also showed a significant association with tacrolimus C0/D (p = 2.5 × 10⁻¹¹; Table 3). No significant differences were found in tacrolimus C0/D between other 11 variants.
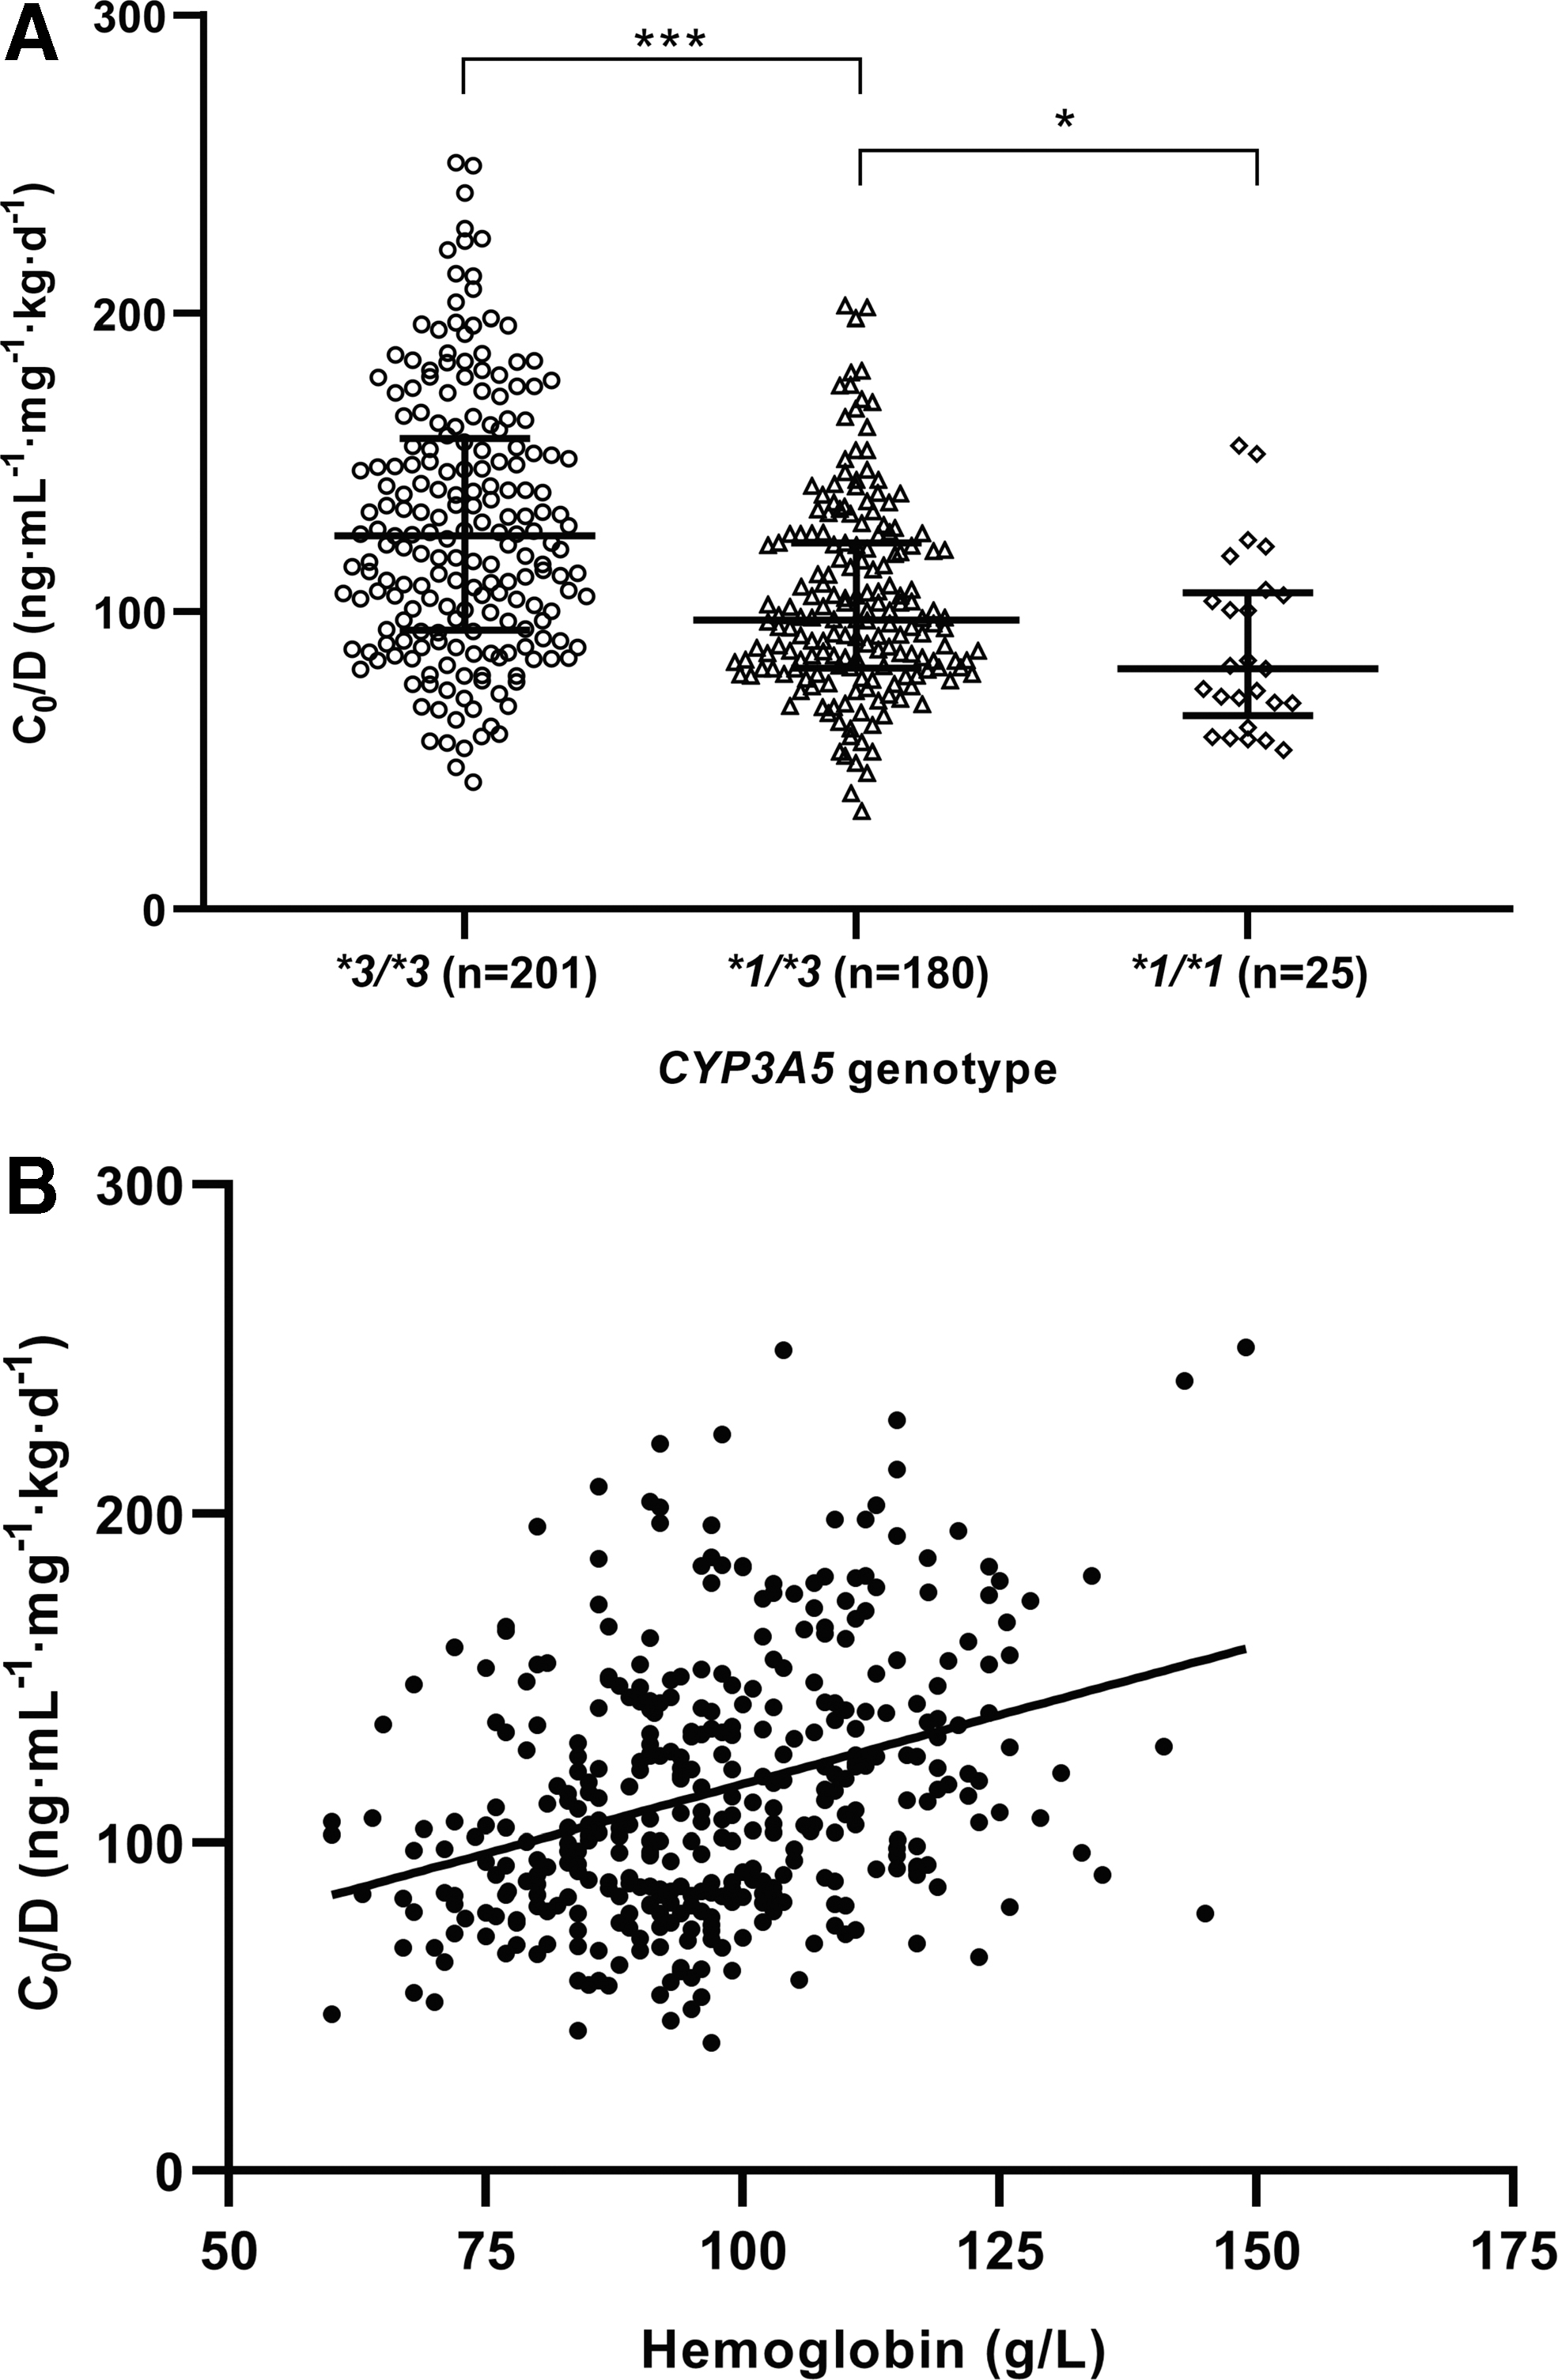
The relationship between tacrolimus C0/D and CYP3A5 genotypes (p = 5.6 × 10⁻¹¹) and hemoglobin values (p = 8.4 × 10⁻¹⁰).
Association Between CYP3A5 Combined Genotypes and Tacrolimus C0/D
C0/D: trough concentration divided by daily dose.
In addition, stratified analysis was used to investigate the effect of the other 14 genotypic variants on tacrolimus C0/D among the CYP3A5 expressers and nonexpressers (Table 2). After eliminating the effects of CYP3A5*3 variants, only CYP3A5 31611 C > T in the CYP3A5 expresser group showed a significant effect on tacrolimus C0/D (p = 0.0003).
Effect of clinical factors on the C0/D of tacrolimus
As shown in Table 1 and Figure 2, the C0/D of tacrolimus had a significant positive correlation with age (r = 0.115, p = 0.020), erythrocytes (r = 0.211, p = 1.7 × 10⁻⁵), hemoglobin (r = 0.299, p = 8.4 × 10⁻¹⁰), neutrophils (r = 0.245, p = 5.7 × 10⁻⁷), hematocrit (r = 0.246, p = 5.4 × 10⁻⁷), and GFR (r = 0.137, p = 0.006) and a significant negative correlation with urea nitrogen (r = −0.107, p = 0.032) and Scr (r = −0.142, p = 0.004). There was no significant correlation between tacrolimus C0/D and gender, hepatitis, donor source, steroid dose, omeprazole or pantoprazole use, calcium channel blocker use, lymphocytes, urea nitrogen, serum uric acid, serum proteins, serum albumin, TBIL, DBIL, total bile acid, ALT, and AST.
A classification and regression tree analysis for the D/W of tacrolimus
Among these patients, 173 reached target tacrolimus trough concentrations for the first time (Fig. 1), and 233 reached the therapeutic window within 6 days after the first tacrolimus trough concentration test. To make the results of clinical significance, the relationship between influencing factors and tacrolimus D/W when reaching the therapeutic window was further analyzed by classification and regression tree analysis. As a result, the final tree structure was divided into seven nodes by CYP3A5 genotype and hemoglobin values (Fig. 3). First, patients were divided into two nodes based on the CYP3A5 genotype. The mean D/W of tacrolimus in patients with CYP3A5 expressers (node 1) was 0.097 mg·kg−1·day−1, which was significantly higher than 0.084 mg·kg−1·day−1 in patients with CYP3A5 nonexpressers (node 2; p < 0.001). Then, nodes 1 and 2 were divided into four nodes by hemoglobin values. In CYP3A5 expressers group, the mean D/W of tacrolimus in patients who had ≤95 g·L−1 hemoglobin values (node 3) was 0.103 mg·kg−1·day−1, which was significantly higher than 0.089 mg·kg−1·day−1 in patients who had >95 g·L−1 hemoglobin values (node 4; p < 0.001). As for CYP3A5 nonexpressers group, the mean D/W of tacrolimus in patients who had ≤95 g·L−1 hemoglobin values (node 5) was 0.094 mg·kg−1·day−1, which was significantly higher than 0.078 mg·kg−1·day−1 in patients who had >95 g·L−1 hemoglobin values (node 6; p < 0.001).
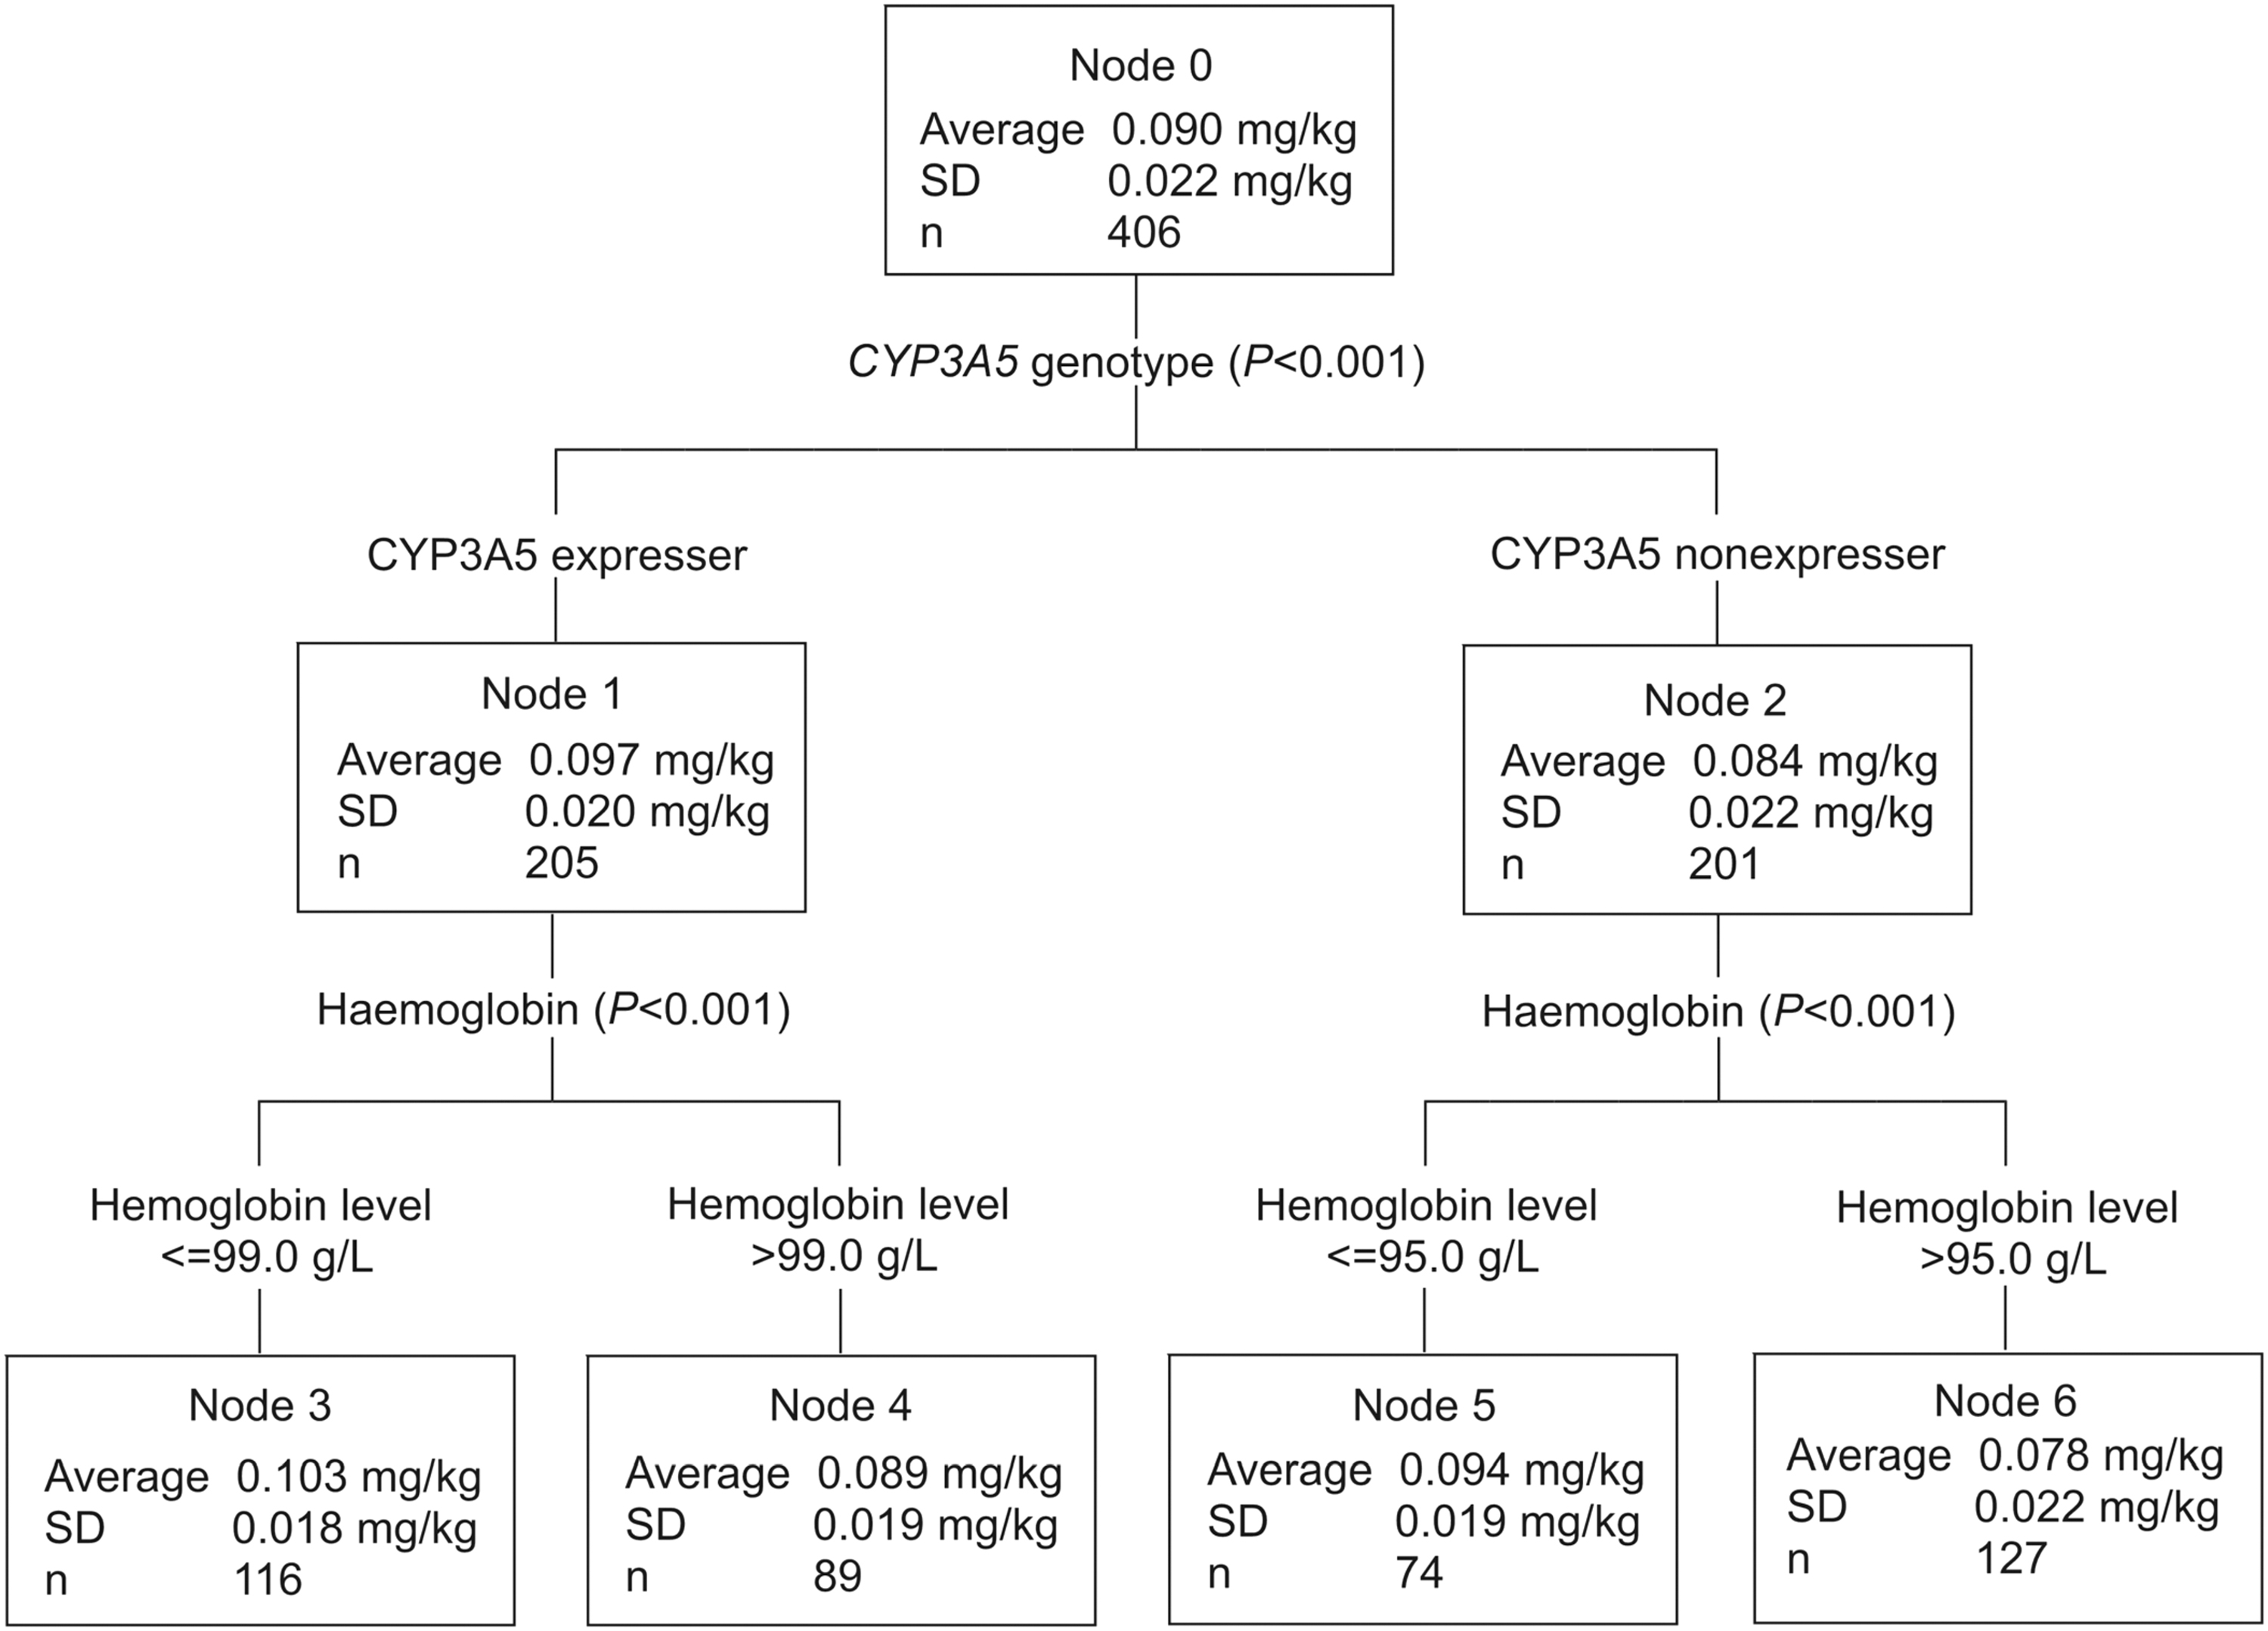
The classification and regression tree for influence factors on the D/W of tacrolimus; SD, standard deviation; daily dose (D) of reaching therapeutic window divided by body weight (W).
Discussion
In this study, a comprehensive analysis was performed to estimate the contribution of a wide range of factors involved in the variability of early tacrolimus concentrations. As shown in Figure 1, tacrolimus trough concentrations <8 ng·mL−1 were seen in 23.65% (n = 96) of the transplant recipients, while 42.61% (n = 173) had target trough concentrations. Tacrolimus trough concentrations >12 ng·mL−1 were seen in 33.74% (n = 137) of transplant recipients. The mean tacrolimus daily D/W was 0.096 ± 0.044 mg·kg−1, which was much less than the dose recommended by the CPIC or drug instruction (0.15-0.3 mg·kg−1·day−1). According to the literature and clinical practice, the recommended initial dose of tacrolimus is 0.05-0.15 mg·kg−1·day−1 to achieve the target concentration (8-12 ng·mL−1) in Chinese renal transplant recipients (Organ Transplantation Society of Chinese Medical Association, 2019).
Pharmacogenomic studies have reported genetic variants had a statistically significant association with tacrolimus trough concentrations (Staatz et al., 2010; Chen et al., 2013; Genvigir et al., 2016). These studies examined the contribution of 15 SNPs to the C0/D of tacrolimus, including drug metabolism enzymes (e.g., CYP3A4 and CYP3A5), drug transporters (e.g., ABCB1 and MRP2), and transcriptional factors, which affect CYP3A4 expression (e.g., NR1I2 and NR1I3). Although the literature reported that CYP3A5*6 and CYP3A5*7 were also important factors, because of their low mutation rate in the Asian population,5 these were not examined in this study. The result showed that CYP3A5*3 (p = 5.6 × 10⁻¹¹), CYP3A5 31611 C > T (p = 1.0 × 10⁻⁶), CYP3A4*1G (p = 0.001), and CYP3A4 T > C (rs4646437; p = 0.002) were significantly associated with tacrolimus C0/D. The tacrolimus C0/D was higher among patients with CYP3A5 *3/*3 genotype than in those with CYP3A5 *1/*3 or CYP3A5 *1/*1 genotypes (Fig. 2), and the C0 of patients with CYP3A5 *1/*3 or CYP3A5 *1/*1 genotypes tended to be lower than the treatment window, and that of patients with CYP3A5 *3/*3 genotype tended to exceed the treatment window. None of the other 11 variants had a significant association with tacrolimus C0/D. After calculating the LD value, it was found that CYP3A5 31611 C > T, CYP3A4*1G, and CYP3A4 T > C were associated with CYP3A5*3 to different degrees, and the strength of the LD was consistent with the p-value, which was compatible with the values reported in the literature (Oetting et al., 2018). Therefore, it was concluded that the presence of CYP3A5*3 variants was a major determinant of tacrolimus C0/D in this study.
In addition, considering that the effect of CYP3A5*3 may cover the effects that other genes have on tacrolimus concentration, stratified analysis was used to investigate the effects of the other 14 genotypic variants on tacrolimus C0/D among CYP3A5 expressers and nonexpressers. After eliminating the effects of CYP3A5*3 variants, only CYP3A5 31611 C > T in the CYP3A5 expressers group showed a significant effect on tacrolimus C0/D (p = 0.0003). However, since there was a high degree of LD between CYP3A5*3 and CYP3A5 31611 C > T (D′ = 1.0; r2 = 0.977), homozygous mutations in CYP3A5 31611 C > T were almost the same as CYP3A5 nonexpressers. In CYP3A5 expresser group, only two patients who carried homozygous mutations in CYP3A5 31611 C > T had much higher tacrolimus C0/D values than other patients who carried other CYP3A5 31611 C > T genotypes. Therefore, this result once again proved that the CYP3A5 nonexpresser could significantly affect tacrolimus C0/D.
Clinical factors, as well as genetic factors, could affect tacrolimus metabolism. As shown in Table 1 and Figure 2, tacrolimus C0/D was significantly correlated with hemoglobin (p = 8.4 × 10⁻¹⁰), hematocrit (p = 5.4 × 10⁻⁷), and erythrocytes (p = 1.7 × 10⁻⁵). Previous population studies also showed that hematocrit and hemoglobin were related to the plasma tacrolimus concentrations (Li et al., 2011; Jonge et al., 2012). This was due to the strong binding of tacrolimus to erythrocytes in the systemic circulation. Low hematocrit levels could lead to an increase in free tacrolimus and an increase in tacrolimus clearance, ultimately resulting in a decrease in tacrolimus blood levels. Therefore, the low hematocrit, hemoglobin, and erythrocyte levels would result in a low tacrolimus C0/D (Undre and Schäfer, 1998). Of note, we found that neutrophil numbers were also an important clinical factor affecting tacrolimus C0/D (p = 5.7 × 10⁻⁷). Neutrophils, a type of white blood cell, are involved in infection clearance or inflammation, during which the activity of CYP450 enzymes decreases and results in reduced drug clearance, and therefore an increase in drug concentration in vivo (Morgan, 2009). This may explain why there was a significantly positive correlation between tacrolimus C0/D and neutrophils. Previous plasma studies reported that tacrolimus was highly bound (>98.8%) to plasma proteins, mainly to serum albumin and α-1-acid glycoprotein. However, a correlation between serum albumin and tacrolimus C0/D was not found in this study. More than 95% of tacrolimus metabolites were eliminated by the biliary route, while urinary excretion only accounted for 2.4% of tacrolimus elimination (Staatz and Tett, 2004). Some researchers found that TBIL and IBIL could increase the concentration of tacrolimus metabolites in the blood, and these were significantly correlated with tacrolimus concentration (Gonschior et al., 1996; Li et al., 2011). However, this study showed that postoperative kidney function, including urea nitrogen (p = 0.032), serum creatinine (p = 0.004), and GFR (p = 0.006), rather than bilirubin, could affect tacrolimus C0/D. In addition, age (p = 0.020) was found to be significantly correlated with tacrolimus C0/D, which was consistent with the literature (Wang et al., 2010; Luo et al., 2016).
In addition, to obtain a concise model, a classification and regression tree model was developed. In the last 10 years, population pharmacokinetic model, based on pharmacokinetics and statistics, became the most commonly used models for predicting tacrolimus individualized doses in the literature (Han et al., 2013; Bergmann et al., 2014; Zhu et al., 2018). Comparing with pharmacometric model, the classification and regression tree analysis relied largely on statistics and turned massive original data to a tree with few predicted classes at terminal nodes, which was much more visual, pictorial, and accessible. Furthermore, the classification and regression tree analysis capture the most important factors and do not require modeling software. Finally, as shown in Figure 3, the tree divided patients into four groups according to the CYP3A5 genotype and hemoglobin levels. Accordingly, for patients with CYP3A5 expressers and ≤99 g·L−1 hemoglobin, CYP3A5 expressers and >99 g·L−1 hemoglobin, CYP3A5 nonexpressers and ≤95 g·L−1 hemoglobin, and CYP3A5 nonexpressers and >95 g·L−1 hemoglobin, the recommended D/W of tacrolimus was 0.103, 0.089, 0.094, and 0.078 mg·kg−1·day−1, respectively (Fig. 4).
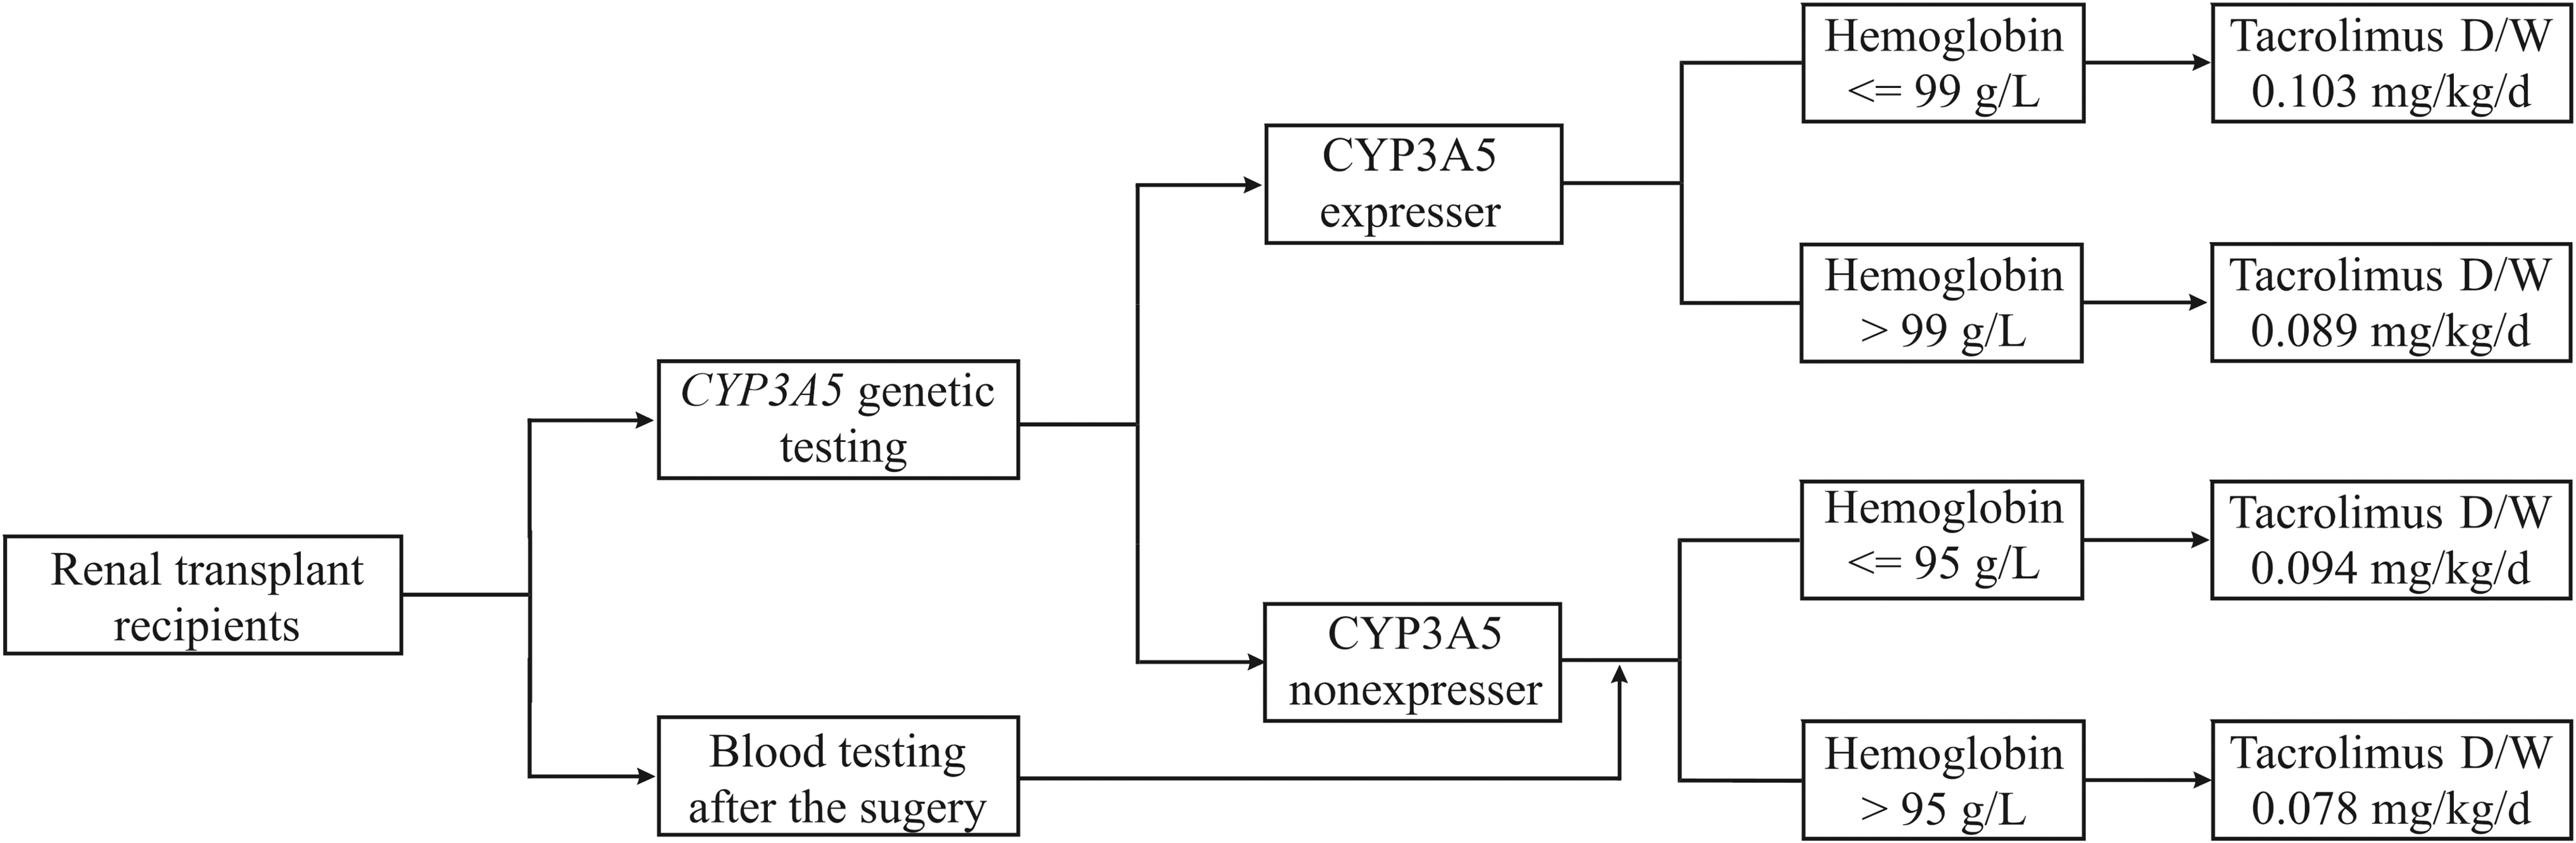
The recommended starting dose of tacrolimus. D/W: daily dose divided by body weight.
Our study has several limitations. First, this study found that CYP3A5 genotype, hemoglobin, neutrophils, dose, body weight, Scr, and age were significantly associated with tacrolimus C0/D. To calculate the starting dose of tacrolimus, considering all clinical variables that effect tacrolimus concentration, a NONMEM population pharmacokinetics model would be useful. Second, with the limited number of patients, the efficacy of the classification and regression tree model based on CYP3A5 genotype and hemoglobin was not validated in this study, which was the next work of our group. In brief, the external validation experimental program is tentatively set to two parts. First, collect a certain number of recipients' dosage of when tacrolimus concentration reaches the therapeutic window at the initial stage of kidney transplantation, and compare whether the dosage is consistent with that recommended in the classification and regression tree. If the results are consistent, then randomly assign kidney transplant recipients to the experimental group and the control group. The recipients in both groups use a triple immunosuppressive regimen (tacrolimus+mycophenolate mofetil+steroids). In the experimental group, the initial tacrolimus dosage was calculated by the classification and regression tree, and in the control group, the tacrolimus dosage was determined by the experience of medical teams. The accuracy of the classification and regression tree was verified by comparing the ratio of the first tacrolimus measurement reaching the therapeutic window and the time it took for tacrolimus concentration to reach the therapeutic window between the two groups.
Conclusion
In conclusion, this study examined the impact of genetic and clinical factors on the tacrolimus starting dose requirement in Chinese renal transplant recipients. It was found that CYP3A5 genotype and hemoglobin were significantly associated with tacrolimus C0/D. Accordingly, a concise recommendation for a tacrolimus dosage regimen, the classification and regression tree, was also developed. It showed the mean D/W of tacrolimus according to the CYP3A5 genotype and hemoglobin value. These data provide a concise approach to predicting tacrolimus starting dose requirements, which could help patients achieve the treatment window quickly after surgery.
Footnotes
Acknowledgments
The authors are grateful to Yidi Wang and Kairui Zhou for their help in collecting patient information.
Author Disclosure Statement
The authors declare that there are no conflicts of interest regarding the publication of this article.
Funding Information
This work was financially supported by the National Natural Science Foundation of China (Grant No. 81703799 and 81803638) and Henan Provincial Key Scientific and Technological Research Projects (Grant No. 182102310146).

References
Supplementary Material
Please find the following supplemental material available below.
For Open Access articles published under a Creative Commons License, all supplemental material carries the same license as the article it is associated with.
For non-Open Access articles published, all supplemental material carries a non-exclusive license, and permission requests for re-use of supplemental material or any part of supplemental material shall be sent directly to the copyright owner as specified in the copyright notice associated with the article.
