




Abstract
Aims:
To assess the expression and epigenetic regulation of Syncoilin, intermediate filament protein (SYNC) in gastric cancer tissues, and to determine its associations with clinicopathological features; immune infiltration of macrophages in tumors; and patient survival.
Materials and Methods:
Clinicopathological features, expression profiles, and methylation data of the SYNC gene were obtained from multi-institutional real-world public datasets. A total of 1601 samples from patients with gastric cancer were examined. The associations between clinicopathological features and SYNC expression levels were assessed by the chi-square test; survival was assessed using the Kaplan-Meier analysis. The infiltration levels of M1, 2-polarized tumor-associated macrophages (TAMs) in a gastric tumor immune microenvironment were quantified using deconvolution, and the correlation between SYNC expression level and M1, 2-polarized macrophages' infiltration was examined using the Pearson correlation test. SYNC gene methylation data were analyzed to investigate epigenetic control of its expression.
Results:
SYNC expression was elevated in gastric cancer tissues (p < 0.01), and was associated with a poorer overall survival (p < 0.01) and poorer postprogression survival (p = 0.01). Higher SYNC levels were significantly associated with more aggressive clinicopathological features in gastric cancer patients (p < 0.05). SYNC was also associated with the infiltration of M2-polarized TAMs in the gastric tumor immune microenvironment (p < 0.001). Hypomethylation was shown to be associated with SYNC's upregulation (p < 0.05).
Conclusion:
SYNC is highly expressed in gastric cancer tissues and has the potential to be a therapeutic target and to serve as a prognostic marker.
Introduction
Gastric cancer is not only one of the most prevalent cancers with a poor prognosis, but it is also the most common malignant tumor in the digestive system. Lack of useful markers makes it difficult to predict clinical outcomes for gastric cancer patients, and its pathogenesis remains unclear.
The Syncoilin, intermediate filament protein gene (SYNC), encodes a member of the intermediate filament superfamily of genes (Newey et al., 2001). The absence or malfunction of Syncoilin may lead to the disruption of the intermediate filament network, which is associated with cellular necrosis (Poon et al., 2002). The intermediate filament family supplies a supporting framework and provides mechanical strength within the cell (Nowak et al., 2005). Syncoilin has been proposed to be associated with the intermediate filament-related cytoskeleton rearrangements; and mutations in SYNC may cause muscle diseases (Brown et al., 2005). It has also been shown to be important for muscle cell regeneration (Moorwood, 2008), and modulation of peripherin filament networks.
It is an intermediate filament protein that is required for many tissue types, such as activated hepatic stellate cells, which play an important role in several pathophysiologic conditions in the liver (Van Rossen et al., 2014). Intermediate filaments represent a major cytoskeletal network that contributes to cell adhesion, migration, and shape, as well as to tissue renewal and resilience (Bouameur and Magin, 2017).
Intermediate filaments have also been associated with tumorigenesis and metastasis (Gatter et al., 1986; Schüssler et al., 1992; Morgan and Su, 1994; Hendrix et al., 1996). Recently, cytokeratin, a member of the intermediate filament superfamily, was found to be associated with treatment responses and overall survival in patients suffering from cancer (Nagel et al., 2018). Syncoilin is an atypical type III intermediate filament protein that belongs to the intermediate filament superfamily similar to cytokeratin. However, the role of SYNC in gastric cancer remains unclear.
This study was designed to perform a comprehensive analysis of the expression of SYNC in gastric cancer tissues and its associations with M2-polarized tumor-associated macrophages (TAMs); patients' clinicopathological features and overall and progression-free survival.
Materials and Methods
mRNA expression data and patient information
The expression status of the SYNC gene was assessed in human normal control and tumor tissues using the Gene Expression Omnibus (GEO) dataset from the National Center for Biotechnology Information website (Barrett and Edgar, 2006). This GEO dataset contains data obtained from microarray-based experiments. In this study, the primary filtering criteria were “Gastric cancer versus Normal Analysis” and “Differential Analysis”; raw data (.CEL format) were obtained online for each dataset. In addition, a standard data normalization process was used for all datasets. The platform filtering criterion was set to “Affymetrix U133” to minimize the platform variations when determining differences in SYNC expression among cancer types.
The Affymetrix U133 platform comprises the following three types of arrays: Human Genome U133A 2.0, Human Genome U133A&B, and Human Genome U133 Plus 2.0 arrays; these arrays differed in the number of probe sets per chip, but all included SYNC. The following datasets were included in this research: GSE13911 (D'Errico et al., 2009), GSE15459 (Ooi et al., 2009), and GSE54129 (Yang et al., 2016). The methodology of mRNA expression, including Affymetrix Human Genome U133A 2.0, Human Genome U133A&B, Human Genome U133 Plus 2.0 arrays, and RNA-seq, was provided on the references (D'Errico et al., 2009; Ooi et al., 2009; Yang et al., 2016; Hutter and Zenklusen, 2018).
Correlations between SYNC expression and clinicopathological features were assessed, in which, raw expression data and clinical information of patients with gastric cancer were downloaded from GEO (the Gene Expression Omnibus dataset; www.ncbi.nlm.nih.gov/geo/) and TCGA (the Cancer Genome Atlas; https://cancergenome.nih.gov/). In addition, the correlation between SYNC and survival was determined using the GEO dataset and the Km plotter dataset (Szász et al., 2016). The pathological subtypes are the Lauren classification, including diffuse, mixed, and intestinal. The treatment approach included that surgery only, 5-FU-based adjuvant and other adjuvant. Finally, expression profiles and clinical information were examined for 1601 tissue samples from patients with gastric cancer.
Immunohistochemical staining data of the protein expression of SYNC
Protein expression levels of SYNC in normal control and gastric cancer tissues were compared using immunohistochemical (IHC) staining data provided by the Human Protein Atlas (HPA) (Uhlén et al., 2005). For the acquisition of experimental samples and IHC methods, specific text instructions and a video presentation are provided on the website of the HPA (Uhlén et al., 2005).
Gastric cancer methylation data
We investigated epigenetics as a potential regulation mechanism underlying the SYNC gene's dysregulated expression by evaluating methylation data and mRNA-seq data downloaded from the Cancer Genome Atlas (TCGA; https://cancergenome.nih.gov/) (Hutter and Zenklusen, 2018). Data preprocessing and statistical analyses were executed by applying R software 3.5.2.
Data quantification of the infiltration levels of M1- and M2-polarized TAMs in the gastric tumor immune microenvironment
The infiltration levels of M1, 2-polarized TAMs in the gastric tumor immune microenvironment were quantified using deconvolution via R package of CIBERSORT (Newman et al., 2015), with the default signature matrix set at 100 permutations, using primary data from the GSE15459 and GSE54129 data sets. Correlations between the expression levels of SYNC and the extent of infiltration of M1- and M2-polarized TAMs were examined using the Pearson correlation test from the R software package 3.5.2.
Data preprocessing and representation
All samples were defined as either gastric carcinoma or normal controls in this study. Gastric cancer datasets from the Affymetrix U133 platform were normalized using the RMA algorithm (Irizarry et al., 2003) and implemented in R statistical software. The expression values of SYNC were based on the means of all probe sets covering SYNC. Moreover, SYNC expression levels were dichotomized into low- and high-expression groups using the median value as a cutoff.
Statistical analysis
In this study, data were analyzed using R statistical software. Using paired or unpaired t-tests, differences in expression levels were analyzed between the carcinoma and normal control tissues. Using the chi-square (χ2) test, correlations between gene expression and clinicopathological characteristics were assessed. The overall survival, postprogression survival, and first progression were assessed by the Kaplan-Meier analysis and the log-rank test using R statistical software or the KM plotter (Szász et al., 2016). In addition, unpaired t-tests were used to compare SYNC expression levels between patients with high and low methylation levels. The correlation between SYNC expression and methylation was analyzed using the Pearson correlation test.
Univariate Cox analysis was performed to select the related variables, then, multivariate Cox proportional-hazard analysis was performed to test the independent association of SYNC expression and prognosis using package of R (Therneau, 2015). Plots were drawn using GraphPad Prism or R software. p < 0.05 was considered statistically significant.
Gene set enrichment analysis
Gene set enrichment analysis (GSEA) was used to predict gene sets modulated by SYNC. The GSEA was carried out by applying the GSEA 3.0 package; we ran 1000 permutations and used a false discovery rate (FDR) cutoff of <0.25 and with a nominal p-value set to 0.05.
Results
SYNC is upregulated in gastric cancer tissues compared to normal control gastric tissues
To examine SYNC expression levels in human gastric cancer, we downloaded tumor expression profiles from the GEO dataset and normalized the data. As shown in Figure 1A and B, SYNC expression was significantly higher in gastric cancer tissues than in normal control tissues (Fig. 1A, 31 cancer tissues vs. 31 normal control tissues, data from GSE13911, p = 0.0036, by paired t-tests; Figure 1B, 111 cancer tissues vs. 21 normal control tissues, data from GSE54219, p < 0.0001, by unpaired t-tests). An analysis of Syncoilin protein expression using IHC data provided by the HPA showed that upon staining with anti-Syncoilin antibody (Antibody HPA028311), the normal control gastric tissues mostly exhibited low levels of Syncoilin staining (Fig. 2A, B), while gastric cancer tissues showed predominantly medium to high levels of Syncoilin staining in both the cytoplasm and cell membrane (Fig. 2C, D). Statistical analysis was not performed due to the small sample size.
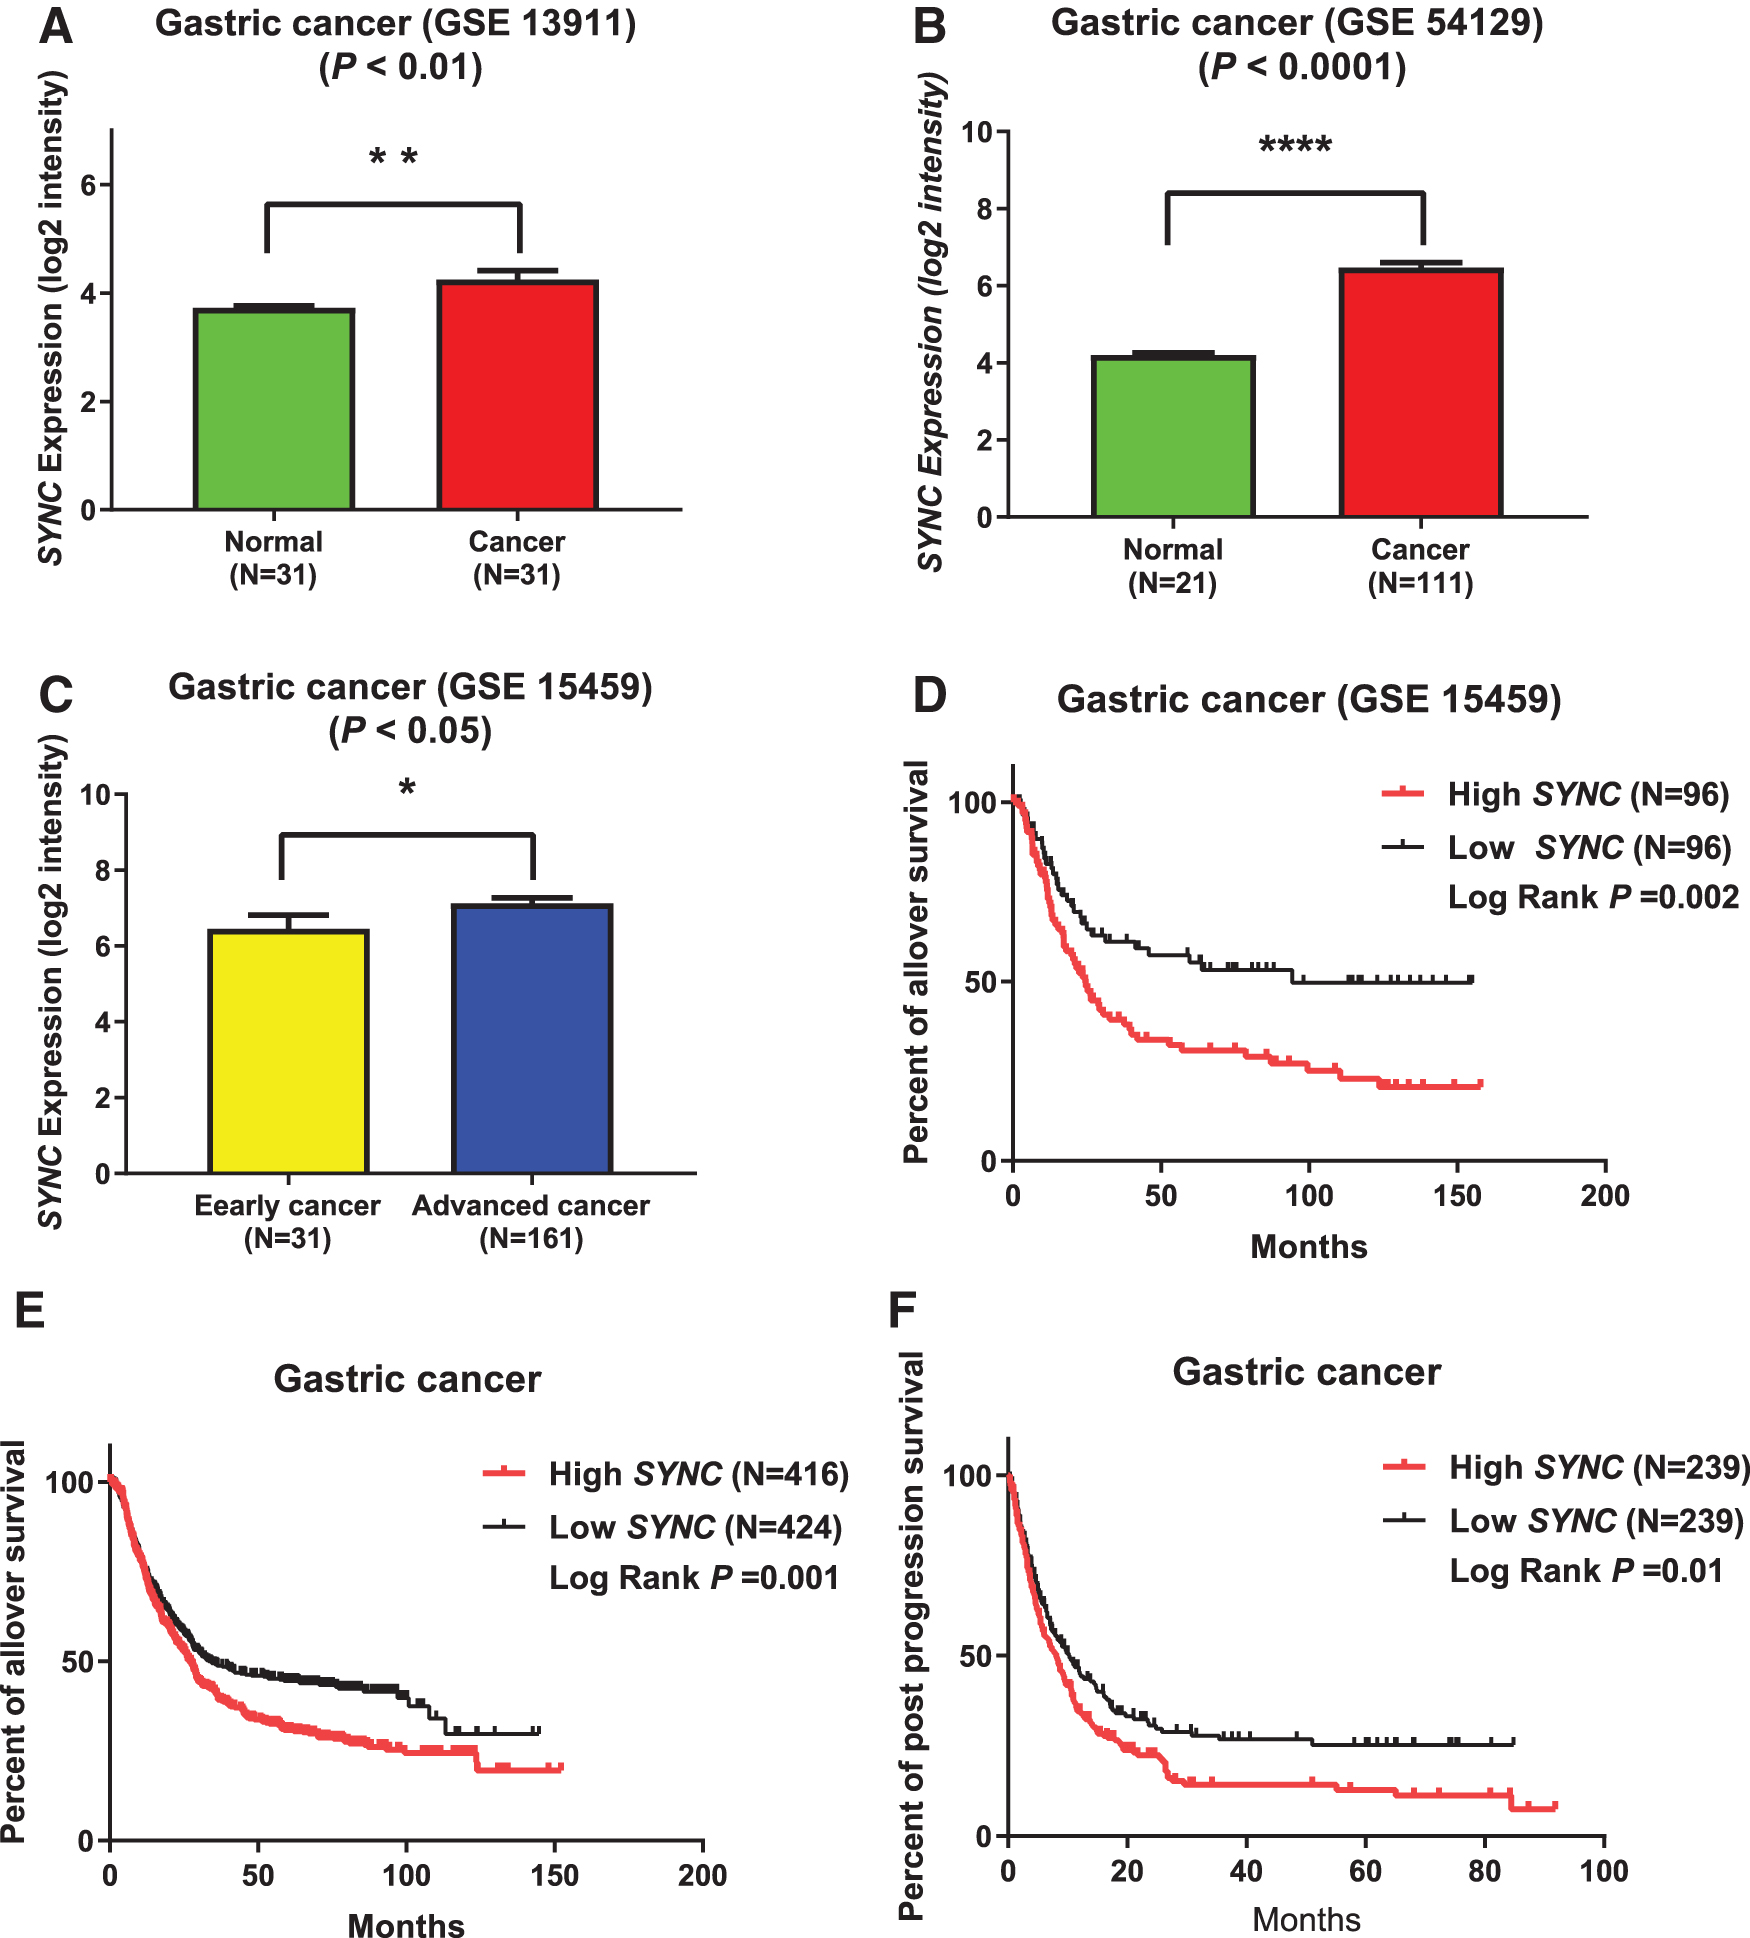
Expression of SYNC and correlation with patient prognosis in gastric cancer.

IHC analysis of Syncoilin expression in normal and cancerous gastric tissues. SYNC expression was analyzed at the protein level by using IHC staining.
Correlation between SYNC expression and survival in gastric cancer
SYNC mRNA expression (low SYNC, n = 96; high SYNC, n = 96) in gastric cancer tissues (primary data from GSE15459) was significantly correlated with overall survival (χ2 = 9.247, p = 0.002; log-rank test) (Fig. 1D). High SYNC levels (low SYNC, n = 424, high SYNC, n = 416) in gastric cancer tissues (data from the log-rank test analyzed by the KM plotter) were significantly correlated with a poor overall survival (χ2 = 10.61, p = 0.001, log-rank test) (Fig. 1E). Similarly, high SYNC levels (low SYNC, n = 239, high SYNC, n = 239) in gastric cancer tissues (data from and log-rank test analyzed by the KM plotter) were significantly correlated with a poor postprogression survival (χ2 = 6.615, p = 0.01, log-rank test) (Fig. 1F). In summary, these results demonstrate that high SYNC expression is an indicator of poor prognoses in patients with gastric cancer.
Correlations between SYNC expression and clinicopathological features of patients with gastric cancer
Table 1 summarizes the data revealing marked correlations between SYNC expression and clinicopathological features of patients with gastric cancer (primary data from GSE15459). Increased SYNC expression was highly correlated with more aggressive tumor phenotypes. In this study, we used the 7th UICC classification of malignant tumors, including stages I-IV (Sobin et al., 2011). Stage I tumors, which include stage IA and stage IB, in this system are considered as early gastric cancers (Bollschweiler et al., 2014), whereas tumors of all other stages are classified as advanced.
Correlation Between SYNC Expression and Clinicopathologic Features of Patients with Gastric Cancer (Primary Data from GSE15459)
Data analyzed by chi-square tests.
p < 0.05.
p < 0.001.
SYNC, Syncoilin, intermediate filament protein.
It was found that SYNC expression was markedly higher in advanced gastric cancer stages than in early gastric cancer stages. Figure 1C also shows that SYNC expression was markedly higher in advanced gastric cancer stages than in early gastric cancer stages. Furthermore, SYNC expression was significantly elevated in more aggressive pathological subtypes, such as invasive cancers, compared to other subtypes of gastric cancer.
Table 2 shows the analysis of correlations between SYNC expression and TCGA (primary data from TCGA) classification subtypes. The results showed that SYNC expression was also significantly higher in advanced gastric cancer stages than in early gastric cancer stages. Furthermore, SYNC expression was also significantly elevated in more aggressive TCGA classification subtypes, such as diffuse cancers and grade 3 cancers, compared to other subtypes of gastric cancer.
Correlation Between SYNC Expression and Clinicopathological Features of Patients with Gastric Cancer (Primary Data from TCGA)
Data analyzed by chi-square tests.
p < 0.05.
p < 0.001.
GSEA of gastric cancer tissues with high SYNC expression
Figure summarizes the GSEA results for the gastric cancer tissues with high SYNC expression (primary data from GSE15459). In this study, the curated gene set was used as an example dataset. Enriched gene sets correlated with the following pathways: CR_CYTOSKELETON [p = 0.0081; FDR, 0.2217; enrichment score (ES), 0.6306; Figure], PTEN PATHWAY (p = 0.01; FDR, 0.1235; ES, 0.6388; Fig. 3B), p38 MAPK PATHWAY (p = 0.0040; FDR, 0.1304; ES, 0.5777; Fig. 3C), PDGF PATHWAY (p = 0.0137; FDR, 0.1962; ES, 0.6376; Fig. 3D), GSK3 PATHWAY (p = 0.0062; FDR, 0.2019; ES, 0.7062; Fig. 3E), and ERK5 PATHWAY (p = 0.0086; FDR, 0.1233; ES, 0.5946; Fig. 3F).

GSEA for gastric cancer tissues with high SYNC expression (data from GSE15459).
These findings suggest that SYNC might be involved in the regulation of the cancer-related (CR) cytoskeleton, the PTEN pathway, the p38 MAPK pathway, the PDGF pathway, the GSK3 pathway, and ERK5 pathway. These pathways have been shown to contribute to the polarization of macrophages and enhance the infiltration level of M2 TAMs (Beurel and Jope, 2008; Rovida et al., 2008; Schmieder et al., 2011; Chen et al., 2016; Wang et al., 2018a, 2018b; La et al., 2019; Park et al., 2011).
Correlation between the expression of SYNC and infiltration level of TAMs in the gastric tumor immune microenvironment
The GSEA results revealed that high expression levels of SYNC were associated with multiple pathways that have been shown to contribute to the infiltration level of M2 TAMs (Fig. 3). Therefore, we analyzed the correlation between the expression levels of SYNC and the infiltration level of TAMs, including M1- and M2-polarized TAMs, in the gastric tumor immune microenvironment. The infiltration levels of M1- and M2-polarized TAMs were quantified via deconvolution using the R package program CIBERSORT (https://cibersort.stanford.edu/) and primary data from the GSE15459 and GSE54129 data sets. The patients were divided into high and low expression-level groups based on the median value for the expression of SYNC of each level of infiltration of M2- and M1-polarized TAMs.
The results of the two datasets are similar and provide mutual verification; thus confirming that the increased infiltration level of M2-polarized TAMs are significantly associated with high expression levels of SYNC based on unpaired t-tests and Pearson's correlation analysis. (Fig. 4A, C, p < 0.05; Fig. 4B, D, p < 0.05). In contrast, the infiltration levels of M1-polarized TAMs were not significantly associated with the expression levels of SYNC based on unpaired t-tests (Fig. 4E, G, p > 0.05), nor was there a correlation between the infiltration levels of M1-polarized TAMs and the expression of SYNC using Pearson's correlation (Fig. 4F, H, p > 0.05).
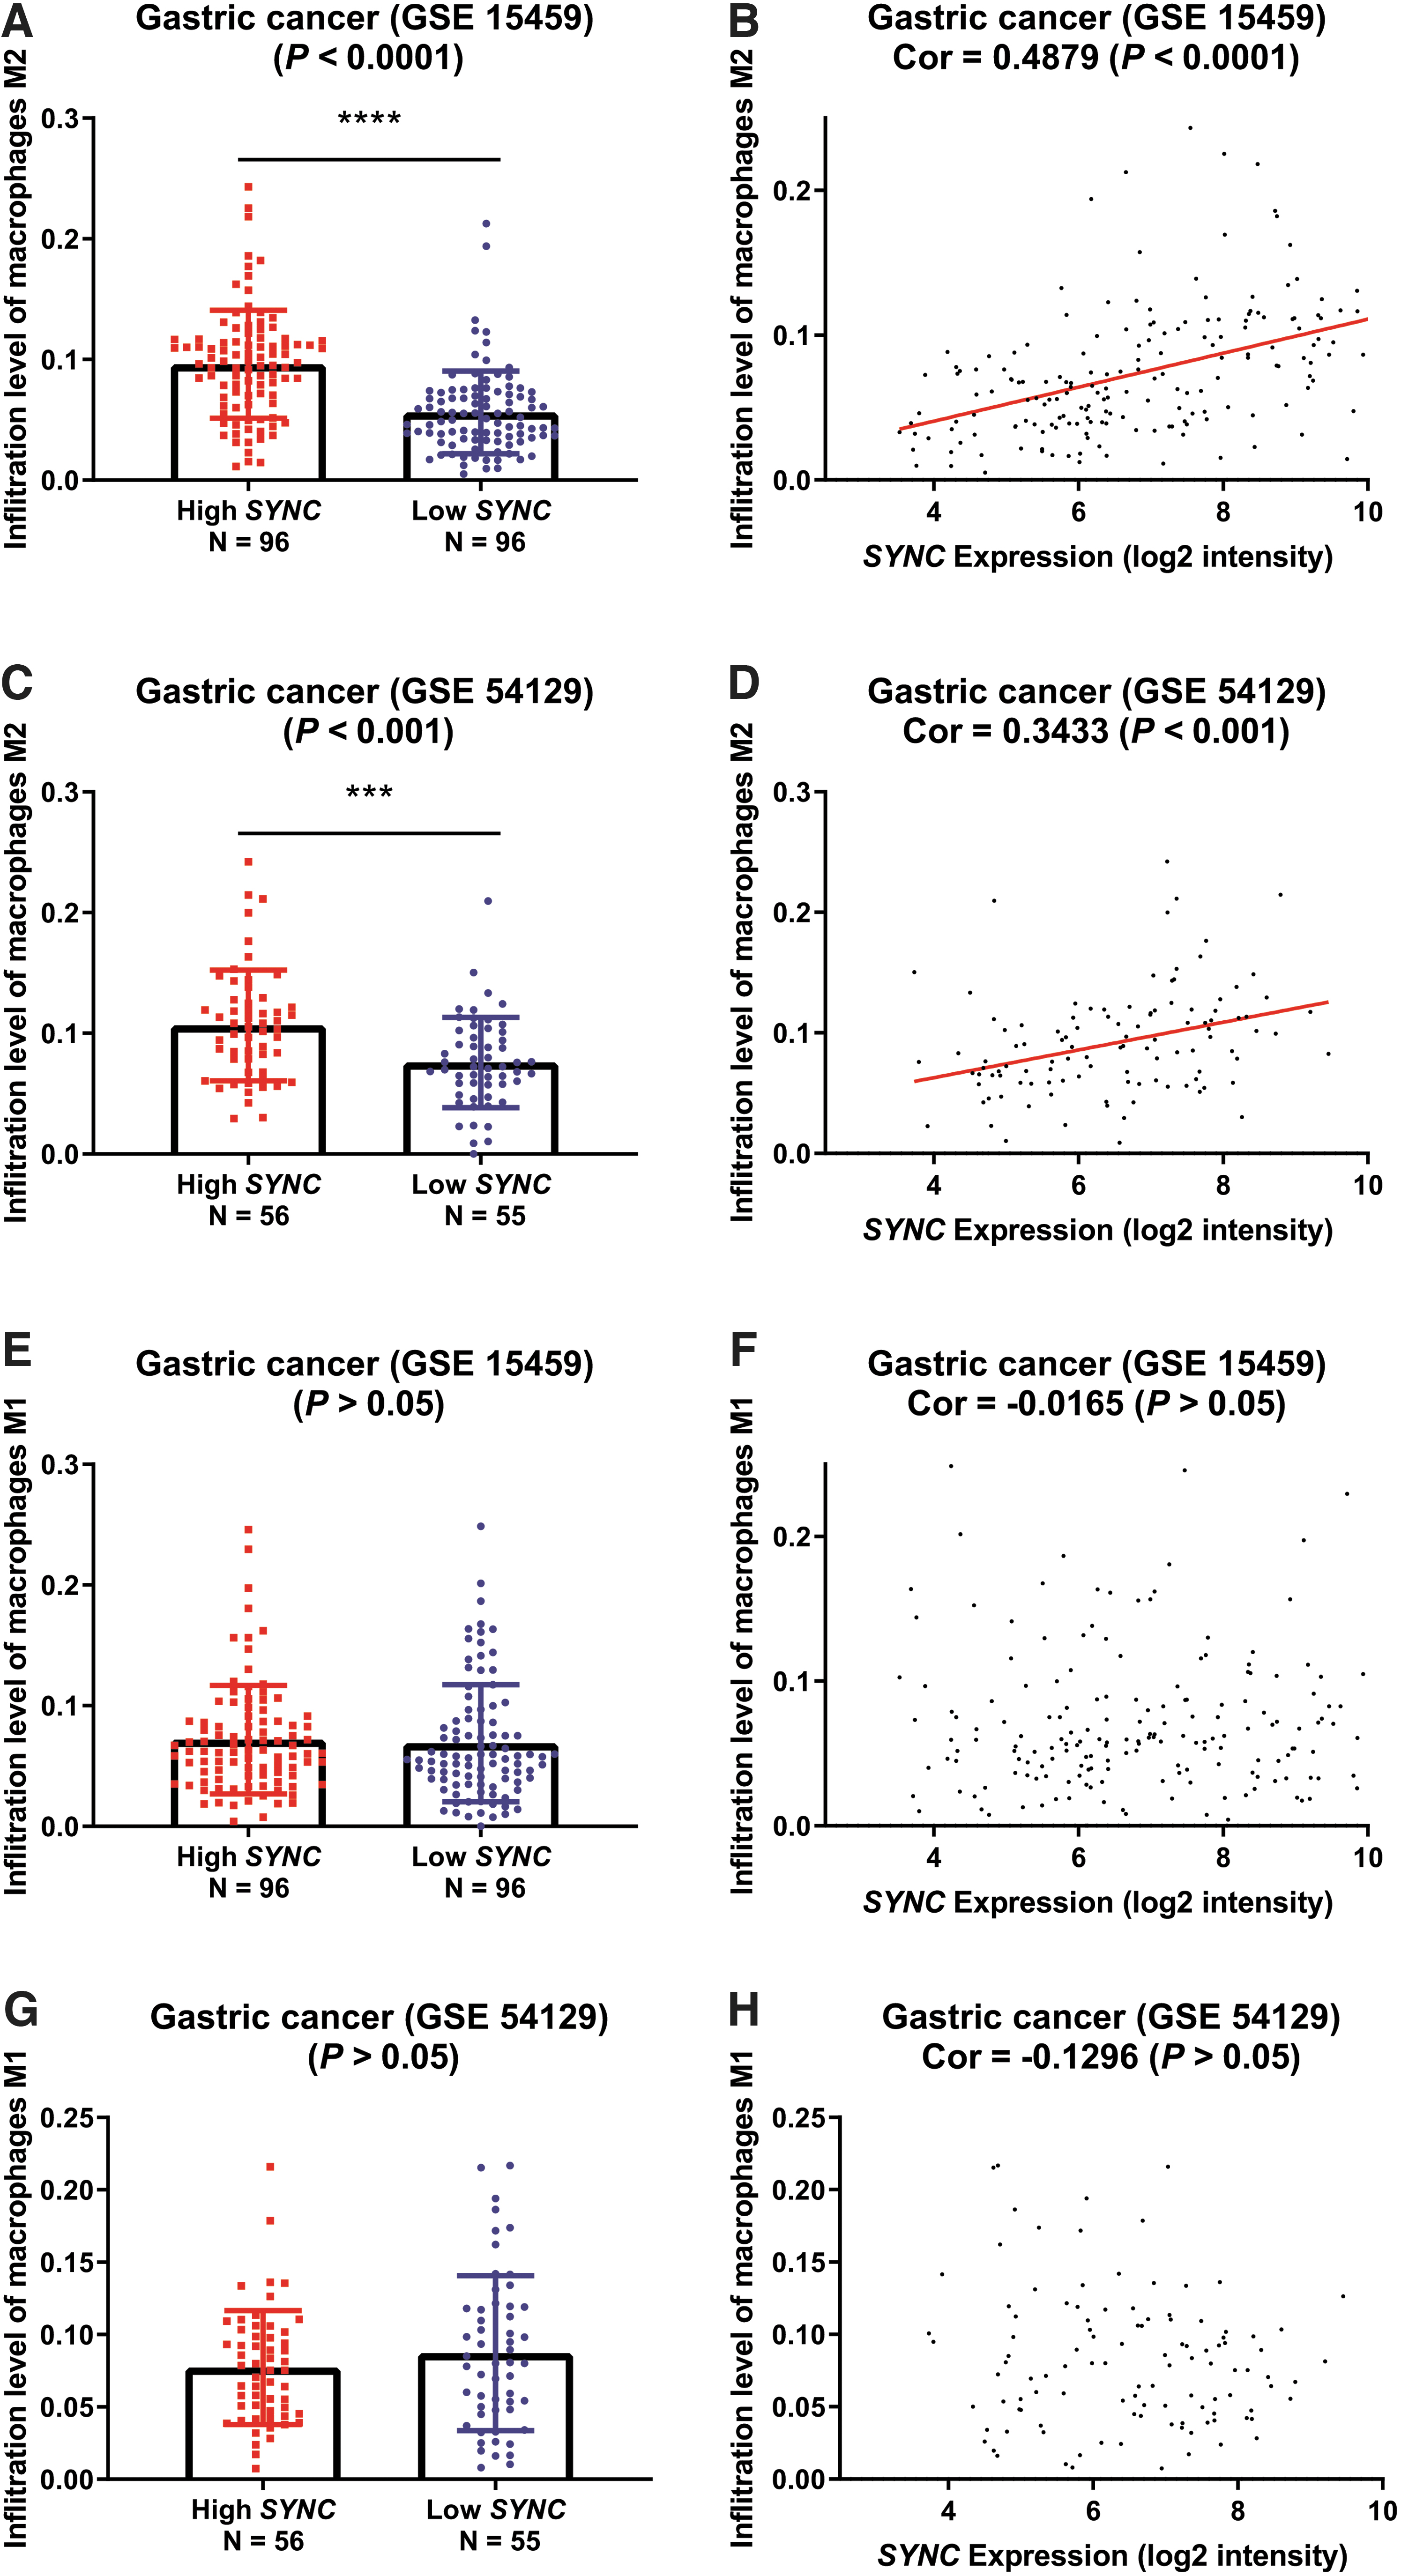
Correlation between the expression of SYNC and infiltration level of M1- and M2-polarized macrophages in the gastric tumor microenvironment.
Taken together, these findings demonstrate that high expression levels of SYNC might enhance infiltration of M2-polarized TAMs in the gastric tumor immune microenvironment.
Regulation of SYNC expression by methylation in gastric cancer
To investigate the mechanisms underlying the dysregulation of SYNC, we compared the expression levels of SYNC and SYNC gene methylation levels. From these analyses, we observed that low methylation levels of methylated sites (cg15058557, cg12634957, cg22350438, and cg19296960) were significantly associated with high expression levels of SYNC based on unpaired t-tests (Fig. 5A, C, E, G, p < 0.05, primary data from TCGA), thus there is significant negative correlation between the expression of SYNC and methylation level of potentially methylated sites based on a Pearson's correlation test (Fig. 5B, D, F, H, p < 0.05, primary data from TCGA). The patients were divided into high- and low-methylation groups based on the median value for each methylated site probe (cg15058557, cg12634957, cg22350438, and cg19296960).
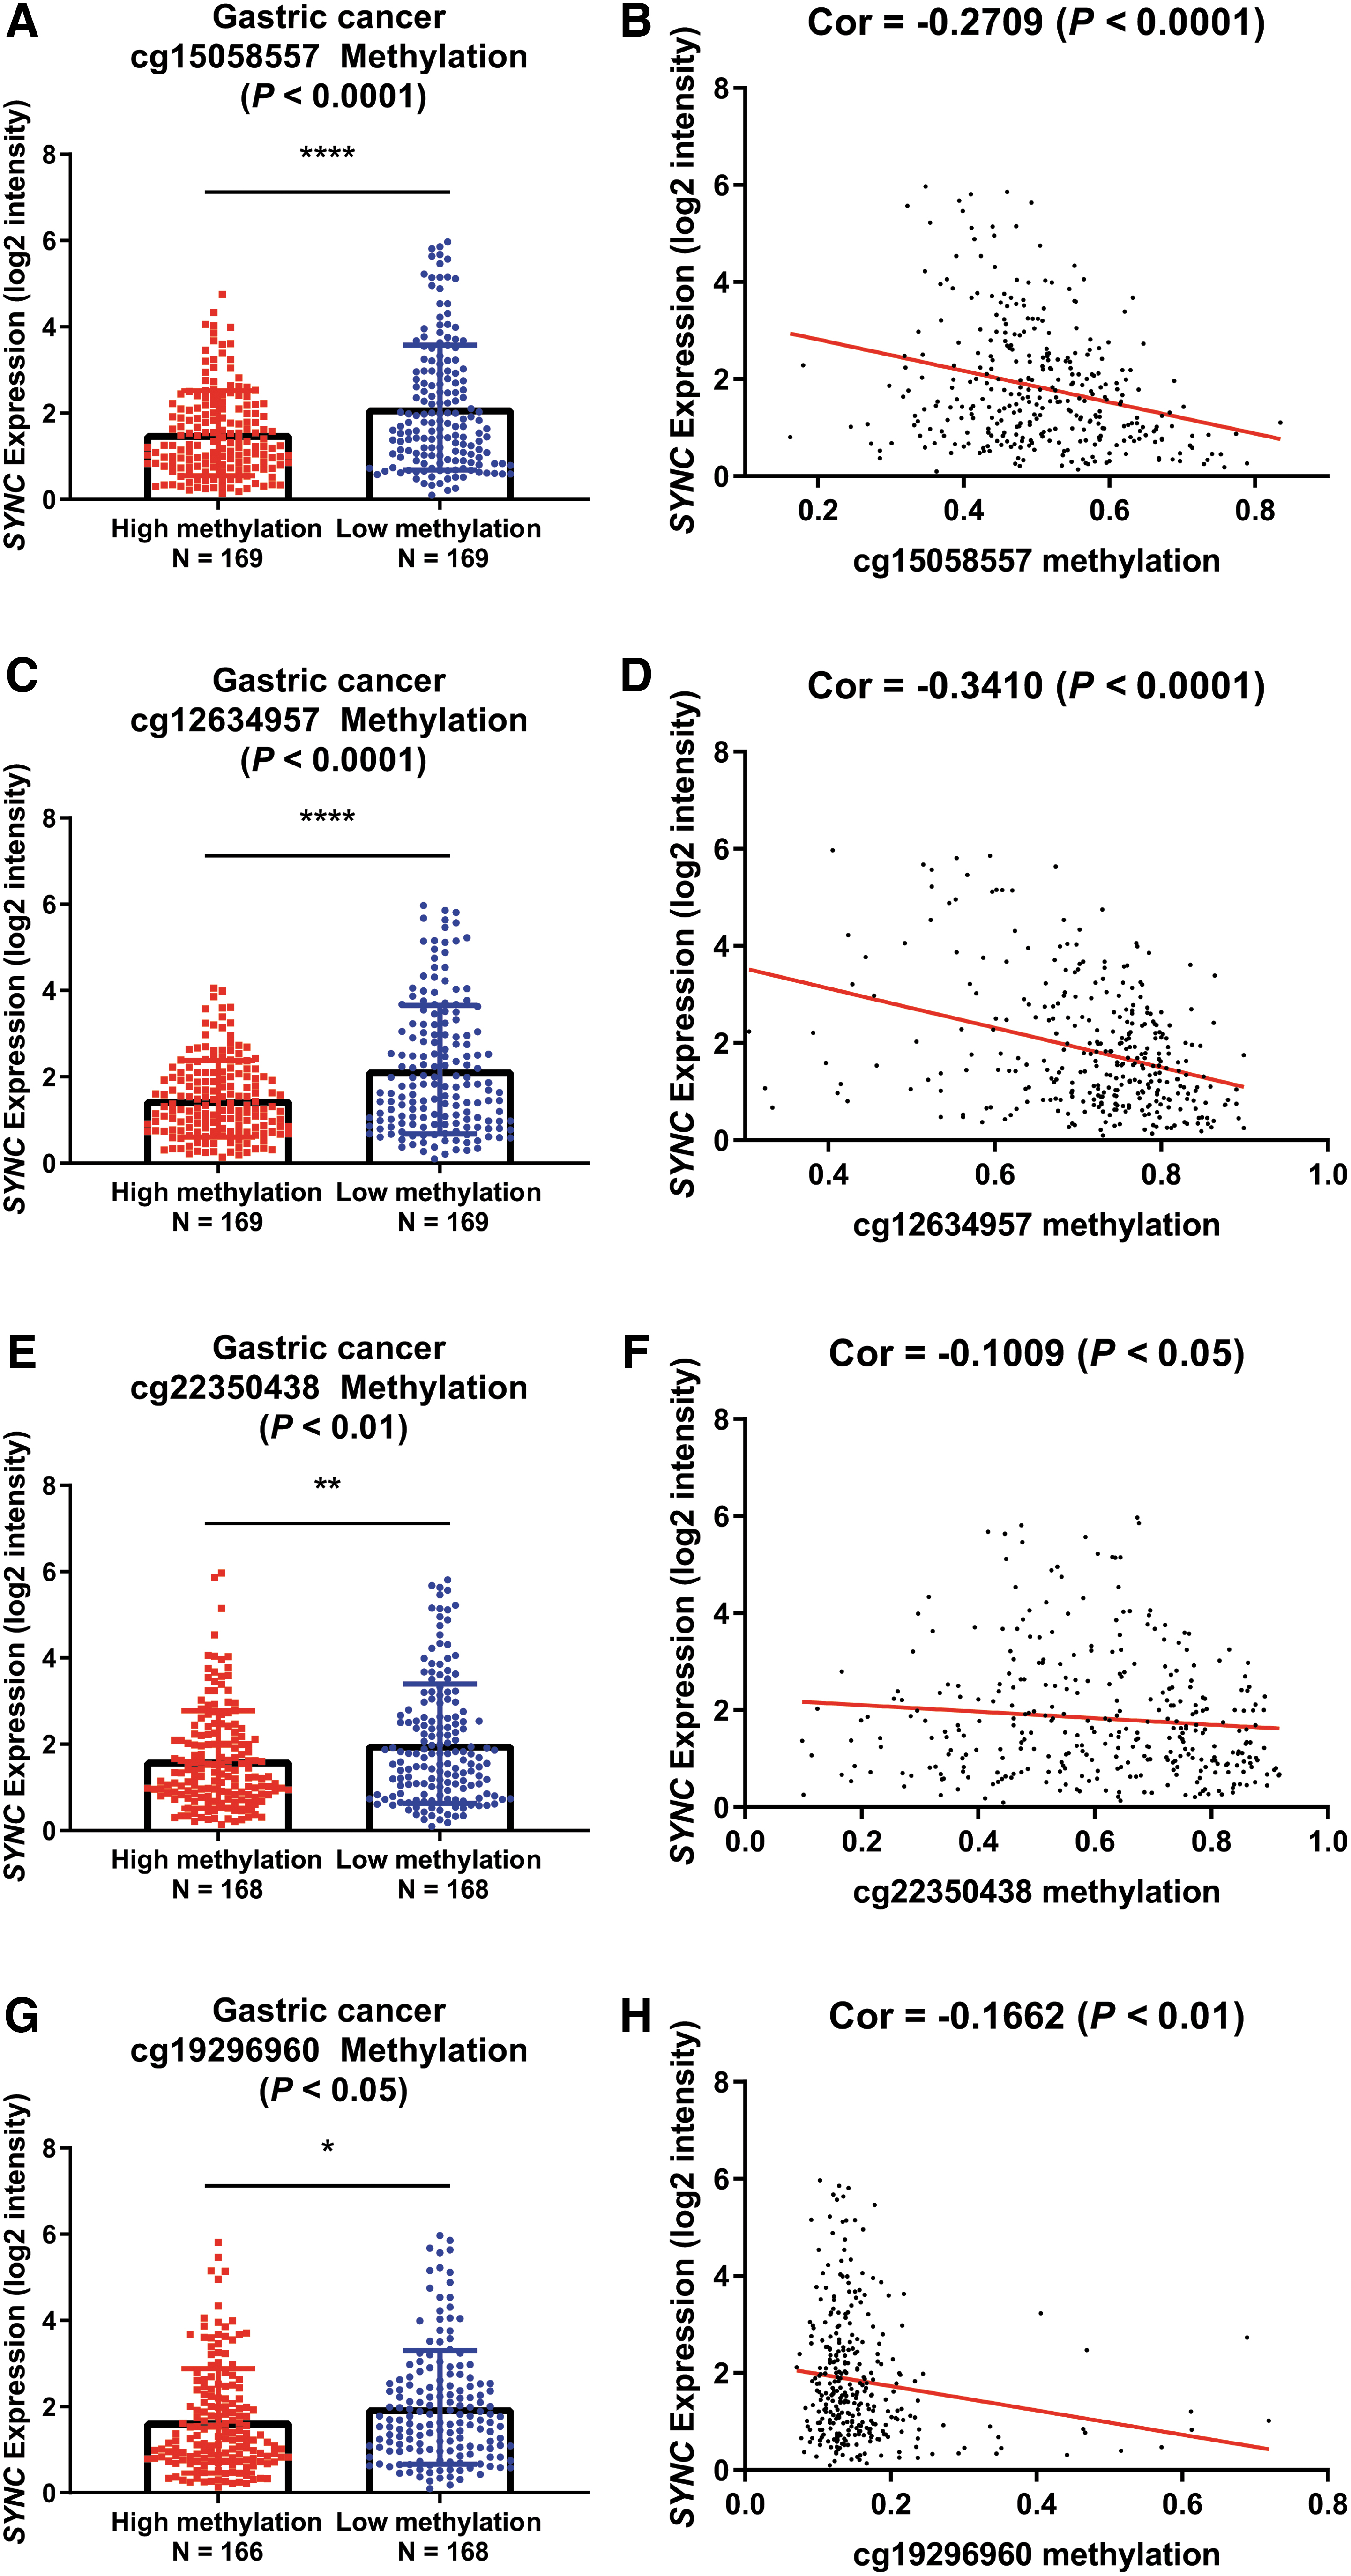
SYNC expression is regulated by methylation in gastric cancer.
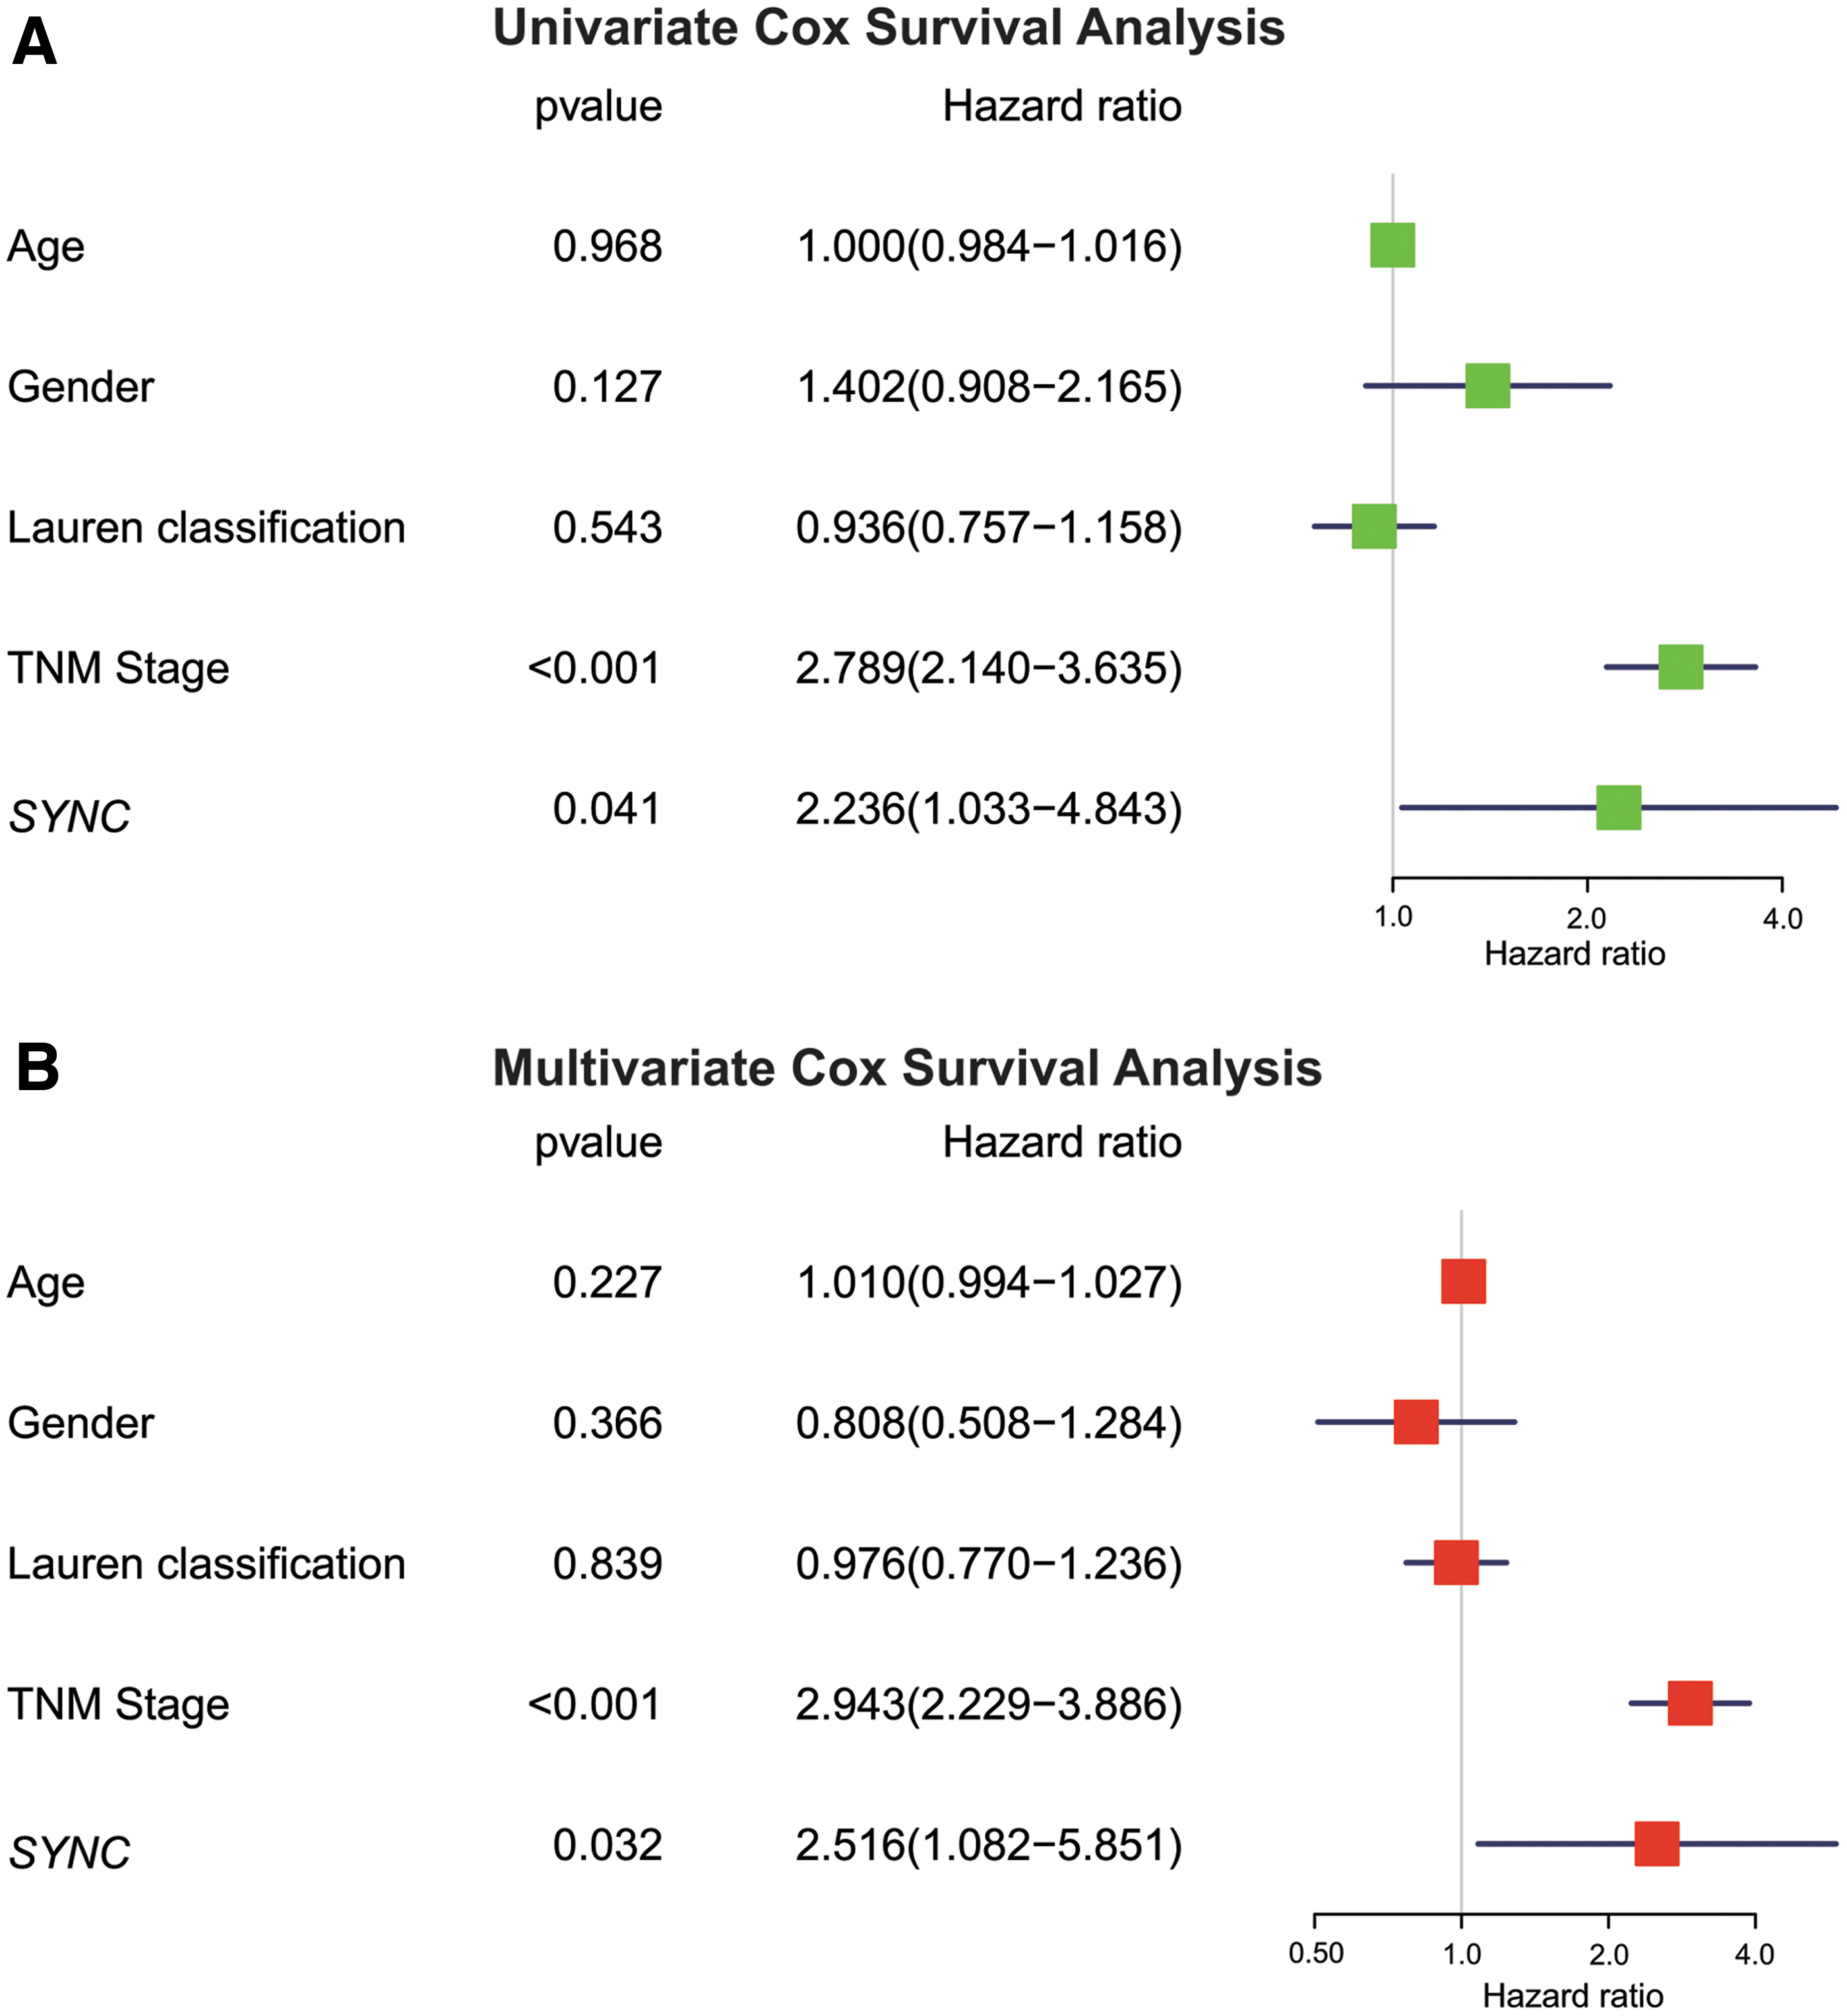
Univariate and multivariate Cox analysis of overall survival.
Overall, the above findings confirm that hypomethylation might upregulate SYNC in gastric cancer.
High SYNC expression is an independent prognostic marker
We used the univariate Cox survival analysis (Fig. 6A, primary data from GSE15459) to select the related variables for multivariate Cox survival analysis (Fig. 6B, primary data from GSE15459). Following multivariate Cox survival analysis, high SYNC expression was an independent prognostic factor for overall survival (hazard ratio: 2.516, confidence interval (CI): 1.082-5.851, p < 0.05) in gastric cancer (Fig. 6B).
Discussion
This study demonstrates that SYNC expression is upregulated in gastric cancer tissues when compared to normal control gastric tissues. SYNC encodes (Newey et al., 2001) Syncoilin, which is an atypical type III intermediate filament protein belonging to the intermediate filament superfamily. The absence or malfunction of Syncoilin may cause the disruption of the intermediate filament network, eventually leading to cell death (Poon et al., 2002). Recent studies have found that intermediate filament networks contribute to cell adhesion and migration and are associated with tumorigenesis and metastasis (Morgan and Su, 1994; Hendrix et al., 1996; Bouameur and Magin, 2017). Consistently, we observed that SYNC expression was significantly elevated in gastric cancer tissues compared to normal gastric tissues.
In this study, high SYNC expression levels were correlated with gastric cancers of advanced stage and aggressive pathological subtypes, all of which are associated with poor overall survival (Carter et al., 1989; Hanrahan et al., 2007). This study revealed that SYNC expression is markedly higher in patients with advanced gastric cancer than in those with early-stage gastric cancers, and that this elevated expression is also associated with poor overall survival.
GSEA results of the gastric cancer tissues with high SYNC expression showed that enriched gene sets correlate with the CR cytoskeleton. Reportedly, the cell cytoskeleton affects tumor cell migration and metastasis (Fife et al., 2014). As metastasis leads to the death of 90% of patients with cancer, it is one of the most significant subject areas related to cancer (Izdebska et al., 2018). Gastric cancer patients with metastases, including lymph node metastasis and distant metastasis, are classified to more advanced stages (Bollschweiler et al., 2014).
In addition, the GSEA results of the present study for the gastric cancer tissues with a high expression of SYNC revealed that enriched gene sets correlated with the PTEN pathway, the p38 MAPK pathway, the PDGF pathway, the GSK3 pathway, and ERK5 pathway. Recently, a study found that the M2 polarization of macrophages can be induced via activation of the PTEN signaling pathway (Wang et al., 2018). The migration of macrophages into tumors is facilitated by promoting cytoskeleton remodeling (La et al., 2019) via p38MAPK and glucocorticoid signaling, and synergistic activation mediates induction of M2-like TAMs (Schmieder et al., 2011). M2 polarization and proliferation of TAMs is regulated through the ERK5 pathway (Rovida et al., 2008).
In human malignant tumors, TAMs that have differentiated into M2 macrophages act as protumoral macrophages involved in the immunosuppression and activation of tumor cells and contribute to cancer progression (Komohara et al., 2014; Rey-Giraud et al., 2012; Noy and Pollard, 2014; Kumar et al., 2017; Zhang and Li, 2020). Targeting M2-polarized macrophages in the tumor immune microenvironment has been investigated as a novel strategy for tumor treatment; a proapoptotic peptide selectively binding to M2-polarized macrophages has been shown to decrease the number of TAMs and increase tumor survival (Cieslewicz et al., 2013; Vadevoo et al., 2017). As these pathways contribute to the infiltration level of M2 TAMs, we hypothesized that SYNC increases the infiltration level of M2-polarized macrophages.
This was confirmed in the present study as increased infiltration of M2-polarized TAMs was significantly associated with high expression levels of SYNC (Fig. 4A, C), and a significant positive correlation found between the infiltration level of M2-polarized TAMs and the expression of SYNC (Fig. 4B, D). These findings may provide a new clue for future tumor treatment targets.
Epigenetic regulations, including histone modifications and methylation, are important mechanisms underlying gene dysregulation in cancer (Asadollahi et al., 2010; Kwon and Shin, 2011). Based on Illumina 450k methylation array results, we found that the patient group with lower DNA methylation exhibited significantly higher SYNC expression, indicating that epigenetic alterations may contribute to SYNC upregulation in gastric cancer.
To the best of our knowledge, this is the first study to identify a correlation between SYNC expression and clinical features in gastric cancer and exploring related mechanism. Of note, SYNC may serve as an independent prognostic factor for poor overall survival in gastric cancer. Our study provides a new insight that SYNC played a valuable role in the prognosis of gastric cancer, which may have an influence on the signaling pathway.
Conclusions
The results of this study demonstrate that SYNC is highly expressed in gastric cancer and is an indicator of poor prognoses for gastric cancer patients. Elevated SYNC expression likely contributes directly to tumorigenesis and enhances the infiltration level of M2-polarized macrophages in the gastric tumor immune microenvironment. Hypomethylation contributes to upregulated expression of SYNC. In summary, SYNC represents a novel prognostic marker or therapeutic target for gastric cancer.
Footnotes
Acknowledgments
This study is in whole or part based on data generated by multi public datasets, including the Cancer GenomeAtlas (TCGA), Genotype-Tissue Expression (GTEx), the HPA, Kaplan-Meier plotter (KM plotter), the Gene Expression Profiling Interactive Analysis (GEPIA), and the Gene Expression Omnibus dataset (GEO). Use of the databases in this study was performed in accordance with these dataset ethics and publication policy, as outlined in the TCGA (http://cancerge-nome.nih.gov/), GTEx (https://gtexportal.org/), HPA (www.proteinatlas.org/), KM plotter (www.kmplot.com), GEPIA (http://gepia.cancer-pku.cn/), and GEO ( ).
).
Funding Information
This study was supported by Qingdao Medical Research Plan Projects (2017-WJZD012); Qingdao Outstanding Health Professional Development Fund ([2014]8); and Qingdao Science and Technology Plan Projects (KZL-22).
Author Disclosure Statement
No competing financial interests exist.