




Abstract
Objective:
To study the correlations between the genotypic and allelic frequencies of the Sirtuin 1 (SIRT1) gene rs182180876, rs4746720, and rs2234975 loci and susceptibility to diabetic nephropathy.
Methods:
We used Sanger sequencing to analyze the genotypes of the rs182180876, rs4746720, and rs2234975 loci within the SIRT1 gene in 280 diabetic nephropathy patients and 280 diabetic patients without kidney disease who acted as the control group. Plasma SIRT1 levels were analyzed by enzyme-linked immunosorbent assay, and hsa-miR-126-5p, hsa-miR-2115-3p, and hsa-miR-200a-3p in plasma were detected by quantitative real-time polymerase chain reaction levels.
Results:
SIRT1 rs182180876 locus G allele carriers were 3.21 times more likely to suffer from diabetic nephropathy than carriers of the C allele (95% confidence interval [CI]: 2.08-4.95, p < 0.01). Carriers of the T allele at the rs2234975 locus had a higher risk of diabetic nephropathy than carriers of the C allele (odds ratio [OR] = 2.02, 95% CI: 1.36-3.01, p < 0.01). The SIRT1 three locus CCC haplotype was associated with a decreased risk of diabetic nephropathy (OR = 0.24, 95% CI: 0.13-0.46, p < 0.01), and the CTT haplotype was associated with an increased risk of diabetic nephropathy (OR = 3.19, 95% CI: 1.41-7.22, p = 0.01). The plasma SIRT1 levels of patients with diabetic nephropathy were lower than those of the control group (p < 0.001). The plasma SIRT1 levels were lower in SIRT1 rs182180876 locus G allele carriers, rs4746720 locus T allele carriers, and rs2234975 locus T allele carriers than in carriers of the alternate alleles. Diabetic nephropathy patients' plasma hsa-miR-126-5p, hsa-miR-2115-3p, and hsa-miR-200a-3p levels were higher than those of the control group (p < 0.001). Plasma SIRT1 levels were negatively correlated with hsa-miR-126-5p, hsa-miR-2115-3p, and hsa-miR-200a-3p levels (r = −0.90, −0.77, −0.92, −0.83, −0.87, −0.87).
Conclusion:
The SIRT1 loci rs182180876, rs4746720, and rs2234975 single nucleotide polymorphisms are significantly associated with the risk of diabetic nephropathy.
Clinical Trials.gov ID: 2016-ZJ002-01.
Introduction
In recent years as the incidence rate of diabetes has continued to climb, the complications of the disease have garnered increasing attention (Zimmet et al., 2016). Diabetic nephropathy is a primary complication of diabetes and the principal cause of end-stage renal disease. Because of its associated high mortality and disability rates, diabetic nephropathy causes serious harm to diabetic patients, as well as to society at large (Hsu et al., 2009).
For years, the treatment strategy for diabetic nephropathy patients was primarily focused on the formation of nonenzymatic glycosylation end products caused by high plasma glucose levels, activation of the protein kinase C signaling pathway, oxidative stress response, and the abnormal renin-angiotensin system (RAS). However, studies have shown that controlling blood sugar levels and/or blood pressure does not prevent the occurrence and development of diabetes nephropathy (Piccoli et al., 2015). Thus, discovering new therapeutic targets for diabetic nephropathy has become an urgent worldwide health problem (Guo et al., 2020; Mou et al., 2020).
SIRT1 is a conserved deacetylase, which is closely related to the energy metabolism and reduction state of cells. In recent years, the understanding of SIRT1 has been expanded beyond nicotinamide adenine dinucleotide-dependent histone/nonhistone deacetylase, to its role in regulating multiple biological processes (Li et al., 2020). Studies have shown that SIRT1 is closely related to the pathogenesis of diabetic nephropathy and that it could act as a potential therapeutic target (Kitada et al., 2013; Polak-Jonkisz et al., 2013). Miyazaki et al. (2008) observed that SIRT1 overexpression can reduce the expression of the ANG II receptor 1 (AT1R) in vascular smooth muscle cells, whereas SIRT1 inhibition increases AT1R expression. SIRT1 regulates AT1R to modulate the RAS through which it reduces blood pressure, thereby slowing the progression of diabetic nephropathy.
The SIRT1 gene is located on chromosome 10q21.3. Recently, reports have been published examining the correlation between SIRT1 gene polymorphisms and diabetic nephropathy. One such report by Zhao et al. (2017) found that the certain SIRT1 rs10823108 gene polymorphisms may lead to an increased risk of diabetic nephropathy in type 2 diabetes mellitus (T2DM) patients. Tang et al. (2017) found that the SIRT1 rs4746720 C allele is a risk factor for urine albumin/creatinine.
In this study, we selected rs182180876, rs4746720, and rs2234975 within the 3′ untranslated region of the SIRT1 gene. Through the use of MirSNP, we found that these three polymorphic loci were all located within the binding site of microRNAs that effect SIRT1 expression levels. Therefore, we hypothesized that these single nucleotide polymorphisms (SNPs) may affect the binding, and hence the regulatory effects of these microRNAs on the SIRT1 mRNA.
Through this case-control study, we explored the genotype and allele frequency of SIRT1 gene rs182180876, rs4746720, and rs2234975 and the susceptibility to diabetic nephropathy.
Methods
Subjects
Between January 2017 and April 2019, 280 patients with type 2 diabetic nephropathy, and 280 patients without nephropathy were selected as the control group based on age and gender matching among patients with T2DM (Supplementary Fig. S1). A diagnosis of diabetes was based on the diagnostic criteria for T2DM as specified by the American Diabetes Association (2019). For all T2DM patients, we calculated their estimated 24-h albumin excretion rate (AER) or urine albumin to creatinine ratio (ACR), which was measured twice, with the average for each patient recorded. Patients with microalbuminuria (30 mg/24 h ≤ AERs <300 mg/24 h or 30 mg/g ≤ ACR <300 mg/g), those with high-diabetic retinopathy or proteinuria (AER ≥300 mg/24 h or ACR ≥300 mg/g) or those diagnosed with advanced kidney disease at least 5 years before starting renal replacement therapy were diagnosed with diabetic nephropathy. Patients with the following diseases were excluded: (1) those with immune system diseases; (2) lactating or pregnant patients; (3) those with mitochondrial diseases; and (4) those with secondary diabetes. All subjects gave their written informed consent, and this study passed the review of the Medical Ethics Committee of Zhuji People's Hospital of Zhejiang Province.
Genotyping
We collected 5 mL of cubital venous blood samples from all patients, of which 2 mL was used to extract genomic DNA. The remaining blood samples were centrifuged at 3000 rpm/min at 4°C for 20 min, and the plasma was pipetted off and stored at −70°C. The genotypes of the rs182180876, rs4746720, and rs2234975 loci of the SIRT1 gene were identified using PCR. The primer sequence information is as follows: rs182180876: 5′-TCA CTG TGG TAG AGC TTG CAT-3′ (forward primer), 5′-GGC CTG TTG CTC TCC TCA TT-3′ (reverse primer); rs182180876: 5′-TGA AGT ACT CAA AAT CTG TTA CGC T-3′ (forward primer), 5′-GCC ACA GTT TTG GAA AAT GCC-3′ (reverse primer). rs2234975: 5′-CCA TTT GCA TGA TGT TTG TGT GC-3′ (forward primer), 5′-TGC AAG TAC TGG TCT GGT GAG-3′ (reverse primer). Simultaneously, PCR amplifications were performed using genomic DNA as a template. The PCR amplification mixture comprised 1.5 mM MgCl2, 50 mM KCl, 10 mM Tris-HCl, 0.2 mM dNTPs, 0.8 U Taq polymerase, and 30 ng of genomic DNA. The final PCR volume was 25 μL. PCR products were genotyped by Sanger sequencing.
Enzyme-linked immunosorbent assay
We carried out enzyme-linked immunosorbent assays (ELISAs) for SIRT1 plasma levels according to the supplier's instructions (Human SIRT1 ELISA Kit, ab171573; Abcam, Cambridge, MA).
Quantitative real-time polymerase chain reaction
We used TRIzol (Invitrogen, CA) to extract total RNA from plasma. Using the extracted RNA as a template, cDNA was synthesized using the iScript™ cDNA synthesis kit (Bio-Rad, Hercules, CA) according to the manufacturer's instructions. We then used the resultant cDNA as a template and the U6 gene as an internal reference to determine the relative expression levels of the microRNAs. Quantitative real-time polymerase chain reaction (qRT-PCR) was performed using SsoFast EvaGreen Supermix (Bio-Rad) and the miRNA-specific primers (Table 1). hsa-miR-126-5p: 5′-GCT GGC GAC GGG ACA TTA T-3′ (forward primer), 5′-CGG CGC ATT ATT ACT CAC GG-3′ (reverse primer); hsa-miR-2115-3p: 5′-TCC ATG ACT CCT GAT GGA GG-3′ (forward primer), 5′-TGA TCC TCA TAC TGC TTC TAG C-3′ (reverse primer). hsa-miR-200a-3p: 5′-GCC CCT GTG AGC ATC TTA CC-3′ (forward primer), 5′-GCG GGT CAC CTT TGA ACA TC-3′ (reverse primer); U6: 5′-CTC GCT TCG GCA GCA CA-3′ (forward primer), 5′-AAC GCT TCA CGA ATT TGC GT-3′ (reverse primer). U6 was used as a standardized control to compare with the expression levels of hsa-miR-126-5p, hsa-miR-2115-3p, and hsa-miR-200a-3p. The expression levels of the microRNAs relative to U6 are represented by 2− ▵▵ Ct method, and each sample was evaluated in triplicate.
Comparison of Clinical Characteristics Between Patients with Diabetic Nephropathy and Control Group
BMI, body mass index; SD, standard deviation; DM, diabetes mellitus; HbA1c, hemoglobin A1c; HDL-C, high-density lipoprotein cholesterol; LDL-C, low-density lipoprotein cholesterol.
Statistical analysis
We used SPSS 20.0 (SPSS, Inc., Chicago, IL) for the statistical analyses. The count data are expressed are n (%), and the statistical analysis used the χ2 test. Continuous variables were expressed as mean ± SD, and the data were analyzed using t-test or one-way analysis of variance (ANOVA). The SIRT1 rs182180876, rs4746720, and rs2234975 loci genotypic frequencies were all consistent with the Hardy-Weinberg equilibrium using a χ2 test for the analyses. Logistic regression was used to analyze the correlations between the SIRT1 rs182180876, rs4746720, and rs2234975 loci alleles and the risk of diabetic nephropathy. The odds ratio (OR) and 95% confidence interval (CI) were calculated and adjusted for age, gender, body mass index (BMI), smoking, drinking, duration of diabetes, hypertension history, and DM family history. Pearson's correlation was used to analyze the correlation between plasma SIRT1 levels and plasma hsa-miR-126-5p, hsa-miR-2115-3p, and hsa-miR-200a-3p levels. All statistical tests were two-sided tests, with p < 0.05 being used as statistically significant.
Results
Clinical information
The clinical characteristics of the 280 diabetic nephropathy patients and of the control group are given in Table 1. Between the patients with diabetic nephropathy and the control group, there were no differences in age, gender, BMI, proportion of alcohol-drinking patients, DM family history, plasma hemoglobin A1c (HbA1c) levels, and total cholesterol levels (p > 0.05). However, the proportion of patients with a history of smoking, hypertension, and elevated low-density lipoprotein cholesterol was significantly higher among the diabetic nephropathy patients than those in the control group. In addition, the duration of diabetes and the high-density lipoprotein cholesterol levels were significantly less and lower, respectively, than those in the control group (p < 0.01).
SIRT1 gene polymorphism and diabetic nephropathy susceptibility
In this study, the genotypic frequency distributions of the rs182180876, rs4746720, and rs2234975 loci of the SIRT1 gene in the control group was consistent with Hardy-Weinberg equilibrium (p > 0.05) Table 2. Carriers of the SIRT1 rs182180876 locus GG genotype were found to have a higher risk of developing diabetic nephropathy (OR = 1.99, 95% CI: 1.60-2.13, p < 0.01) compared with other genotypes at this locus. Under both the dominant model (CG+GG vs. CC) and the recessive model (GG vs. CC+CG), the risk of diabetic nephropathy remains high for G allele carriers (OR = 2.40, 95% CI: 1.48-3.90, p < 0.01; OR = 1.95, 95% CI: 1.57-2.09, p < 0.01, respectively). Carriers of the G allele were 3.21 times more likely to suffer from diabetic nephropathy than carriers of the C allele (95% CI: 2.08-4.95, p < 0.01). Carriers of the TC genotype at rs4746720 of the SIRT1 gene had a lower risk of developing diabetic nephropathy (OR = 0.59, 95% CI: 0.41-0.84, p < 0.01) than those with other genotypes. Under the dominant model (TC+CC vs. TT) also there was a reduced risk of diabetic nephropathy (OR = 0.61, 95% CI: 0.43-0.85, p < 0.01). Carriers of the C allele are at a lower risk of suffering from diabetic nephropathy than those with the T allele (OR = 0.72, 95% CI: 0.56-0.93, p = 0.01). The SIRT1 rs2234975 TT genotype under the dominant model (CT+TT vs. CC) and the recessive model (TT vs. CC+CT) showed an increased risk of diabetic nephropathy (OR = 1.77, 95% CI: 1.24-2.04, p < 0.01; OR = 1.78, 95% CI: 1.14-2.77, p = 0.02; OR = 1.73, 95% CI: 1.21-1.98, p < 0.01). Carriers of the T allele have a greater risk of diabetic nephropathy than those with the C allele (OR = 2.02, 95% CI: 1.36-3.01, p < 0.01).
Diabetic Nephropathy and Control Group SIRT 1 Single Nucleotide Polymorphism Genotype and Allele Frequency Comparison
Adjusted for age, gender, BMI, smoking, drinking, duration of diabetes, hypertension history, and DM family history by logistic regression analysis.
OR, odds ratio. CI, confidence interval.
Hierarchical analysis
Further analyses including age, gender, BMI, smoking, drinking, hypertension history, DM family history of diabetic nephropathy patients and the control group are given in Table 3. In these analyses the increased risk of diabetic nephropathy associated with the SIRT1 rs182180876 locus CG+GG genotypes remained regardless of age, gender, hypertension history, and DM family history (p < 0.05). In subjects with BMI ≥24 kg/m2 (OR = 2.62, 95% CI: 1.55-4.43, p < 0.01), no smoking (OR = 2.50, 95% CI: 1.43-4.36, p < 0.01), and no drinking (OR = 2.17, 95% CI: 1.57-4.79, p < 0.01), the SIRT1 rs182180876 locus CG+GG genotype was also a risk factor for diabetic nephropathy.
SIRT1 Single Nucleotide Polymorphism and Diabetic Nephropathy Susceptibility Hierarchical Analysis
Adjusted for age, gender, BMI, smoking, drinking, duration of diabetes, hypertension history, DM family history by logistic regression analysis.
Patients with the SIRT1 rs4746720 TC+CC genotype had a decreased risk of diabetic nephropathy associated with BMI stratification (p < 0.05). Similarly, in subjects <60 years of age (OR = 0.58, 95% CI: 0.38-0.89, p = 0.02), women (OR = 0.55, 95% CI: 0.34-0.89, p = 0.02), nonsmoking (OR = 0.59, 95% CI: 0.40-0.86, p = 0.01), nondrinking (OR = 0.53, 95% CI: 0.36-0.78, p < 0.01), with no hypertension history (OR = 0.57, 95% CI: 0.35-0.92, p = 0.03), and no DM familial history (OR = 0.57, 95% CI: 0.37-0.88, p = 0.01) with TC+CC genotype showed a decreased risk of diabetic nephropathy.
The SIRT1 rs2234975 locus CT+TT genotype did not increase the risk of diabetic nephropathy in subjects based on BMI, drinking, or DM familial history stratification (p > 0.05). In subjects ≥60 years of age (OR = 2.52, 95% CI: 1.25-5.06, p = 0.01), men (OR = 3.38, 95% CI: 1.67-6.84, p < 0.01), nonsmoking (OR = 1.88, 95% CI: 1.15-3.08, p = 0.02), and with no history of hypertension (OR = 2.29, 95% CI: 1.22-4.31, p = 0.02), this genotype increased the risk of diabetic nephropathy.
Haplotype analyses
A haplotype analysis was performed to assess the relationship among the genotypes of the three SIRT1 gene loci (rs182180876, rs4746720, and rs2234975) and diabetic nephropathy risk (Table 4). Three haplotypes, CTC, CCC, and CTT were formed, of which the CCC haplotype was associated with a reduced risk of diabetic nephropathy, and the CTT haplotype was associated with an increased risk of diabetic nephropathy (OR = 3.19, 95% CI: 1.41-7.22, p = 0.01).
Relationship Between the Haplotypes of rs182180876, rs4746720, and rs2234975 at SIRT 1 and Susceptibility to Sepsis
*SIRT1 rs182180876, rs4746720, and rs2234975 haplotypes.
Adjusted for age, gender, BMI, smoking, drinking, duration of diabetes, hypertension history, and DM family history by logistic regression analysis.
Plasma SIRT1 levels
We used ELISAs to detect the plasma SIRT1 protein levels of the subjects. The results showed that the plasma SIRT1 levels of diabetic nephropathy patients were lower than those of the control group members (p < 0.001; Fig. 1a). The results of the receiver operating curve (ROC) analysis showed that the area under the curve (AUC) of the ROC curve for diabetic nephropathy was 0.86 (95% CI: 0.83-0.89, p < 0.001; Fig. 1b).
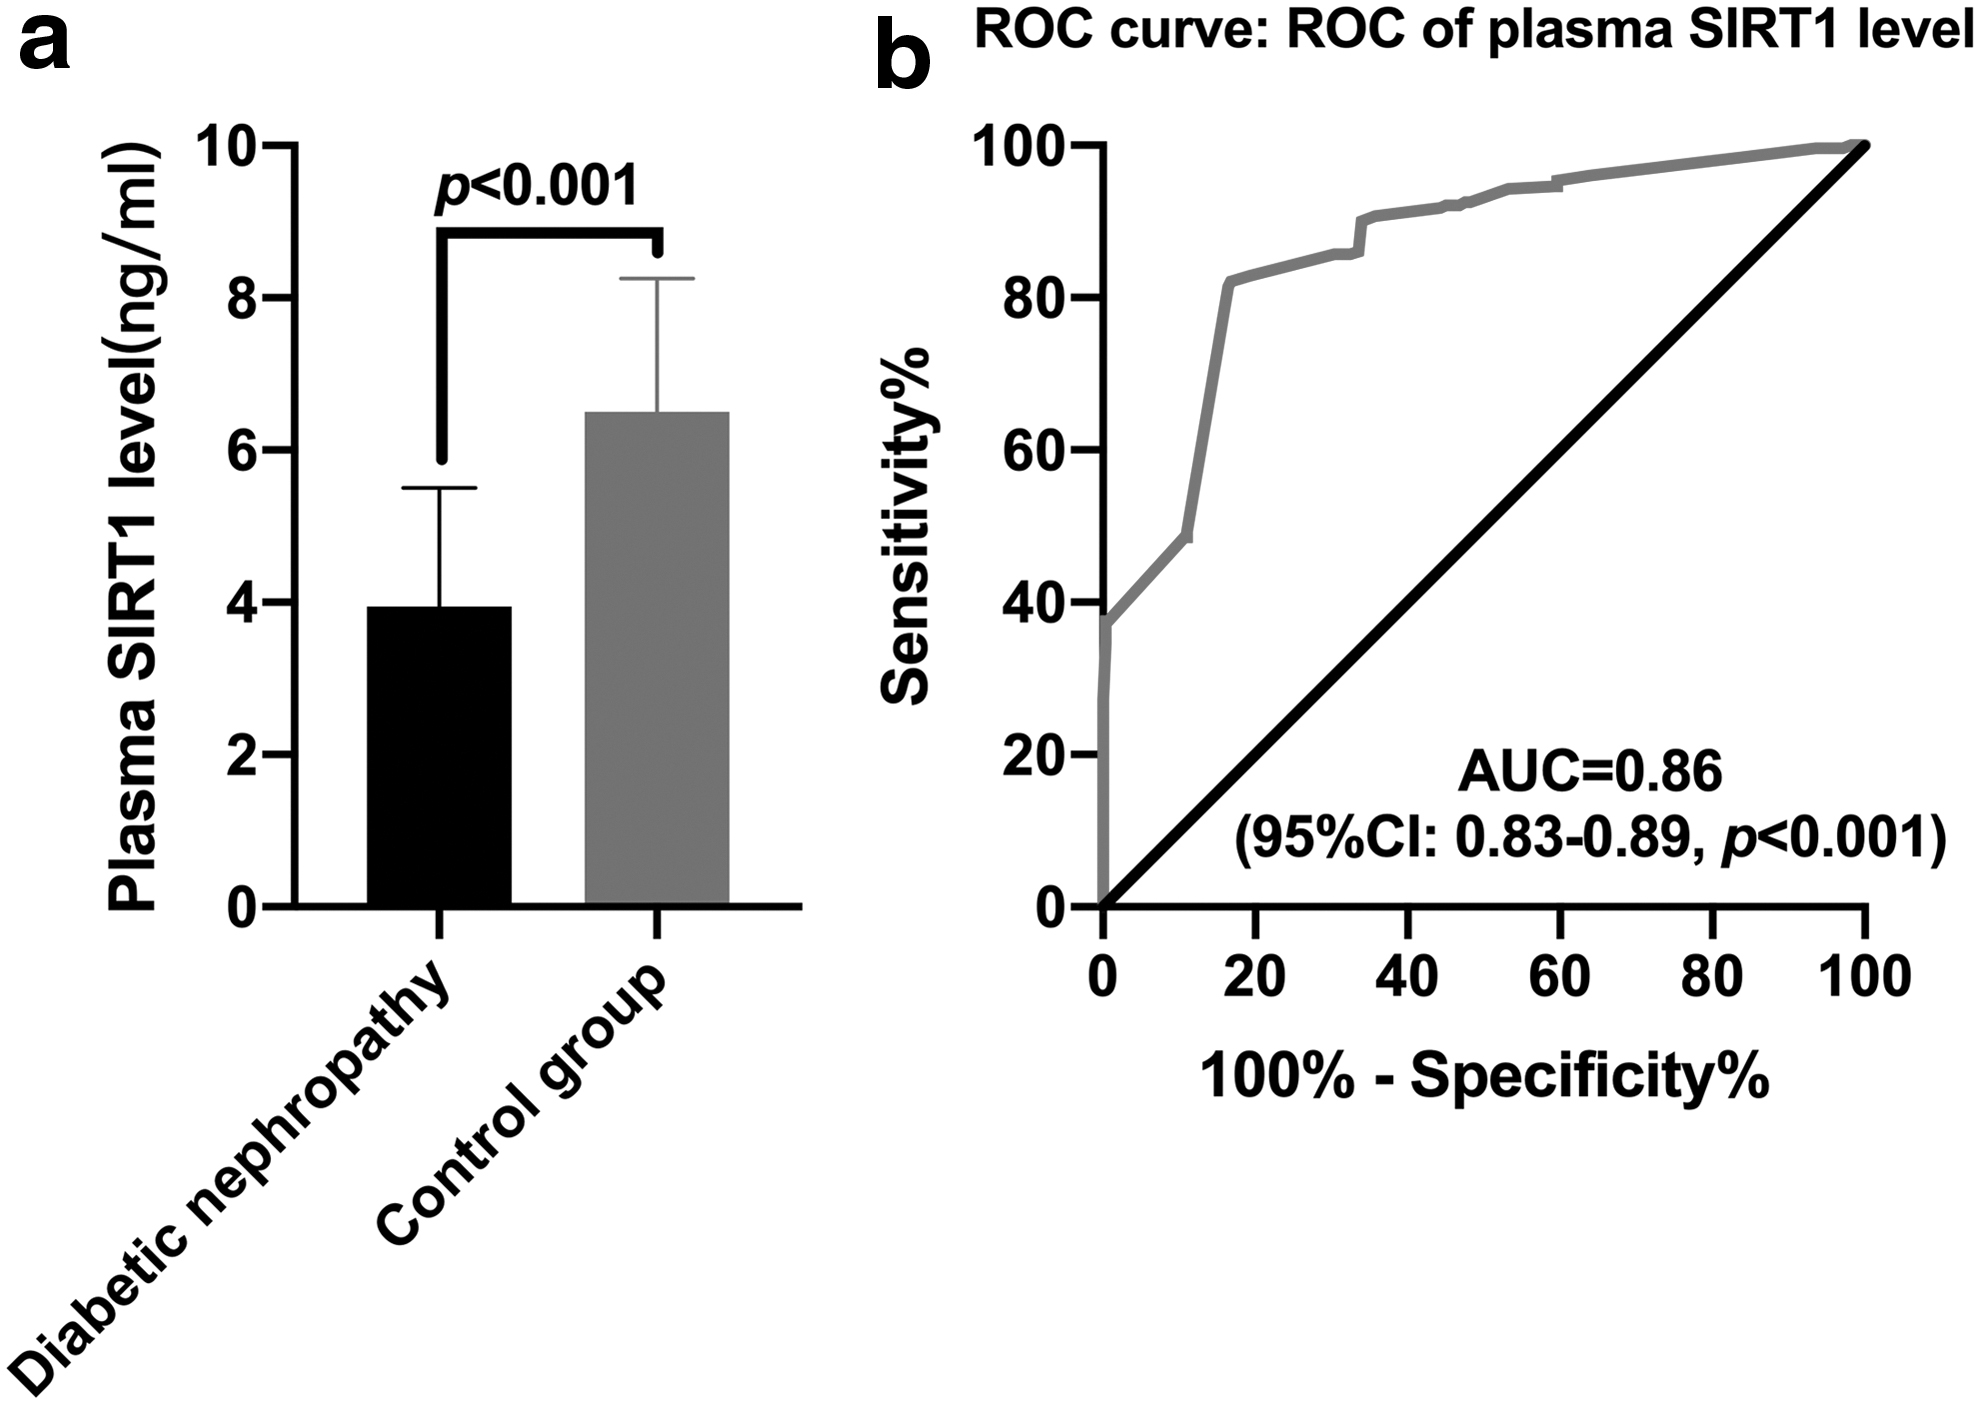
ELISA detection of plasma SIRT1 levels in subjects.
Correlation between plasma SIRT1 levels and SIRT1 genotypes
We carried out analyses to understand the relationship between a patient's plasma SIRT1 levels and their SIRT1 genotypes. A one-way ANOVA showed differences in the SIRT1 levels in the plasma of diabetic nephropathy patients based on their genotypes compared with the control group subjects (p < 0.05; Fig. 2a-f). Diabetic nephropathy patients and the control group patients with the SIRT1 gene rs182180876 locus G allele, rs4746720 locus T allele, and rs2234975 locus T allele had lower SIRT1 levels.

Comparison of plasma SIRT1 levels in subjects with different genotypes at SIRS1 gene rs182180876, rs4746720, and rs2234975.
Plasma microRNAs levels
We used qRT-PCR to detect the levels of hsa-miR-126-5p, hsa-miR-2115-3p, and hsa-miR-200a-3p in plasma. The results showed that the plasma hsa-miR-126-5p, hsa-miR-2115-3p, and hsa-miR-200a-3p levels of patients with diabetic nephropathy were significantly higher than those in the control group (p < 0.001; Fig. 3a-c). ROC analysis showed the area under the ROC (AUC) of plasma hsa-miR-126-5p, hsa-miR-2115-3p, and hsa-miR-200a-3p levels to diagnose diabetic nephropathy are 0.94 (95% CI: 0.92-0.96, p < 0.001; Fig. 3d), 0.95 (95% CI: 0.93-0.97, p < 0.001; Fig. 3e), and 0.93 (95% CI: 0.91-0.95, p < 0.001; Fig. 3f), respectively.
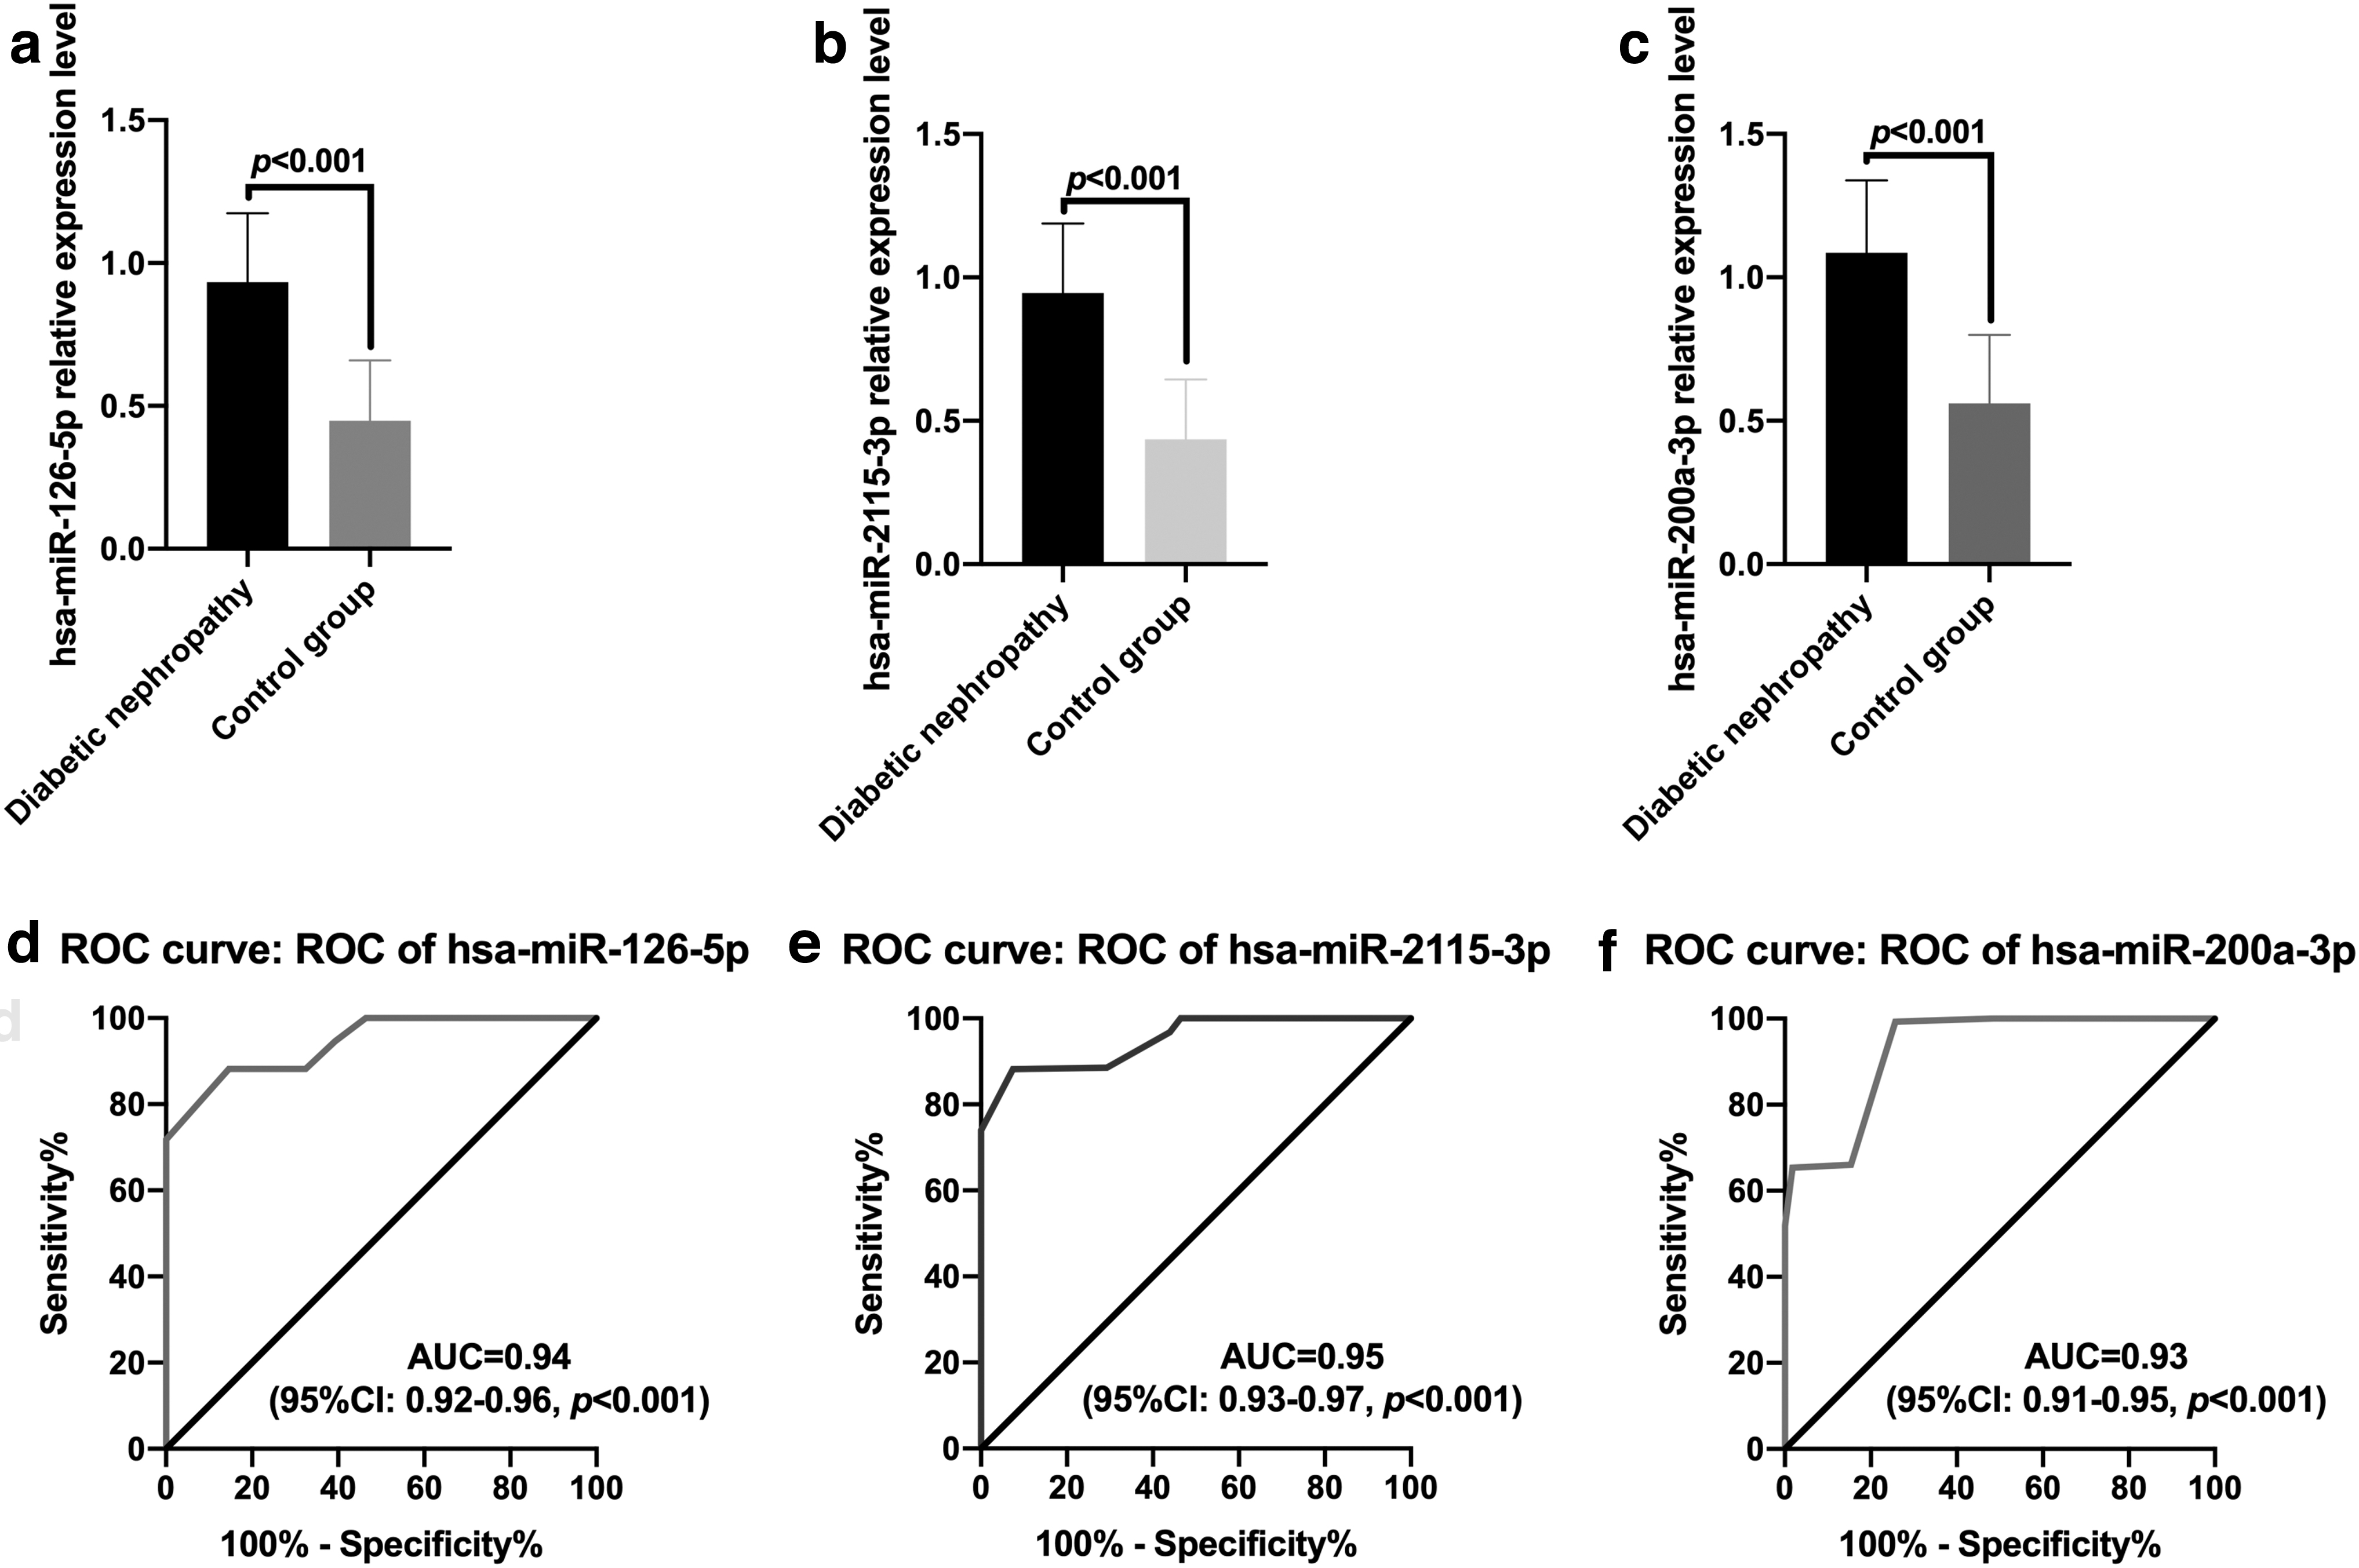
qRT-PCR detects plasma microRNAs levels.
Comparison of plasma microRNA levels with genotypes of the rs182180876, rs4746720, and rs2234975 loci
We analyzed the plasma levels of the test microRNAs in subjects with different genotypes at three SIRT1 loci: rs182180876, rs4746720, and rs2234975. The results showed that the plasma hsa-miR-126-5p level of GG genotype subjects at rs182180876 was higher than that of the CG genotype patients, with the CC genotype patients having the lowest levels (p < 0.05; Fig. 4a). There was also a difference in plasma hsa-miR-2115-3p levels among subjects with the TT, TC, and CC genotypes at rs4746720 (p < 0.05; Fig. 4b). The plasma hsa-miR-200a-3p level of TT genotype subjects was higher than those with the CT genotype, with the CC genotype having the lowest levels (p < 0.05; Fig. 4c).
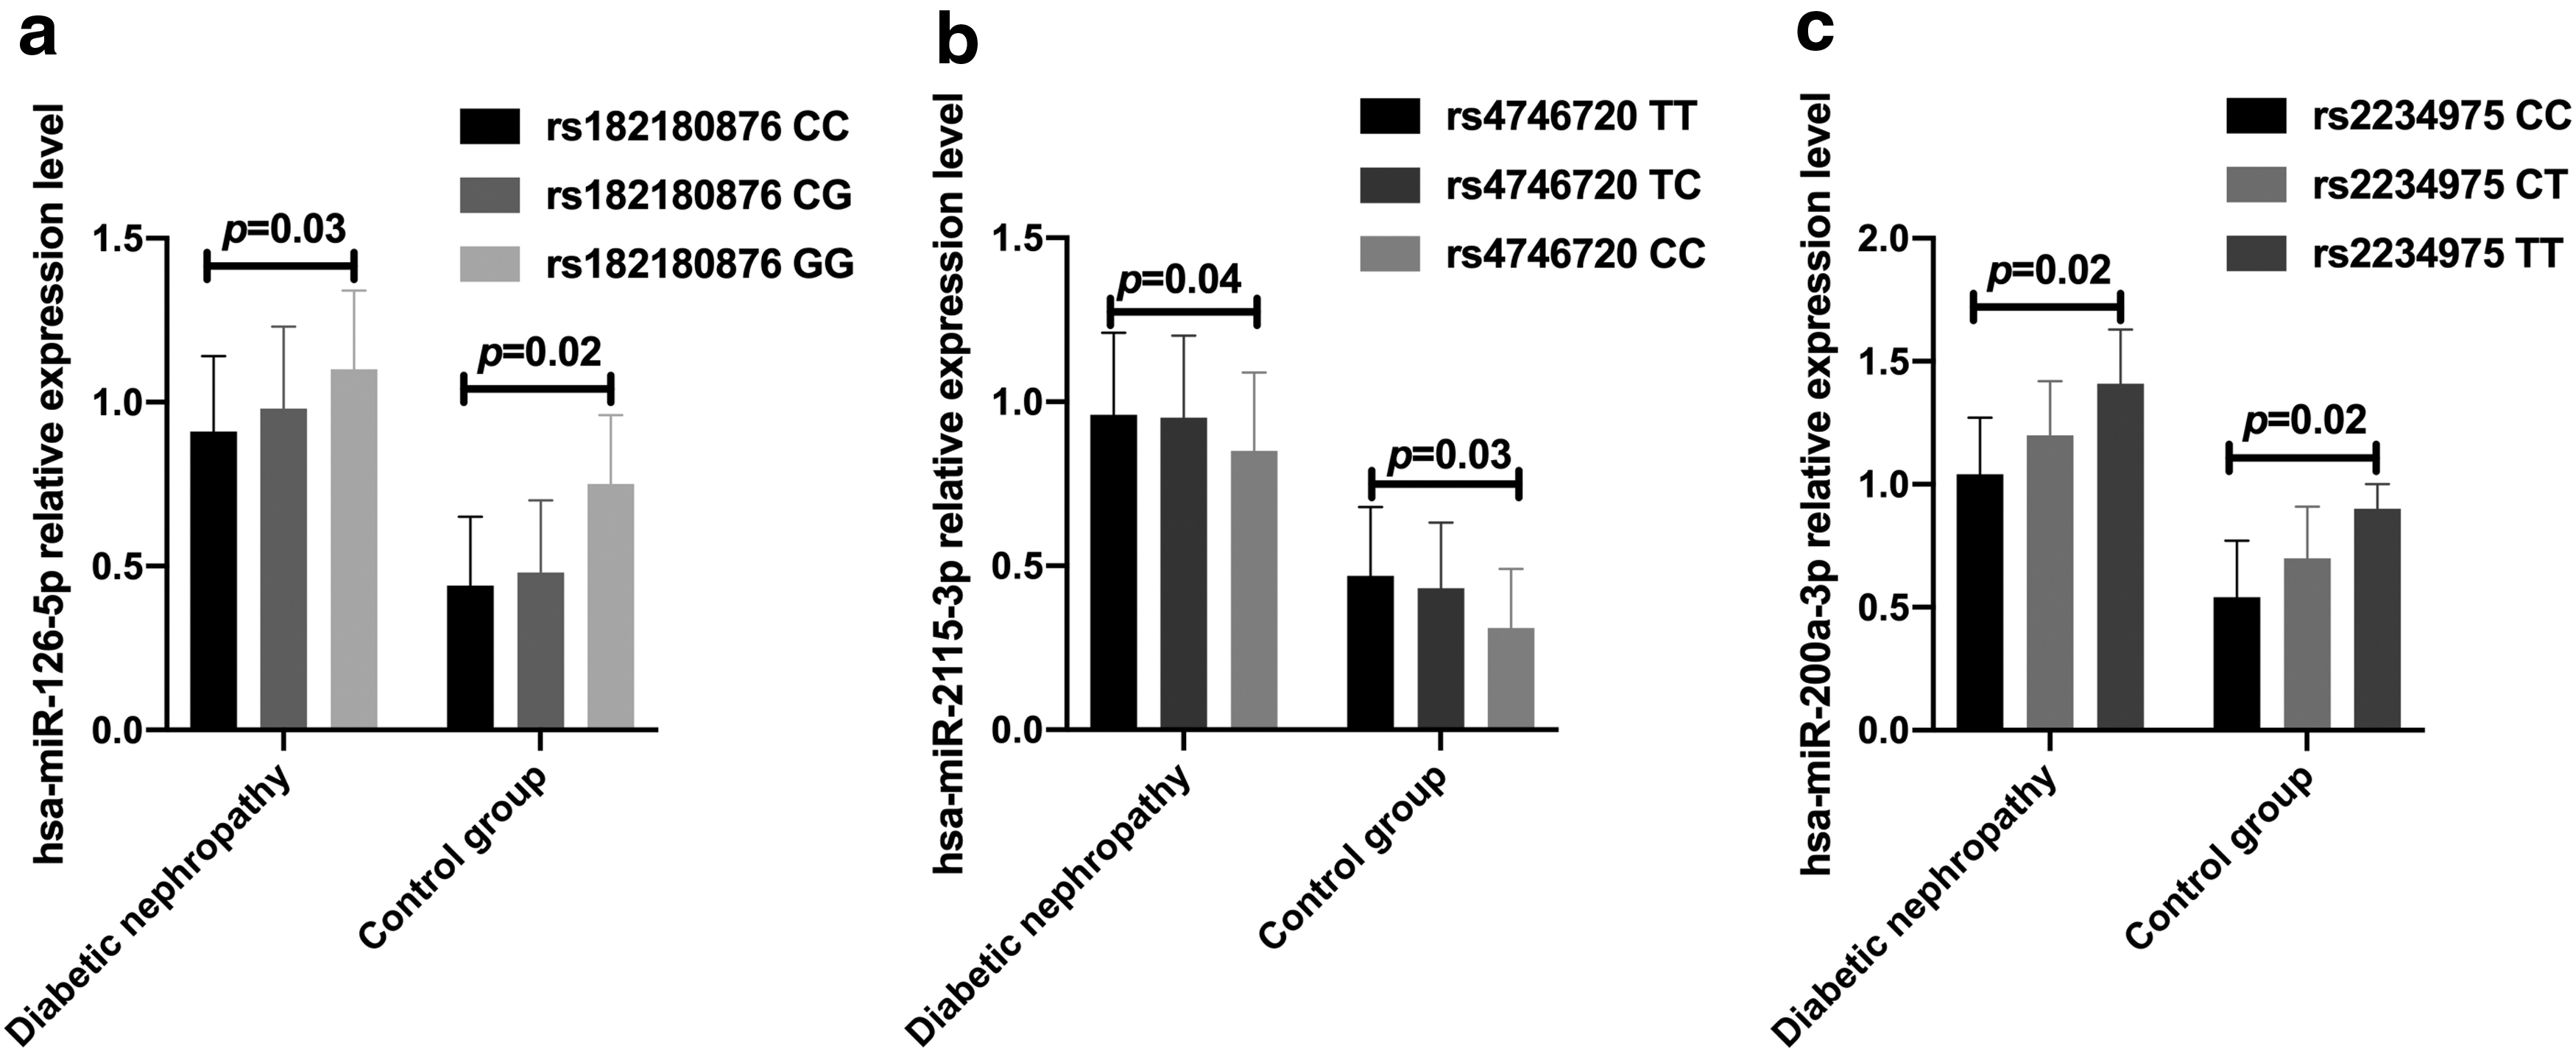
Comparison of plasma microRNAs in subjects with different genotypes at SIRT1 rs182180876, rs4746720, and rs2234975.
Correlation between plasma SIRT1 level and microRNAs level
A Pearson's correlation analysis was used to analyze the correlation between plasma SIRT1 levels and hsa-miR-126-5p, hsa-miR-2115-3p, and hsa-miR-200a-3p levels. The results showed that plasma SIRT1 levels in patients with diabetic nephropathy and the control group were significantly negatively correlated with the levels of hsa-miR-126-5p, hsa-miR-2115-3p, and hsa-miR-200a-3p (r = −0.90, −0.77, −0.92, −0.83, −0.87, and −0.87; all p < 0.001; Fig. 5a-f).
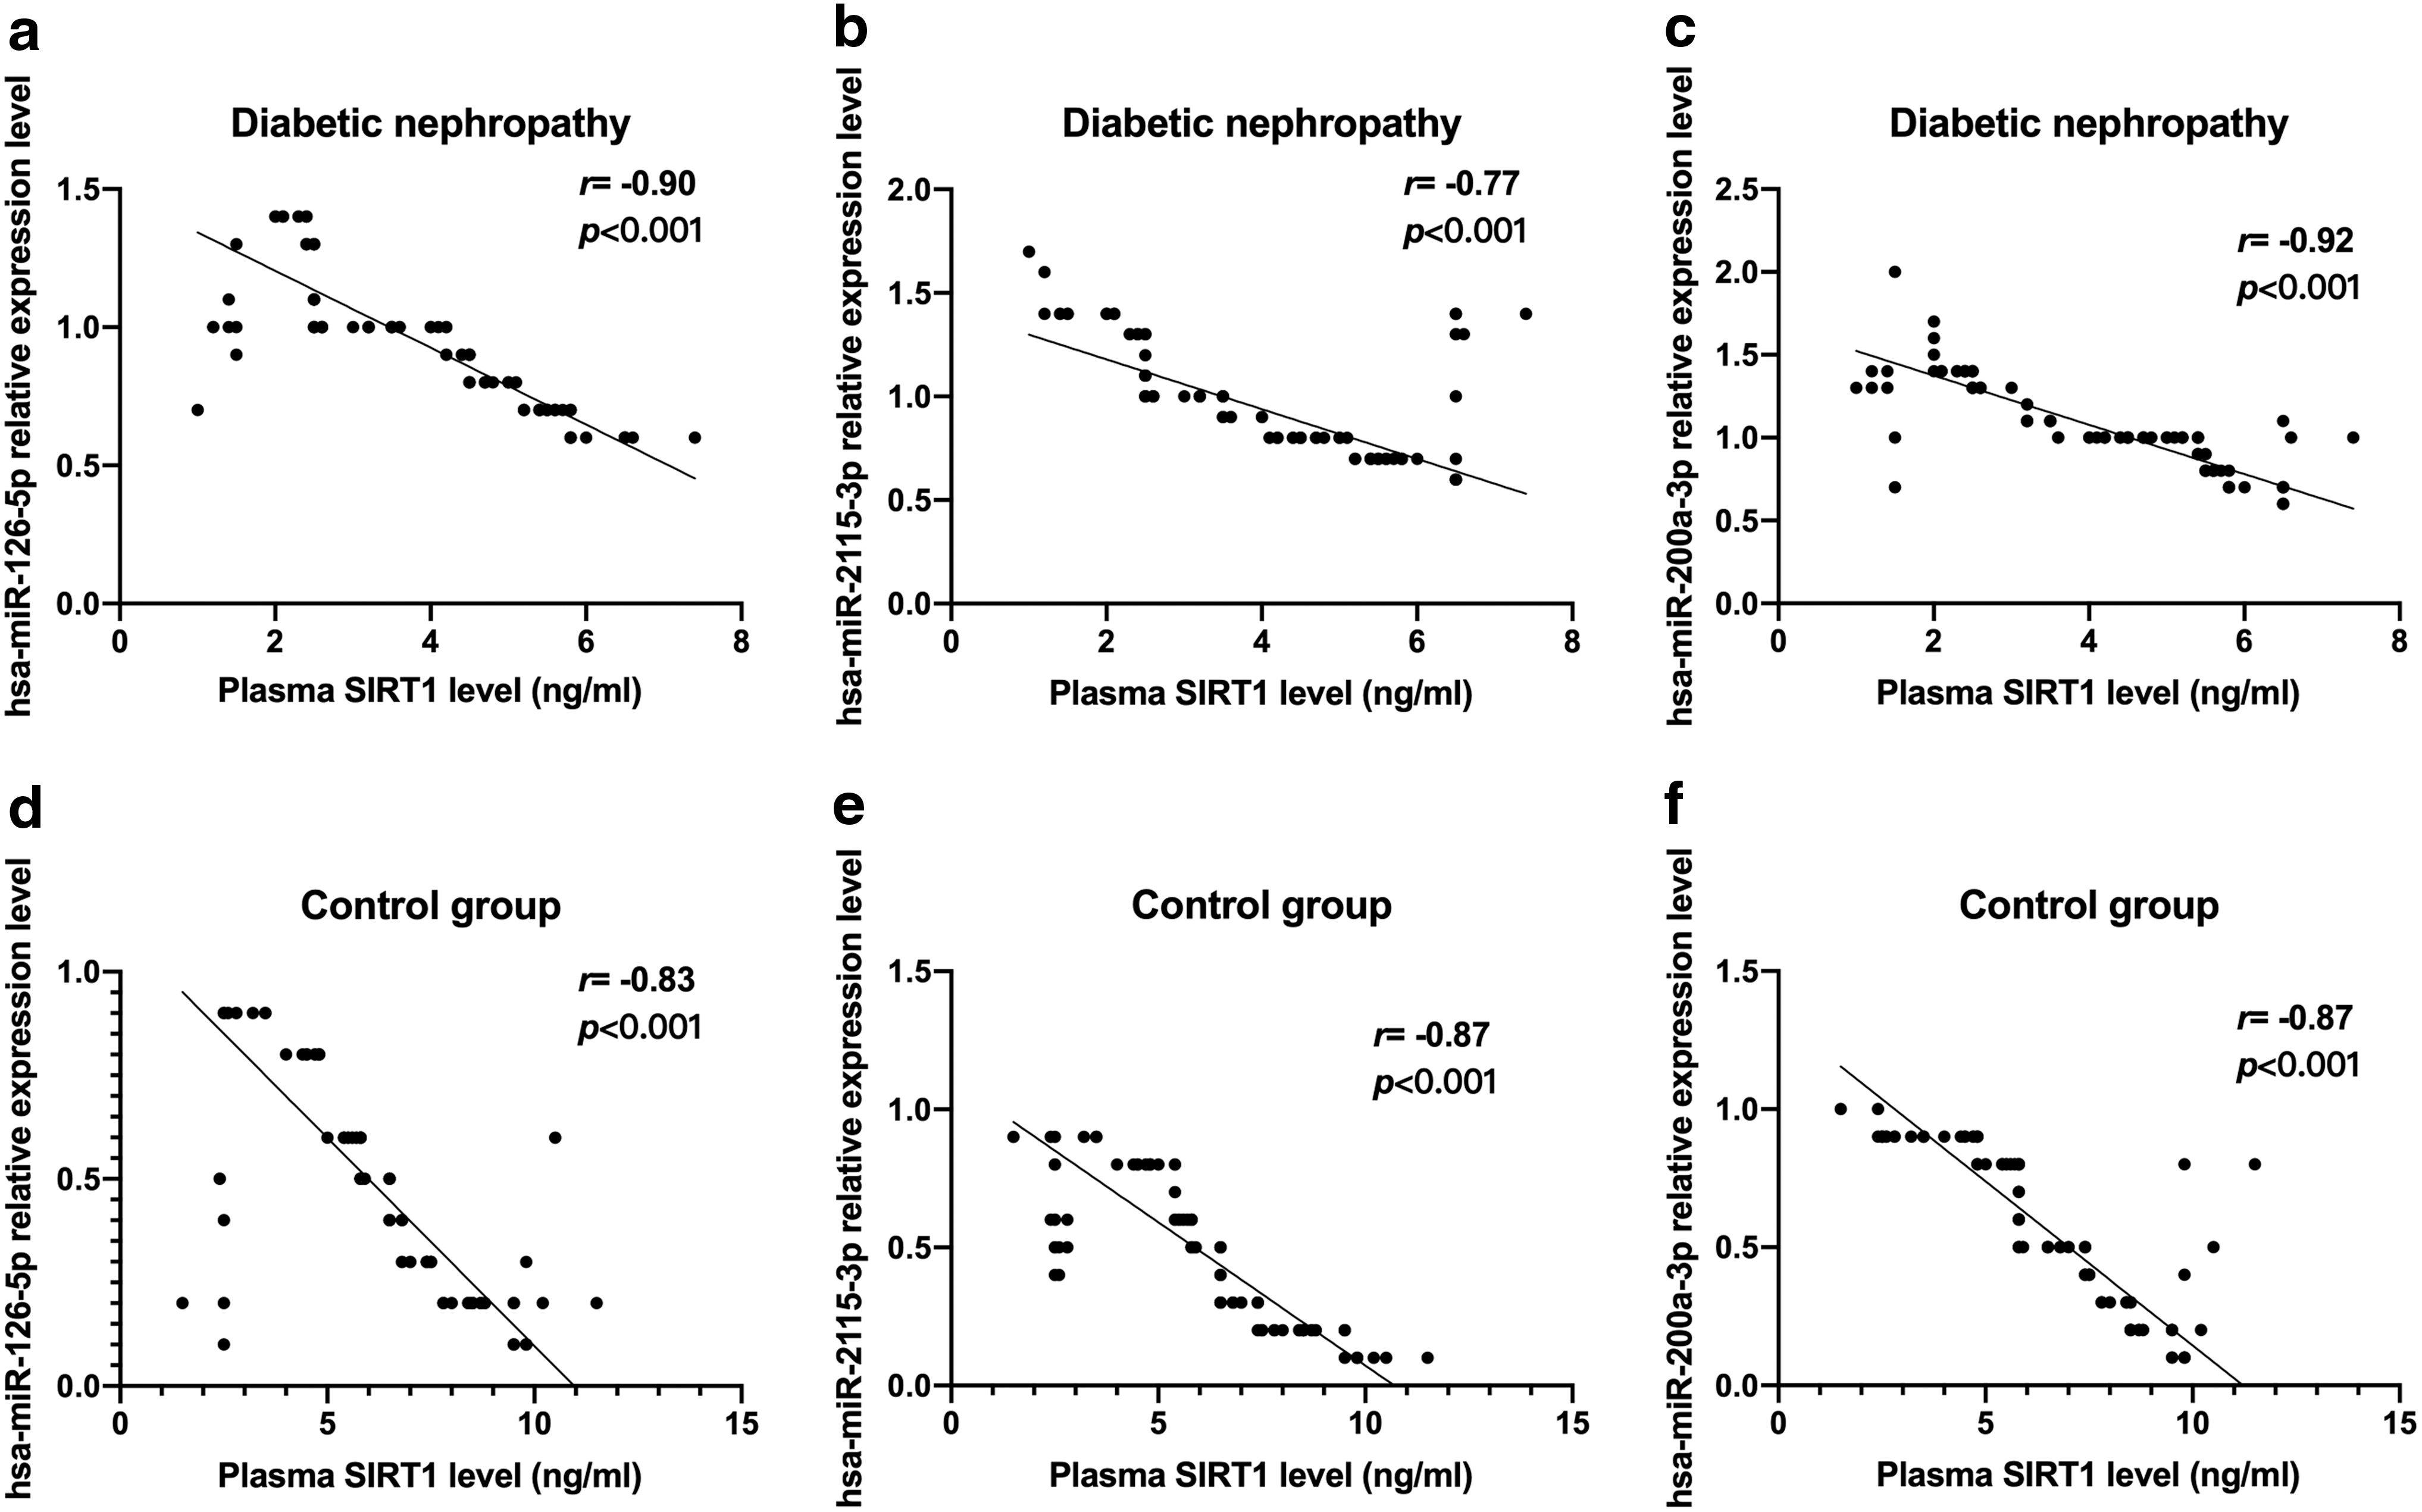
Correlation between plasma SIRT1 levels and hsa-miR-126-5p, hsa-miR-2115-3p, and hsa-miR-200a-3p levels.
Prediction of SIRT1 gene microRNA binding sites
We used the MirSNP tool to predict SIRT1 and hsa-miR-126-5p, hsa-miR-2115-3p, and hsa-miR-200a-3p targeted binding sites (Fig. 6). The results showed that hsa-miR-126-5p and SIRT1 rs182180876 site C allele binding efficiency is lower than the G allele (Fig. 6a). The hsa-miR-2115-3p miRNA binds to the C allele at rs4746720 but not to the T allele (Fig. 6b), and the hsa-miR-200a-3p miRNA binds to the C allele at rs2234975 but not the T allele (Fig. 6c).
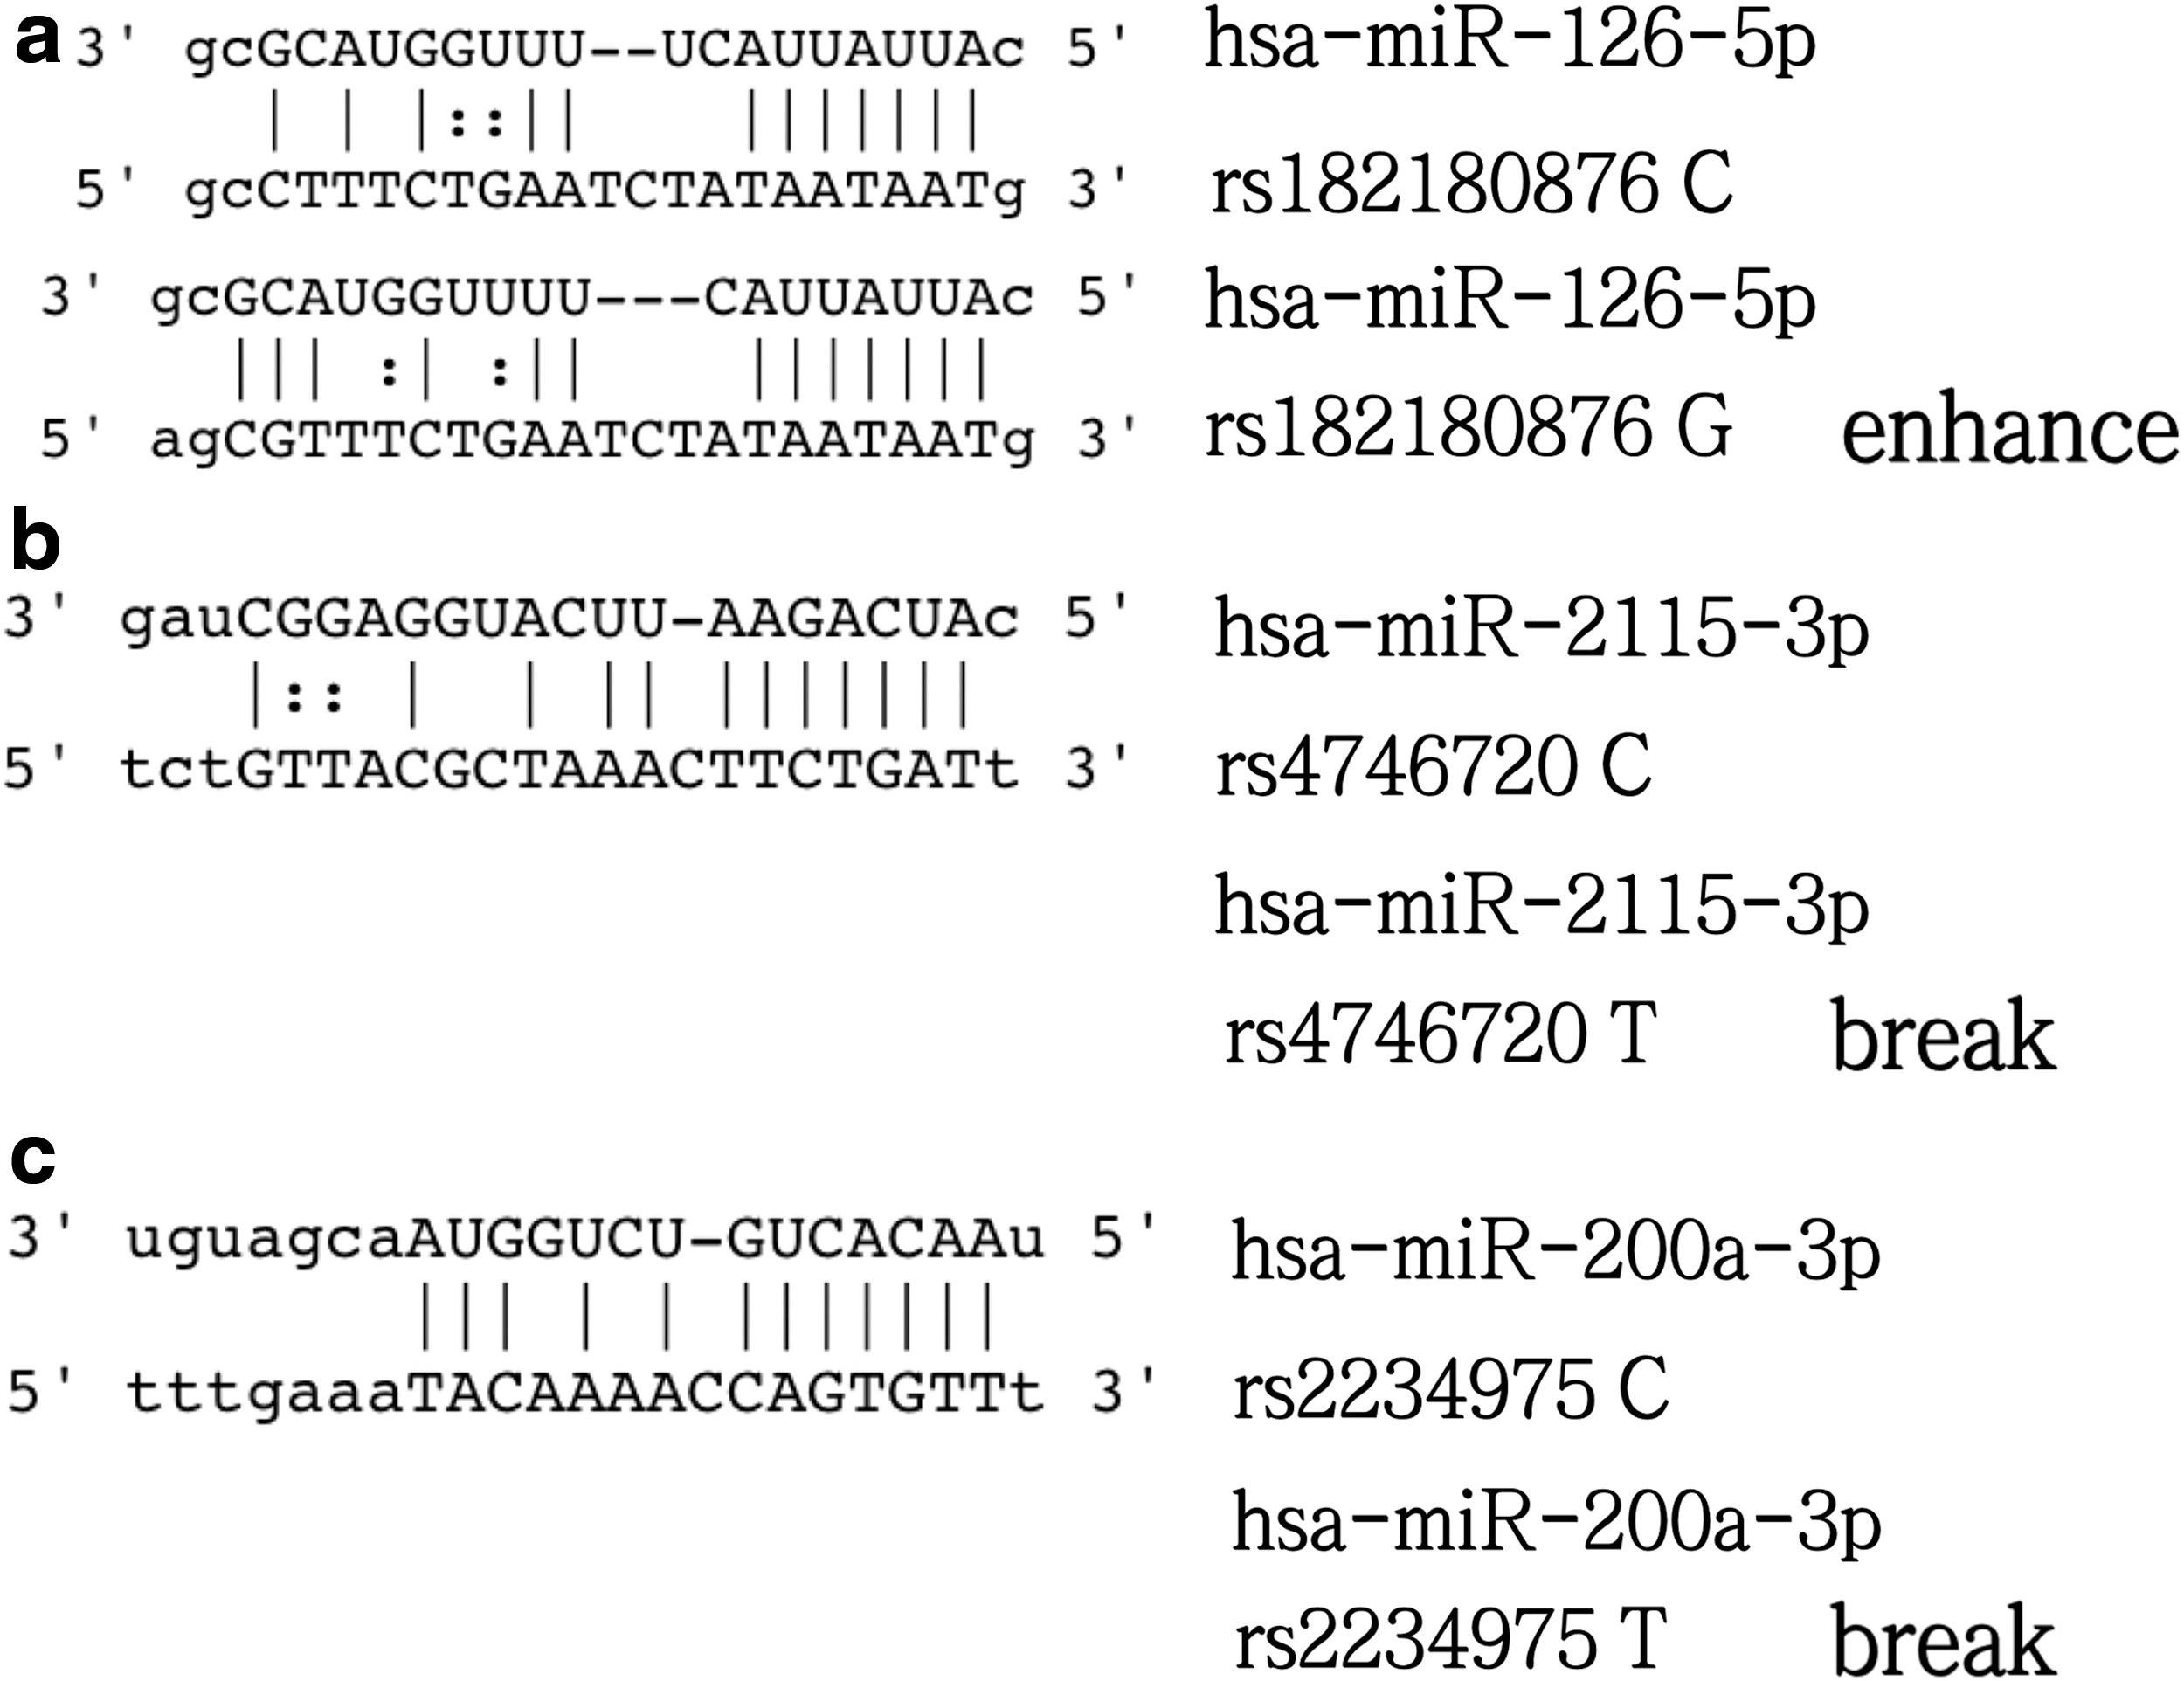
SIRT1 and microRNAs binding site prediction.
Discussion
In this study, we found that the SIRT1 rs182180876 locus G allele, rs4746720 locus T allele, and the rs2234975 locus T allele are each associated with an increased risk of diabetic nephropathy.
The prognosis for diabetic nephropathy patients is poor. We know that diabetic nephropathy is a common cause of death in diabetic patients, and its pathological changes mainly include renal hypertrophy/glomerular basement membrane thickening and glomerular/tubular intercellular matrix accumulation (Dai et al., 2017; Lu et al., 2019). At present, there is insufficient understanding of the pathogenesis of this disease. Previous studies have shown that some inflammatory cytokines secreted by the kidney under normal conditions play an important role in preserving the normal structure of the kidney (Perkins et al., 2007; de Boer et al., 2011); however, when the body is undergoing pathological changes, some inflammatory cytokines are secreted and the kidney structure becomes abnormal (Tervaert et al., 2010).
In recent years, studies have shown that SIRT1 plays a role in multiple signaling pathways related to chronic inflammatory reactions, renal fibrosis, and diabetic nephropathy. Vasko et al. (2014) pointed out in a study of vascular aging and fibrosis that as the endothelial cell SIRT1 is depleted, the expression of matrix metalloproteinase-14 encoded by its target gene decreases, causing vascular endothelial cell dysfunction and promoting glomerular sclerosis and renal dysfunction. Huang et al. (2014) verified that overexpression of SIRT1 can inhibit the overexpression of the extracellular matrix induced by transforming growth factor-β in mesangial cells. The protective effect of SIRT1 on the kidney may be related to its role in the transforming growth factor-β/Smad signaling pathway. Nie et al. (2014) also verified that the transforming growth factor-β/Smad signaling pathway plays an important role in the occurrence and development of diabetic nephropathy.
In this study, we found that the level of SIRT1 in the plasma of patients with diabetic nephropathy was significantly lower than that of a diabetic control group. Further analysis using ROC statistics found that plasma SIRT1 levels are a potential diagnostic indicator of diabetic nephropathy. This study showed that SIRT1 may act as a protective factor for diabetic nephropathy; however, we did not further explore which signaling pathway SIRT1 is involved for its role in renal protection in diabetic patients. SIRT1, as an enzyme with extensive deacetylation function, can regulate the function of kidney cells damaged in a high glucose environment through multiple signaling pathways; promote restoration of energy homeostasis; and regulate the fibrosis and necrosis caused by the loss of signal providing a protective effect on the kidney (Ryu et al., 2019; Shi et al., 2019; Ren et al., 2020).
Our case-control study found that subjects carrying the SIRT1 rs182180876 locus G allele, the rs4746720 locus T allele, and rs2234975 locus T allele were at greater risk of developing diabetic nephropathy. Zeng et al. (2018) found that subjects with CC and TT genotypes at the rs4746720 locus of the SIRT1 have a significantly increased risk of T2DM, especially when eating habits are unhealthy, similar to the results of this study. Using the allelic frequencies of the rs182180876 locus, rs4746720 locus, and rs2234975 locus as the references to calculate the sample sizes necessary for a properly powered study, we found that the minimum number of diabetic nephropathy patients and the control patients were 142 cases/142 cases, 685 cases/685 cases, and 354 cases/354 cases, respectively. Thus, for the latter two loci, sample size needs to be further expanded. A hierarchical analysis showed that stratification of the general clinical characteristics of the subjects influences the degree of correlation between the SIRT1 rs182180876, rs4746720, and rs2234975 genotypes and the risk of diabetic nephropathy. It also shows that genetic and environmental factors are both determinants of diabetic nephropathy. Zhao et al. (2017) found that the SNP at rs10823108 of the SIRT1 and the SNP at rs17446614 of the FoxO1 may lead to the risk of diabetic nephropathy in patients with T2DM. At present, it has become a general consensus that genetic and environmental factors or both play a major role in the course of microangiopathy (Sandholm and Groop 2018; Tsetsos et al., 2020), and the results of this study further prove this point.
With the help of bioinformatics techniques, we found that the hsa-miR-126-5p and SIRT1 rs182180876 locus C allele binding efficiency is lower than the G allele. hsa-miR-2115-3p binds to the C allele of rs4746720 but not the T allele. hsa-miR-200a-3p binds to the C allele at position rs2234975 but not to the T allele. This research suggests that the genotype of the SNPs may affect the binding efficiency of microRNAs to key target genes, which in turn affects expression levels. This may underlie the observed association between the SIRT1 rs182180876, rs4746720, and rs2234975 genotypes and the risk of diabetic nephropathy; however, further mechanistic verification is needed.
In addition, we also determined plasma microRNAs levels. We found that plasma hsa-miR-126-5p, hsa-miR-2115-3p, and hsa-miR-200a-3p levels are potential molecular markers for diabetic nephropathy. Moreover, plasma SIRT1 levels were significantly negatively correlated with hsa-miR-126-5p, hsa-miR-2115-3p, and hsa-miR-200a-3p levels. We speculate that hsa-miR-126-5p, hsa-miR-2115-3p, hsa-miR-200a-3p may have a negative regulatory effect on SIRT1. To verify our hypothesis, we need to use a dual-luciferase reporter gene assay in an in vitro model for confirmation.
The advantages of this study are mainly reflected in the analysis of the possible mechanisms of diabetic nephropathy from the perspective of internal genetic factors through the method of case-control study, which points out the direction for further research on diabetic nephropathy. However, this study also has some limiting factors. First, the results of the analysis of the efficacy of the case-control study show the sample size should be expanded for two of the loci. Second, there is no direct evidence to support the regulation of SIRT1 expression through hsa-miR-126-5p, hsa-miR-2115-3p, and hsa-miR-200a-3p, and the effect of the SIRT1 gene rs182180876, rs4746720, and rs2234975 SNPs on expression regulation needs to be further verified using in vitro and in vivo models.
In summary, in this study we found that the genotypes of the SIRT1 rs182180876, rs4746720, and rs2234975 loci are significantly associated with the risk of diabetic nephropathy, which requires further expansion of the sample size to verify and to explore the specific mechanism of in vitro cell and in vivo animal models.
Footnotes

References
Supplementary Material
Please find the following supplemental material available below.
For Open Access articles published under a Creative Commons License, all supplemental material carries the same license as the article it is associated with.
For non-Open Access articles published, all supplemental material carries a non-exclusive license, and permission requests for re-use of supplemental material or any part of supplemental material shall be sent directly to the copyright owner as specified in the copyright notice associated with the article.
