




Abstract
Background:
Delta-chain (δ-chain) variants are a group of rare hemoglobin (Hb) variants resulting from mutations within the δ-globin gene. Although quantification of Hb A2 levels is a useful screening tool for the beta-thalassemia trait, the coinheritance of a δ-globin gene mutation can lead to misinterpretation of diagnostic results.
Objective:
To identify an unreported Hb A2 variant in Thailand and to develop a high resolution melting (HRM) curve assay for the four δ-globin chain variants found in the Thai population.
Materials and Methods:
Allele-specific polymerase chain reaction (ASPCR) was used to analyze a total of 18 DNA samples for Hb variants comprising 10 wild-type controls, 4 Hb A2-Melbourne, 1 Hb A2-Lampang, 2 Hb A2-Kiriwong, and an unknown variant via HRM assays.
Results:
The unreported Hb A2 variant in Thailand was found to be Hb A2-Walsgrave resulting from δ-globin gene mutation at codon 52 (GAT>CAT). This was also confirmed using ASPCR. In addition, we demonstrated that the HRM curve profile for Hb A2-Melbourne, Hb A2-Lampang, Hb A2-Walsgrave, and Hb A2-Kiriwong could be identified so as to distinguish the mutant alleles from one another and from wild-type alleles.
Conclusion:
This HRM assay detected both known and unknown mutations with simultaneous differentiation between heterozygous and homozygous alleles on a polymerase chain reaction fragment spanning four of the δ-globin variants found in Thailand. This assay may help to support the prevention and control of thalassemias and hemoglobinopathies in Thailand.
Introduction
Thalassemias and hemoglobin (Hb) variants are the most common genetic disorders worldwide. The thalassemias are classified based on which globin gene is defective, with the two major types being α-thalassemia and β-thalassemia. Hb variants contain abnormal globin chain structures resulting from point mutations of their corresponding globin genes. These variants are classified by defective globin genes as α-chain, β-globin chain, and δ-chain variants (Weatherall and Clegg, 2001; Farashi and Harteveld, 2017). Currently, more than 1000 Hb variants have been identified worldwide, with more than 35 in Thailand (Srivorakun et al., 2014). Hb variants are generally asymptomatic, but some can cause severe clinical symptoms, such as in cases of sickle cell disease or other hematological conditions, including erythrocytosis and methemoglobinemia (Thom et al., 2013).
Hb A2 variants, also referred to as δ-chain variants, result from mutation of the δ-globin gene that is located on chromosome 11. The two δ-chain globin subunits associate with two α-globin chain subunits to form Hb A2 (α2δ2). Healthy individuals have blood Hb A2 proportions of 2.5-3.5%, while individuals with the β-thalassemia trait have an Hb A2 proportion of >3.5% (Mosca et al., 2009).
Individuals who are heterozygous for δ-globin gene mutations have little or no symptoms and are not at risk of having a fetus with severe thalassemia syndromes. The low Hb A2 level in case of a δ-thalassemia resulted from reduced synthesis from the δ-globin chain, while the low Hb A2 level with minor Hb A2 fractions resulted from synthesis of the abnormal δ-globin chain (δ-chain variant). Alpha-thalassemia is associated with post-translational modifications in the assembly of the Hb A2 tetramer due to a decreased synthesis of α-globin chains. Iron deficiency (ID) is associated with a lack of iron within the cell that can reduce α-globin chain synthesis compared to non-α globin chains (β or δ and γ-globin chain). β-globin chains can compete to assemble α-globin chains the HbA tetramers rather than δ-globin chains, resulting in reduced levels of Hb A2 (Passarello et al., 2012).
In Thailand, prevalence of β-thalassemia carriers is up to 5.3% on average and ranges from 3% to 9%. These individuals have coinherited β-thalassemia and δ-globin gene mutations. Since they do not have elevated Hb A2 levels, they may be misdiagnosed as having the α-thalassemia trait or ID (Moumni et al., 2014).
More than 100 δ-chain variants and thalassemias involving the delta globin gene mutation have been described in the HbVar database (http://globin.cse.psu.edu). In Thailand, three Hb A2-variants have been reported, namely Hb A2-Melbourne (HBD:c.130G>A), Hb A2-Lampang (HBD:c.142A>G), and Hb A2-Kiriwong (HBD:c.233A>G) (Chaibunruang et al., 2012; Panyasai et al., 2015; Nuinoon et al., 2017). These are all the δ-chain variants identified thus far in Thailand.
High resolution melting (HRM) analysis is a robust, simple, quick, and cost-effective technique for scanning genetic variations. During a process involving gradual temperature increases and heteroduplex formation of the polymerase chain reaction (PCR) product, the fluorescence signal of the PCR mixture is measured and monitored during the dimerization of single-stranded DNA using a saturated DNA-intercalating dye. The resulting melting curve is analyzed using the software of the platform's manufacturer. The melting curve of the PCR product depends on its melting temperature, which is affected by its guanosine and cytosine content, length, and sequence composition. This method can detect different sequence variations in PCR products from variations in the shapes of the DNA melting curves (Prajantasen et al., 2015).
The objectives of this study were to describe the molecular analysis and hematological data of an unreported Hb A2 variant found in Thailand, develop an HRM assay for δ-globin chain variants among the Thai population, and report on a case of Hb A2-Walsgrave in a pregnant woman in southern Thailand. This assay could be useful for supporting the prevention and control of thalassemias in Thailand.
Materials and Methods
Specimen, hematological data analysis, and DNA analysis
Ethical approval of the study protocol was obtained from Health Science Human Research Ethics Committee, Prince of Songkla University (project no. HSc-HREC-62-006-1-1). All subjects included in the study provided their written informed consent.
A total of 18 samples were analyzed, including five leftover genomic DNA samples that were suspected of carrying δ-gene variants due to minor Hb A2 fractions presenting on electrophoregrams or chromatogram using automated capillary electrophoresis (Capillarys Minicap Flex Piercing; Sebia, Lisses, France) or an automated high-performance liquid chromatography (HPLC) analyzer (Variant; Bio-Rad Laboratories, Hercules, CA) from previous studies (Project no RD61075). Of these, five samples were subjected to allele-specific PCR (ASPCR) for identification of Hb A2-Melbourne and Hb A2-Lampang (Panyasai et al., 2015). Four of the five samples were heterozygous for Hb A2-Melbourne and one for Hb A2-Lampang. Two DNA plasmids containing the region of codon 77 (CAC>CGC) corresponding to heterozygous and homozygous Hb A2-Kiriwong were synthesized by Integrated DNA Technologies Pte. Ltd. (Singapore Science Park II, Singapore). Eleven leftover ethylenediamine tetraacetic acid (EDTA) blood samples from the Medical Technology Service Center (MTSC) and Hat Yai Hospital were derived from 10 individuals with normal electrophoregrams, while one showed minor Hb A2 fractions presenting on an electrophoregram with a negative result for Hb A2-Melbourne and Hb A2-Lampang by ASPCR. This EDTA blood sample was diagnosed as an unknown Hb A2-variant and further characterized by DNA sequencing. Hematological parameters of this unknown Hb A2-variant were recorded using a standard blood cell counter (Sysmex KE-2100; Sysmex Corporation, Kobe, Japan).
All of the EDTA blood samples were extracted using a commercially available kit (GF-1 Blood DNA Extraction Kit, Malaysia). The concentration of DNA was determined using a NanoDrop 2000/2000c Spectrophotometer (NanoDrop).
The mutation of six common α-thalassemias (α-thalassemia 1 [SEA and THAI deletions], α+-thalassemia [-α3.7 and -α4.2]), Hb Constant Spring, Hb Paksé mutations, and 10 common β-thalassemia mutations (CD41/42 [-TTCT], CD17 [A-T], CD19 [A-G], IVSI-5 [G-C], IVSI-1 [G-T], -28NT [A-G], CD 71/72 [+A], CD35 [C-A], IVSII-654 [C-T], and 3.5 Kb deletion) were also screened in our laboratory using previously described PCR methods (Panyasai et al., 2015).
Identification of unknown Hb A2-variant by direct sequencing
DNA sequencing was performed for one remaining unknown Hb A2-variant using the primers G58 (5′-AGGGCAAGTTAAGGGAATAG-3′) and F16 (5′-TCTCCTGGACTCACCCTGAA-3′) for amplification of the 713 bp δ-globin gene fragment, as described in previous studies (Chaibunruang et al., 2012). PCR products were sequenced with BigDye Terminator v3 Sequencing Kit (Thermo Fisher Scientific) and then analyzed on the ABI Prism 3730xl Genetic Analyzer (Applied Biosystems). Output sequences of DNA strands were aligned using Sequence Scanner Software 2 (Applied Biosystems).
Primer design for confirmation of Hb A2-Walsgrave by ASPCR and for simultaneous identification of four Hb A2-variants by HRM assays
HBD gene was taken for the designing primers. The HBD gene was derived from gene information bank located in the NCBI online databank (NC_000011.10:c5234483-5232838). Each primer pair was designed according to the Primer-BLAST program (National Center for Biotechnology Information).
Confirmation of Hb A2-Walsgrave by ASPCR
ASPCR was used to confirm the Hb A2-Walsgrave mutation. With this system, the forward primer (F-A2-Walsgrave) was used as a Hb A2-Walsgrave-specific primer (5′-TTGGGGATCTGTCCTCTCCTC-3′) along with the F-16 reverse primer (5′-TCTCCTGGACTCACCCTGAA-3′) to generate a 193-bp fragment. A 578-bp fragment that served as an internal control band was generated using two primers, γ4 and γ5, from previous studies as described elsewhere (Prajantasen et al., 2014). A PCR mixture (total volume 25 μL) was prepared by containing 1.5 mM MgCl2, 10 mM Tris-HCl, 50 mM KCl (pH 8.3),10 pmol of F-16 and F-A2-Walsgrave, 10 pmol of γ4 and γ5, 200 μM of each dNTP, 1.5 U of Taq DNA polymerase (Vivantis, Malaysia), and 50 ng genomic DNA. The amplification reaction was carried out in a Bioer thermocycler (Bioer Technology, Hangzhou, China). After initial heating to 95°C for 3 min, 30 PCR cycles were performed at 95°C for 45 s and 65.7°C for 1 min 30 s. The amplified product was analyzed by 1.5% agarose gel electrophoresis, stained, and visualized under ultraviolet light.
PCR and HRM assays for simultaneous identification of Hb A2-Melbourne, Hb A2-Lampang, Hb A2-Walsgrave, and Hb A2-Kiriwong
Four primers were designed to amplify two fragments of Exon II of the HBD gene. Primers F-DB and R-HRM-D2 were used to generate fragment A for identification of Hb A2-Melbourne, Hb A2-Lampang, and Hb A2-Walsgrave with a 143-bp PCR product, whereas primers F-D2 and R-D1 were used to generate fragment B for identification of Hb A2-Kiriwong with a 102-bp PCR product (Fig. 1 and Table 1).
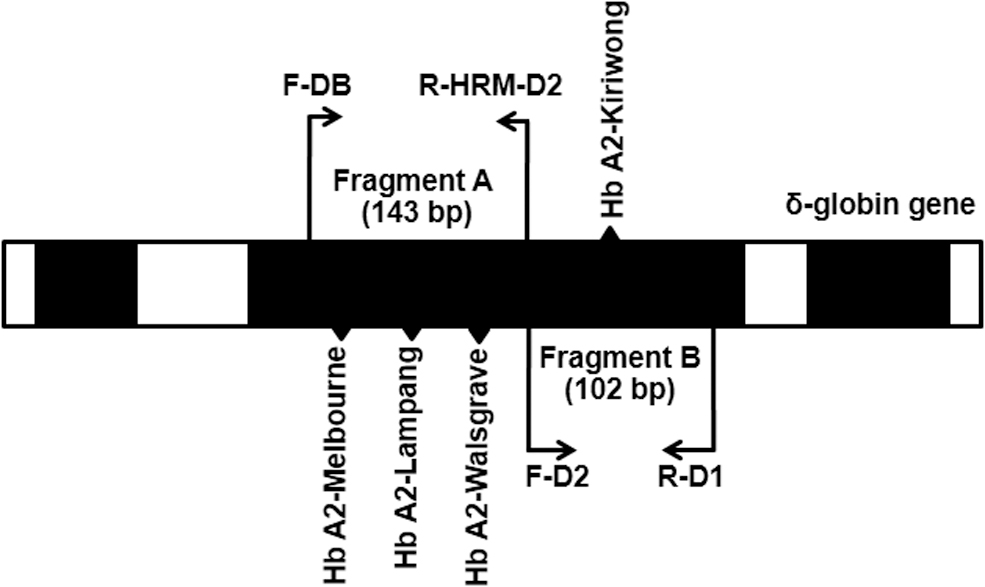
Locations and orientations of primers for the detection of Hb A2-Melbourne, Hb A2 Lampang, Hb A2-Kiriwong, and Hb A2-Walsgrave using HRM analysis. Fragment A (143 bp) and fragment B (102 bp) were the amplified PCR products of Exon II of the δ-globin gene. HRM, high resolution melting; PCR, polymerase chain reaction; Hb, hemoglobin.
Primers Used in High Resolution Melting for δ-Chain Variant Detection
HRM, high resolution melting.
PCR and HRM reaction were performed at the same cycling conditions, and subsequent melt curve program for both sets of primers used a final reaction volume of 20 μL. The reaction mixture contained 1 × HOT FIREPol EvaGreen HRM Mix (Solis BioDyne, Tartu, Estonia), 10 pmol of each primer, and 50 ng genomic DNA. The PCR and HRM were performed with a LightCycler 480 Instrument (Roche Diagnostics, Mannheim, Germany). A total of 32 PCR cycles (15 s at 95°C and 30 s at 60°C) were performed after a 10 min hold at 95°C. In the HRM step, the PCR product was denatured at 95°C for 1 min and reannealed at 50°C for 2 min, followed by melting at a rate of 0.1°C/s from 50°C to 95°C. The fluorescence data were analyzed using the LightCycler 480 Gene Scanning Software Version 4.0 (Roche Diagnostics). This analysis included normalizing the raw melting curve data by setting premelt (initial fluorescence) and postmelt (final fluorescence) signals of all samples to uniform values. Moreover, a temperature shift step was performed. This shifted the normalized curves along the temperature axis to equalize the point at which the double-stranded DNA in each sample became single-stranded DNA. Finally, a difference plot step was performed. This involved subtracting the shifted normalized curves from a reference curve to obtain a clearer indication of the differences in melting curve shapes. The samples were grouped if they had similar melting curve shapes. Validation of the HRM assay using a blinded study on the 18 unknown samples was done under the same conditions.
Results
Of all our DNA samples, six had been previously analyzed using either capillary electrophoresis system or HPLC and showed Hb A, Hb A2, and minor Hb A2 peaks, suggesting the presence of the δ-variant trait. Hb A2-Melbourne and Hb A2-Lampang identifications were performed using ASPCR. Of these six samples, four cases of heterozygous Hb A2-Melbourne and one case of Hb A2-Lampang were identified. The remaining sample as an unknown δ-globin variant tested negative for Hb A2-Melbourne and Hb A2-Lampang. Subsequent analysis of the δ-globin gene in this sample by nucleotide sequencing revealed heterozygosity for a mutation in codon 52 that had not been previously reported in Thailand. Specifically, this was a GAT>CAT mutation resulting in a substitution of aspartic acid for histidine of the δ-globin chain (Fig. 2). It was determined to be Hb A2-Walsgrave. Finally, this Hb A2-Walsgrave mutation was confirmed by ASPCR assay (Fig. 3).
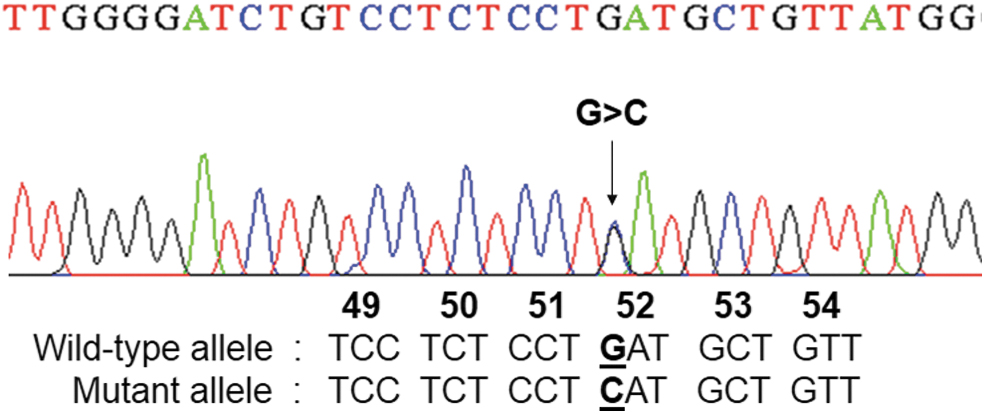
DNA sequence analysis identified a single nucleotide substitution at codon 52 (GAT>CAT) in Exon II of the δ-globin gene. Color images are available online.
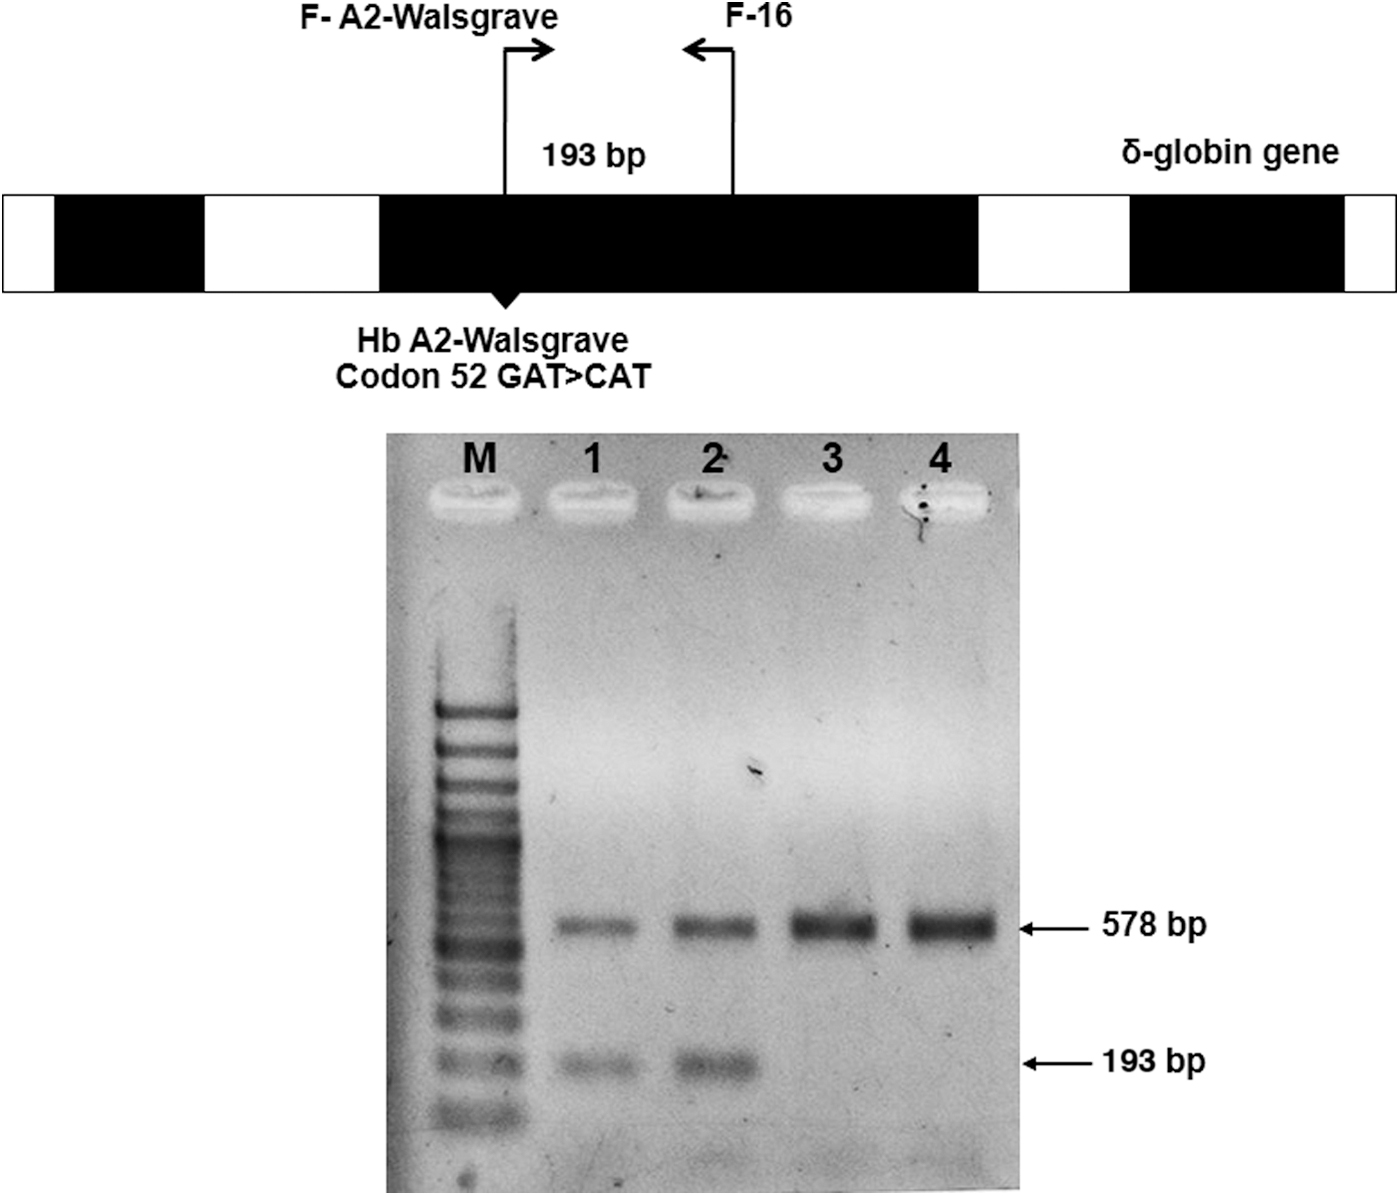
Identification of Hb A2-Walsgrave on the δ-globin gene by allele-specific PCR and the locations and orientations of primers F-A2-Walsgrave and F-16, which produce the 193 bp fragment specific for Hb A2-Walsgrave and 578 bp internal control bands, respectively. M represents 100 bp DNA ladder. Lanes 1 and 2: heterozygous Hb A2-Walsgrave (Thai pregnant women). Lanes 3 and 4: normal individual.
The patient with Hb A2-Walsgrave was a 22-year-old Southern Thai pregnant woman (originally from Chalung subdistrict, Hat Yai District, Songkhla, Thailand) and recruited by the thalassemia research project. The woman's hematological parameters were measured using an automated hematology analyzer as follows: red blood cell count of 4.31 × 10¹²/L, Hb of 11.8 g/dL, packed cell volume of 34.8%, mean corpuscular volume of 80.7 fL, mean corpuscular Hb of 27.4 pg, mean corpuscular Hb concentration of 33.9 g/dL, and RBC distribution width of 13.3%. Hb analysis using the capillary electrophoresis system revealed Hb proportions of 74.7% Hb A, 1.7% Hb A2, and 1.1% Hb A2-Walsgrave (a minor Hb A2 peak) in zone 1 (Fig. 4). The DNA analyses of this patient showed negative results for α-thalassemia (SEA and THAI deletions, -α3.7 and -α4.2), Hb Constant Spring and Hb Paksé mutation, and 10 common β-thalassemia mutations found in Thailand.
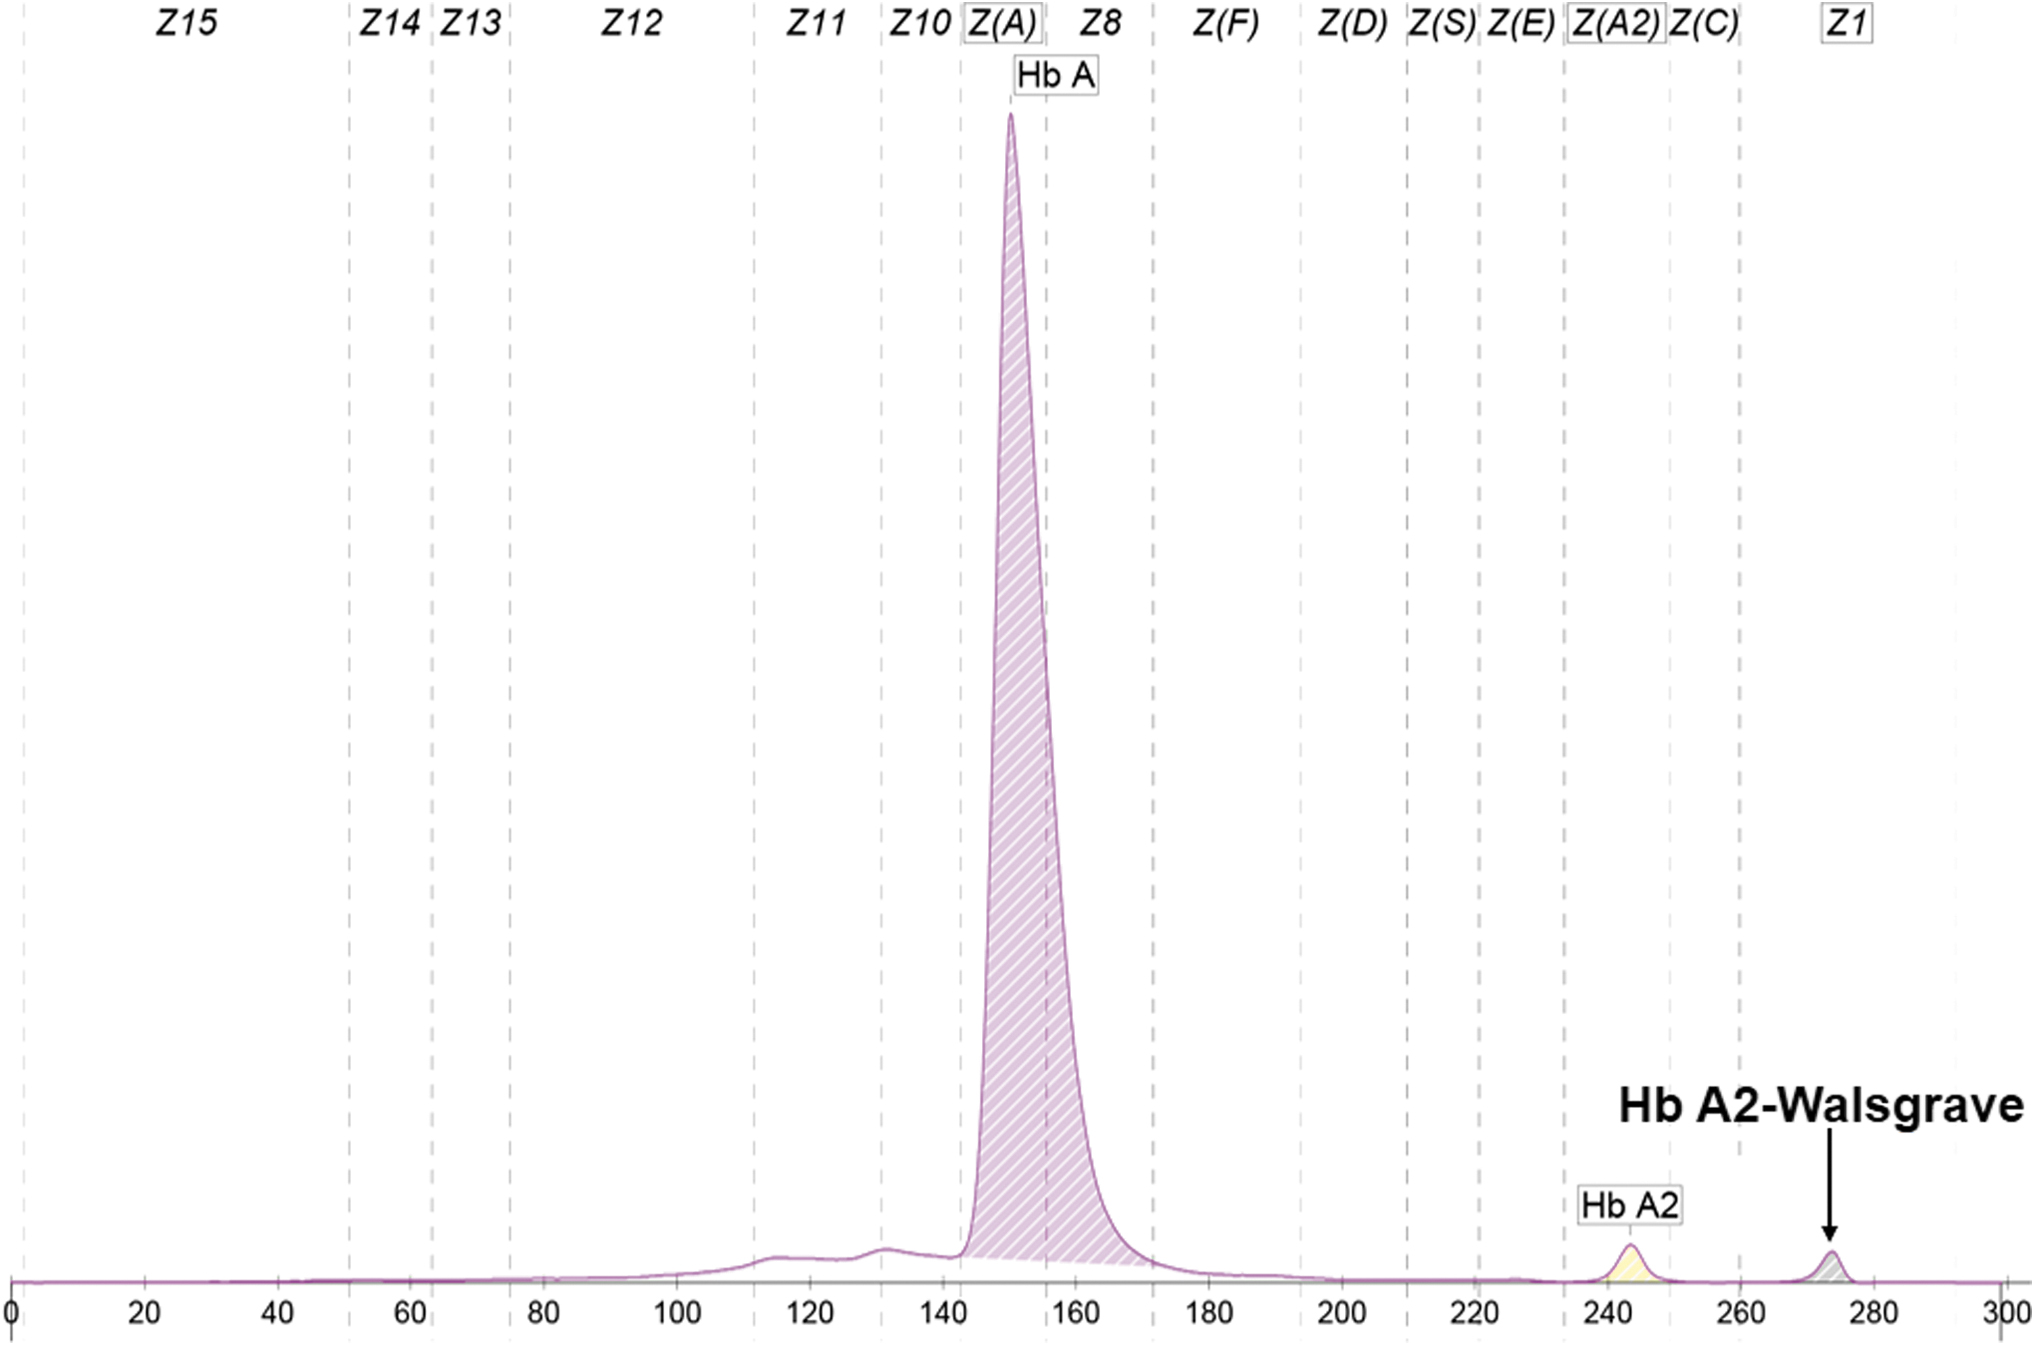
Representative electrophoregram used for the Hb analysis of a patient who was heterozygous for Hb A2-Walsgrave. The peaks shown include Hb A, Hb A2, and a minor Hb A2 peak (corresponding to Hb A2-Walsgrave) at zone 1. Color images are available online.
For the HRM assay, a total of 18 DNA samples were used for optimization, comprising of 10 wild-type controls, four heterozygous Hb A2-Melbourne, one Hb A2-Lampang, one Hb A2-Walsgrave, and two DNA plasmids containing the region of codon 77 (CAC>CGC) corresponding to heterozygous and homozygous Hb A2-Kiriwong, respectively. We demonstrated the presence of a specific HRM curve for the detection of Hb A2 variants. The shape of the HRM curve from the amplification of fragment A was successfully used to identify Hb A2-Melbourne (HBD:c.130G>A), Hb A2-Lampang (HBD:c.142A>G), and Hb A2-Walsgrave distinguishing these from the wild-type control. The shape of the HRM curve from the amplification of fragment B was used to detect Hb A2-Kiriwong (HBD:c.233A>G) and is shown in Figure 5. For validation, 18 unknown samples were tested as blind samples. The HRM results for all these samples had 100% concordance.
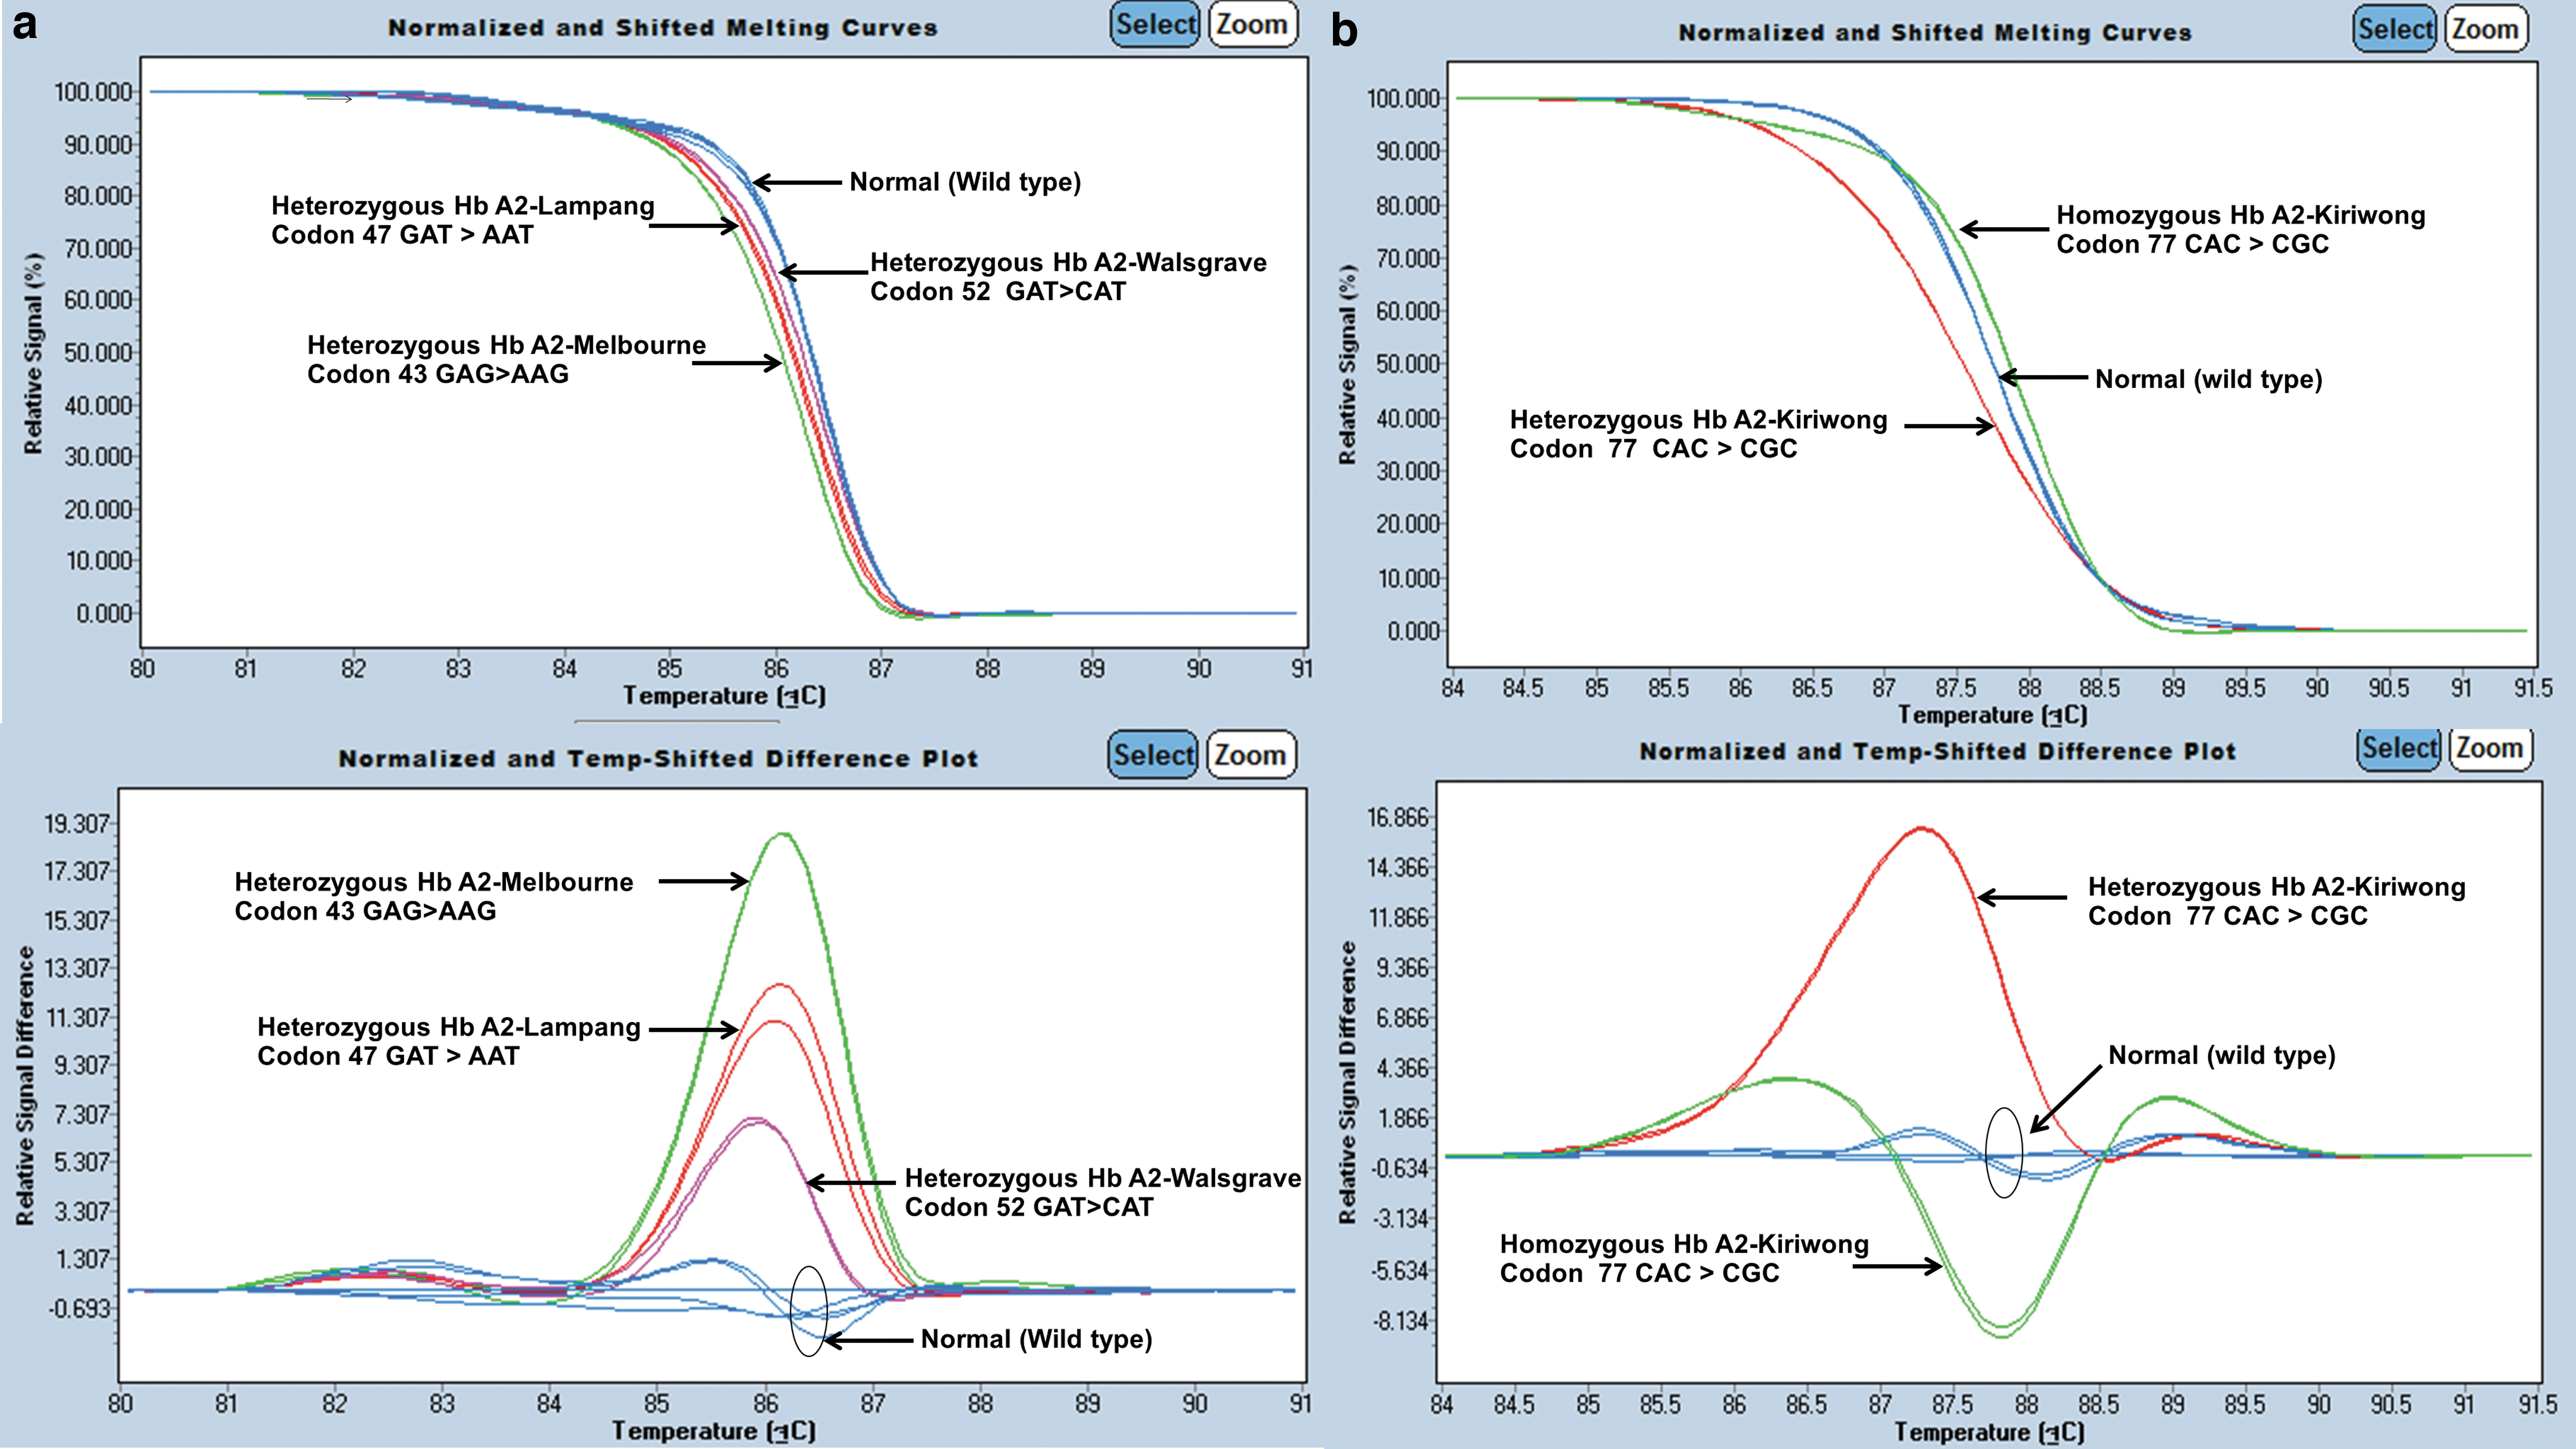
Representative graphs of HRM analysis illustrating the different patterns for Hb A2-Melbourne, Hb A2-Lampang, and Hb A2-Walsgrave from fragment A
Discussion
We successfully established an HRM method for the detection of four Hb A2 variants, including Hb A2-Melbourne, Hb A2-Lampang, Hb A2-Kiriwong, and Hb A2-Walsgrave. The two pairs of primers encompassing Exon II of the HBD gene covered all Hb A2 variants found in Thailand. The rare Hb A2-Kiriwong samples used for the homozygous and heterozygous control in the current study came from synthetic plasmid DNA that was previously confirmed by DNA sequencing.
The frequency of Hb variants found in Thailand is 2.4%. Of these cases, 70.9% were associated with one of 16 β-chain variants, while 5.8% and 0.9% had a Hb Lepore (δβ-hybrid Hb) and δ-chain variant, respectively (Srivorakun et al., 2014). Hb A2-Melbourne (δ43 [CD2] Glu-Lys) was the first Hb A2 variant discovered in Thailand, and it results from a missense mutation at codon 43 (GAG>AAG). This causes a glutamic acid to lysine substitution and was originally described in an Italian family in Australia (Chaibunruang et al., 2012). Hb A2-Lampang (δ47 [CD6] Asp-Asn) was the second δ-globin chain variant discovered and features coinheritance with Hb E, as well as a deletional α+-thalassemia (Panyasai et al., 2015). Hb A2-Kiriwong was the third discovered δ-globin gene mutation (δ77 [EF1] His-Arg) in Thailand. Hb analysis identified Hb A2-Kiriwong as coeluting with Hb A2 with a proportion of <3.5% in HPLC (Nuinoon et al., 2017).
In this study, we reported a case of Hb A2-Walsgrave as the fourth Hb A2 variant in Thailand. This was found in a pregnant woman in Southern Thailand who was identified as heterozygous for Hb A2-Walsgrave without a concomitant α-thalassemia gene. Hb A2-Walsgrave was first identified in the United Kingdom in an Indian immigrant who was also identified as heterozygous for Hb A2-Walsgrave without a concomitant α-thalassemia gene (Khalil et al., 2014).
We observed similar concentrations of Hb A2 and Hb A2-Walsgrave and total combined concentration of Hb A2 and Hb A2-Walgrave between our case and the original identification. Concentrations of Hb A2 (1.7%) and Hb A2-Walsgrave (1.1%) and normal range of total Hb A2 concentration (2.8%) were found in our case, compared with concentrations of Hb A2 (1.6%), Hb A2-Walsgrave (0.9%), and normal range of total Hb A2 concentration (2.5%) in the original case (Khalil et al., 2014). The lower concentrations of Hb A2-Walsgrave compared to Hb A2 found in both cases might relate to reduced synthesis and/or an unstable δ chain variant (Chaibunruang et al., 2012).
To date, all known cases of Hb A2-Walsgrave involve only mutations in codon 52 of the δ-globin gene (GAT>CAT). Substitution of a single amino acid (aspartic acid for histidine) in the D helices (D3) of the Hb molecule increases the positive charge compared to Hb A2; this also explains why Hb A2-Walsgrave migrates closer to the cathode (negatively charged electrode) in automated capillary zone electrophoresis. However, this replacement does affect contact with heme (Honig and Adams, 1986). Hb A2-Walsgrave is a clinically silent Hb variant. In our data, the presence of Hb A2-Walsgrave mutation without the accompanying α-globin defects was not clinically significant because this mutation still resulted in the phenotype of normochromic normocytic red cells. However, there is no hematological data that can be compared with our findings since Hb A2-Walsgrave was identified in only one individual who demonstrated normal red cell indices and a split Hb A2 peak (Khalil et al., 2014).
In the case of Hb A2-Melbourne, the concentration of Hb A2 variant is similar to Hb A2 when there is no accompanying α-globin gene defect or α+-thalassemia. Conversely, the concentration of Hb A2-Melbourne can be lower compared with Hb A2 when the mutation is coinherited with α0-thalassemia, and this manifests as hypochromic microcytic anemia (Panyasai et al., 2015). Identification of the β-thalassemia trait when coinherited with Hb A2 variants is possible by noting the obvious separation of the abnormal Hb A2 peak. This can be summed up to the normal Hb A2 level in the absence of β-thalassemia mutations or a raised value when β-thalassemia mutations are present. However, if other δ-thalassemia mutations are present, lowering of the Hb A2 value could lead to a misdiagnosis, as shown by other studies on δ-globin gene mutations (Khalil et al., 2014).
HRM analysis is a closed-tube and single-step method that can be applied to mutation scanning in large populations to estimate disease prevalence, even though it predates DNA sequencing. Sequence variation scanning with HRM is extremely rapid. Results can be expected within 60 min with no need for further processing and no requirement for gel electrophoresis separation of the PCR product. Moreover, HRM analysis could initially recognize a sequence variant in a DNA fragment from which DNA sequencing should be carried out, leading to a significant reduction in the number of required DNA sequencing procedures. To this end, HRM analysis has been used for screening and detection of various thalassemias and Hb variants (Shih et al., 2010; Lin et al., 2014; Xiang et al., 2015; Yimniam and Jindadamrongwech, 2016). Furthermore, compared with other methods, the HRM technique requires less optimization and uses low-cost fluorescent dyes. In this study, EVA green was used as a third-class dye. This is regarded as a saturating dye with release-on-demand intercalating fluorescence. It does not preferentially bind to purines or pyrimidines in DNA that would otherwise interfere with the PCR. These HRM assays have been shown to detect several inherited hematological disorders. For example, thalassemia disease for prenatal diagnosis in Thais (Charoenkwan et al., 2017), sickle cell anemia among Southern Nigerians (Yue et al., 2014), glucose-6-phosphate dehydrogenase (G6PD) deficiency in Chinese populations (Pan et al., 2013), and hemorrhagic disorder caused by mutations in the coagulation F9 gene (hemophilia B) (Salviato et al., 2019).
Conclusion
PCR-HRM analysis provides a simple and useful tool for the screening and detection of mutations with high discriminating sensitivity. HRM analysis permits the identification of homozygous and heterozygous mutant alleles. Moreover, single or multiple mutations occurring within the same amplicon can be readily identified from their different HRM profiles. This assay could be useful for δ-chain variant identification and will help to support the prevention and control of thalassemias and hemoglobinopathies in Thailand.
Footnotes
Authors' Contributions
All authors contributed to the study conception and design. Material preparation, data collection, and analysis were performed by T.P. The first draft of the article was written by T.P., and all authors commented on previous versions of the article. All authors read and approved the final article.
Acknowledgments
The authors thank Kulthida Choochaithayagul, a student at the Faculty of Medical Technology at the Prince of Songkla University, for providing the scientific and chemical equipment needed for the study. The authors also thank the Hatyai Hospital and MTSC for providing us with specimens of previously known and unknown δ-globin mutations. The authors acknowledge Assoc. Prof. Seppo Karrila for helping with English language editing.
Author Disclosure Statement
No competing financial interests exist.
Funding Information
This research was financially supported by the Prince of Songkla University (contract no. MET6202055S) and the Medical Technology Research Fund (grant no. MET611025S), Prince of Songkla University, Songkhla, Thailand.