




Abstract
Introduction:
As a serine/threonine kinase, Haspin (GSG2) has been reportedly associated with the development of malignant tumors. However, few studies have reported the role of GSG2 in colorectal cancer (CRC).
Materials and Methods:
Based on data from the Oncomine databases, GSG2 was found to be highly expressed in CRC patients' tissues. Therefore, the expression of GSG2 in CRC cell lines was subsequently evaluated. GSG2 loss-of-function experiments were conducted by infection with a lentivirus expressing shRNAs against GSG2. Colony-formation and cell viabilities were assessed using clonogenic and 3-(4,5-Dimethylthiazol-2-yl)-2,5-diphenyltetrazolium bromide (MTT) assays, respectively. Migration was assessed using wound-healing and transwell assays. A GSG2 inhibitor experiment was used to investigate the key role of GSG2 in CRC. Immunoprecipitation was used to investigate the interaction between GSG2 and p-H3. In addition, apoptosis was evaluated by quantifying caspase 3/7 activities, and western blot analyses were used to investigate the underlying mechanisms of GSG2 in CRC.
Results:
GSG2 was found to be highly expressed in CRC tissues and cells. Furthermore, GSG2 knock-down suppressed proliferation, colony formation and invasion, and induced apoptosis in CRC cells. Mechanistically, GSG2 was revealed to regulate Myc, NF-κB, Snail-1, and β-catenin signaling.
Conclusion:
Collectively, we demonstrate that GSG2 is a potential biomarker of CRC, and that GSG2 interference suppresses the progression of CRC and promotes apoptosis in vitro. These data suggest GSG2 as a putative oncogene, but will require additional in vivo studies to confirm.
Introduction
Colorectal cancer (CRC) remains the third most commonly diagnosed malignancy and the second leading cause of cancer-related death worldwide, accounting for 881,000 annual mortalities (Bray et al., 2018). Colorectal carcinogenesis is a multistep process involving numerous independent mutational events in tumor suppressor and oncogenes, which ultimately result in enhanced cellular proliferation, differentiation, and migration (Yokota and Sugimura, 1993). Therefore, discovering the molecular mechanisms of occurrence and progression in CRC is critical to improving the survival rates of patients.
As a serine/threonine kinase, Haspin (GSG2) binds chromosomes during mitosis and phosphorylates Thr3 of histone H3 (Wang et al., 2010); as such, GSG2 overexpression or deletion can lead to mitotic defects (Higgins, 2010). For example, chromosome segregation errors promote aneuploidy and genomic heterogeneity during mitosis, which contribute to tumorigenesis (Soto et al., 2019). Overall, GSG2 plays a central role in modulating cancer cell proliferation (Kim et al., 2017).
GSG2 is aberrantly expressed in human malignancies, including pancreatic cancer and gallbladder cancer (Han et al., 2019; Zhu et al., 2020). Moreover, GSG2 inhibitors such as CHR-6494 have been shown to possess potent antiproliferative, pro-apoptotic and anti-angiogenic activities, which may be therapeutically utilized (Huertas et al., 2012; Han et al., 2017). Studies have reported the inhibition of cancer cell proliferation (for instance, in HCT116, A549, and HT-29 cells) following CHR-6494 treatment. However, few studies have investigated the expression profiles and detailed roles of GSG2 in CRC.
The present study aimed to further investigate the function of GSG2 in CRC. The expression profiles of GSG2 were determined in CRC tissues and cell lines, and its effects on the cell viabilities and migration abilities of CRC cells were evaluated. To the best of our knowledge, the present study was to indicate the potential regulatory mechanisms of GSG2 in the progression of CRC.
Materials and Methods
Bioinformatics analysis
To evaluate the expression of GSG2 in CRC, the following five datasets were downloaded from the Oncomine database (https://www.oncomine.org/): (1) Rectal adenocarcinoma (Gaedcke Colorectal, 2010); (2) Rectal adenoma (Sabates-Bellver Colon, 2007); (3) Colon carcinoma (Skrzypczak Colorectal, 2010); (4) Cecum adenocarcinoma (TCGA Colorectal, 2011); and (5) Colon Mucinous Adenocarcinoma (TCGA Colorectal, 2011). Gene Expression Profiling Interactive Analysis (GEPIA; http://gepia.cancer-pku.cn/) was used to determine the mRNA expression levels of GSG2 in tumor and normal tissues in rectum adenocarcinoma (“READ”) and colon adenocarcinoma (“COAD”).
Cell lines and cell culture
Human CRC cell lines (HCT116, RKO, and SW480) were obtained from The Cell Bank of Type Culture Collection of the Chinese Academy of Sciences (Shanghai, China). HCT116 cells were cultured in McCoy's 5A Medium (Gibco; Thermo Fisher Scientific, Inc.), RKO cells were cultured in Eagle's minimum essential medium (Gibco; Thermo Fisher Scientific, Inc.), and SW480 cells were cultured in Dulbecco's modified Eagle's medium (Corning, Inc.). Penicillin (100 U/mL) and streptomycin (100 mg/mL) were added to the cell culture media, and the cells were maintained in a humidified atmosphere at 37°C (5% CO2).
GSG2 knockdown in HCT116 and RKO cells
A GSG2-targeting lentivirus (NM_031965) was constructed by Shanghai GeneChem Co., Ltd. The short hairpin (sh)RNA sequence targeting GSG2 was as follows: 5′-ACAGGACAATGCTAACTT-3′. Following lentivirus construction, the CRC cells infected were detected its transduction efficiency by green fluorescent protein (GFP) when cell growth reached 70-80% confluency in 6-well plates. Cultured cells were observed under a fluorescence microscope 3 days posttransduction. GSG2 knockdown was then confirmed using puromycin selection (2 μg/mL). The HCT116 and RKO cells, transduced using LV-GSG2-RNA or a negative control (shCtrl) lentivirus, were named the shGSG2 or shCtrl groups, respectively.
GSG2 inhibitor experiment in HCT116 cells
HCT116 cells were seeded at 96-well-plate at a density of 1 × 10⁴ cells/well for 24 h. After that, the cells were treated with GSG2 inhibitor CHR-6494 (5 μM) for 24 h, while the control group was challenged with equal phosphate buffered saline (PBS). The cells were then collected for western blot analysis.
Immunoprecipitation
For immunoprecipitation, the HCT116 cells were lysed on ice for 30 min, and then centrifuged at 12,000 g for 15 min to collect the lysate. Next, the lysate was combined with anti-GSG2 (1:100) or anti-p-H3 (1:200) at 4°C overnight, and then coprecipitated with protein A + G agarose beads for 4 h. After washing with PBS for five times, the beads were boiled in 1% sodium dodecyl sulfate (SDS) loading buffer and western blot was performed with indicated antibodies.
RNA extraction and reverse transcription-quantitative polymerase chain reaction
Total RNA was extracted from cells using TRIzol® reagent (Invitrogen; Thermo Fisher Scientific, Inc.). The RNA concentration was determined by the NanoDrop2000 spectrophotometer (Thermo Fisher Scientific, Inc.), and the RNA integrities were confirmed by gel electrophoresis. Subsequently, 2 μg total RNA was reverse-transcribed into cDNA by M-MLV kit (Promega Corporation) with the appropriate primers. All primers were designed by GeneWorks software (IntelliGenetix, Inc.) and polymerase chain reaction (PCR)-amplified by designed cloning primers. The SYBR Green Real-Time PCR assay kit (TAKARA, Inc.) was used and quantitative PCR (qPCR) was performed by the Agilent Mx3000P thermocycler (Agilent Technologies, Inc.) and the 2−ΔΔCt method was used to determine the relative mRNA expression in each sample, compared with the control.
The following thermocycling conditions were used for qPCR as follows: 95°C for 30 s; 45 cycles of 95°C for 5 s; and 60°C for 30 s. Glyceraldehyde 3-phosphate dehydrogenase (GAPDH) was used as an internal control and all samples were run in triplicate. The following qPCR primers were used: GSG2 forward, 5′-G G A A G G G G T G T T T G G C G A A G T-3′ and reverse, 5′-T G A G G A G C A A G G G A G G G T A A G-3′; GADPH, forward 5′-T G A C T T C A A C A G C G A C A C C C A-3′ and reverse, 5′-C A C C C T G T T G C T G T A G C C A A A-3′.
Western blotting
Cells were lysed with RIPA lysis buffer and the total cellular proteins were quantified by a bicinchoninic acid protein assay kit (BCA) (both Beyotime Institute of Biotechnology). Fifty micrograms of protein extracts were subsequently separated by 10% SDS-polyacrylamide gel electrophoresis (SDS-PAGE) and transferred into poly(vinylidene fluoride) (PVDF) membranes.
The membranes were blocked by TBS- T (TBS+Tween) with 5% bovine serum albumin (Gibco; Thermo Fisher Scientific, Inc.) for 1 h, and then incubated with primary antibodies against the following, overnight at 4°C, on a shaking platform: GSG2 (1:200, Sigma-Aldrich; Merck KGaA), GAPDH (1:2000; Santa Cruz Biotechnology, Inc.), Myc (1:100; Abcam, Inc.), NF-κB (1:300; Cell Signaling Technology, Inc.), Snail-1 (1:300; Cell Signaling Technology, Inc.), and β-catenin (1:300; Cell Signaling Technology, Inc.).
After washing three times with TBS-T (for 5 min each), the membranes were incubated with horseradish peroxidase (HRP)-conjugated secondary mouse IgG (1:5000; Santa Cruz Biotechnology, Inc.) diluted in blocking buffer, at room temperature for 1 h. Protein-binding antibodies were visualized by ECL-Plus kit reagents (Thermo Fisher Scientific, Inc.). Enhanced chemiluminescence (Amersham Pharmacia Biotechnology, Piscataway, Inc.) and Fuji LAS1000 Plus chemiluminescence imaging system (Kodak, Stamford, Inc.) were used to perform the detection.
Cell viability assay
Cells were seeded into 96-well plates at a density of 2 × 10³ cells/well (100 μL each), and cultured at 37°C (5% CO2) for 2 days. The cells were then counted by the Celigo image cytometer (Nexcelom Bioscience) for 5 consecutive days, and cell growth curves were constructed for each group.
3-(4,5-Dimethylthiazol-2-yl)-2,5-diphenyltetrazolium bromide (MTT) assay
Cells were seeded into 96-well plates at a density of 2 × 10³ cells/well. The cells were then cultured at 37°C (5% CO2) for 1, 2, 3, 4, and 5 days. Following incubation, 10 μL 3-(4,5-Dimethylthiazol-2-yl)-2,5-diphenyltetrazolium bromide (5 mg/mL; Genview) was added to each well, and the plates were incubated at 37°C for a further 4 h. The supernatants were subsequently replaced with 100 μL dimethyl sulfoxide (Sigma-Aldrich; Merck KGaA) and the absorbances were measured by a TECAN Infinite 200 microplate reader (Tecan Group, Ltd.) at 490 nm. Growth curves were constructed to evaluate cellular viability.
Clonogenic assay
HCT116 and RKO cells infected with shGSG2, and shCrtl lentiviruses were incubated at 37°C (5% CO2) for 3 days and then harvested by trypsinization. The cells were resuspended, counted, and then cultured in 6-well plates (400 cells/well) at 37°C for 10 days. After washing with PBS, the resulting colonies were stained with 0.5% crystal violet solution for 20 min. Colonies ≥50 cells were counted with a digital camera for quantitative analysis.
Transwell migration assay
Transwell membranes precoated with Matrigel (BD Biosciences, Inc.) were used to investigate invasion and migration. Control and lentivirus-infected cells (1 × 10⁵ cells/well) were seeded into the upper chambers of transwell inserts. The medium in the lower chamber was supplemented with 600 μL 30% FBS (Ausbian) as a chemoattractant. After culturing for 24 h, the upper chambers were discarded, and migratory cells on the lower membrane were stained with 0.5% crystal violet (Yuanye Bio-Technology Co., Ltd.). The cells in five random fields were imaged by a microscope and the migratory/invasive ability of the cells was calculated as the number of cells penetrating the membrane.
Wound-healing assay
HCT116 and RKO cells infected with shRNA lentiviruses were seeded into 96-well plates at a density of 5 × 10⁴ cells/cm2, and cultured until 90% confluent. A wound was scratched into the cell monolayer using a 10 μL pipette tip, and the plates were subsequently washed three times with PBS. Images were captured at 0 and 48 h for each sample, and the wound-closure rates were determined using the Celigo 96 Wounding Replicator.
Caspase 3/7 assay
A Caspase-Glo® Assay Kit (Promega Corporation) was used to quantify caspase 3/7 activity, according to the manufacturer's protocol. The average background reading of the culture medium alone was subtracted from all luminescence values. Absorbance values were detected using a spectrophotometer (Tecan Group, Ltd.).
Statistical analysis
Data representation was carried out using the GraphPad Prism 7.0 Software (GraphPad Software, Inc.). Statistical analyses were performed using Student's t-test or one-way analysis of variance (ANOVA) (SPSS software, version 24.0; IBM Corp.) All the data were achieved from independent experiments conducted in triplicate, and are presented as means ± standard deviation. p < 0.05 was considered to indicate a statistically significant difference.
Results
GSG2 expression in CRC tissues
The datasets from five studies associated with GSG2 expression in CRC and normal (nontumor) tissues were downloaded from the Oncomine database (p < 0.05; Fig. 1A). GEPIA revealed that GSG2 expression was significantly higher in CRC tissues compared with the normal tissue counterparts (p < 0.05; Fig. 1B). GSG2 expression in each tumor sample was normalized relative to that of the associated adjacent nontumor tissue.

GSG2 expression in CRC tissues.
GSG2 expression in CRC cell lines
GSG2 mRNA expression was assessed in three CRC cell lines (HCT116, RKO, and SW480) by reverse transcription-qPCR (RT-qPCR). In Figure 2A, GSG2 was found to be highly expressed in CRC cells (SW480>RKO>HCT116), the HCT116 and RKO cell lines were selected for subsequent experimentation as their expression levels would be better to represent the expression of GSG2.

GSG2 expression in CRC cell line.
A shRNA lentivirus targeting GSG2 was utilized to further investigate the effect of GSG2 knockdown in HCT116 and RKO CRC cells. shCtrl lentivirus was used as a negative control. Transduction efficiency was confirmed by a reduction in GSG2 mRNA (Fig. 2B, C) and protein (Fig. 2D) levels in HCT116 and RKO cells (Fig. 2). The data illustrated that GSG2 knockdown resulted in an 82.2% and 64.8% reduction in mRNA expression in HCT116 (p < 0.01; Fig. 2B) and RKO cells (p < 0.01; Fig. 2C), respectively. These data indicated that LV-GSG2-RNA-induced GSG2 knockdown notably decreased the expression of GSG2 both at the mRNA and protein levels in HCT116 and RKO cells, compared with cells infected with the negative control virus.
GSG2 knockdown inhibits the viability of HCT116 and RKO cells
To verify the role of GSG2 in cellular viability, the Celigo imaging cytometry system was used to monitor the daily viability of cells over a 5-day period. HCT116 and RKO cells were infected with shGSG2 or shCtrl lentivirus and the cell count were continuously recorded. The representative fluorescent images and the cell count or fold changes for HCT116 (Day 5; p = 9.966E-5) and RKO cells (Day 5: p = 4.411E-5) are shown in Figure 3A and B. After 5 days, cellular viability was significantly inhibited in the shGSG2 groups compared with the shCtrl groups (p < 0.01). The cell viability rates of the shGSG2 groups were lower than those of the control groups for both HCT116 and RKO cells.
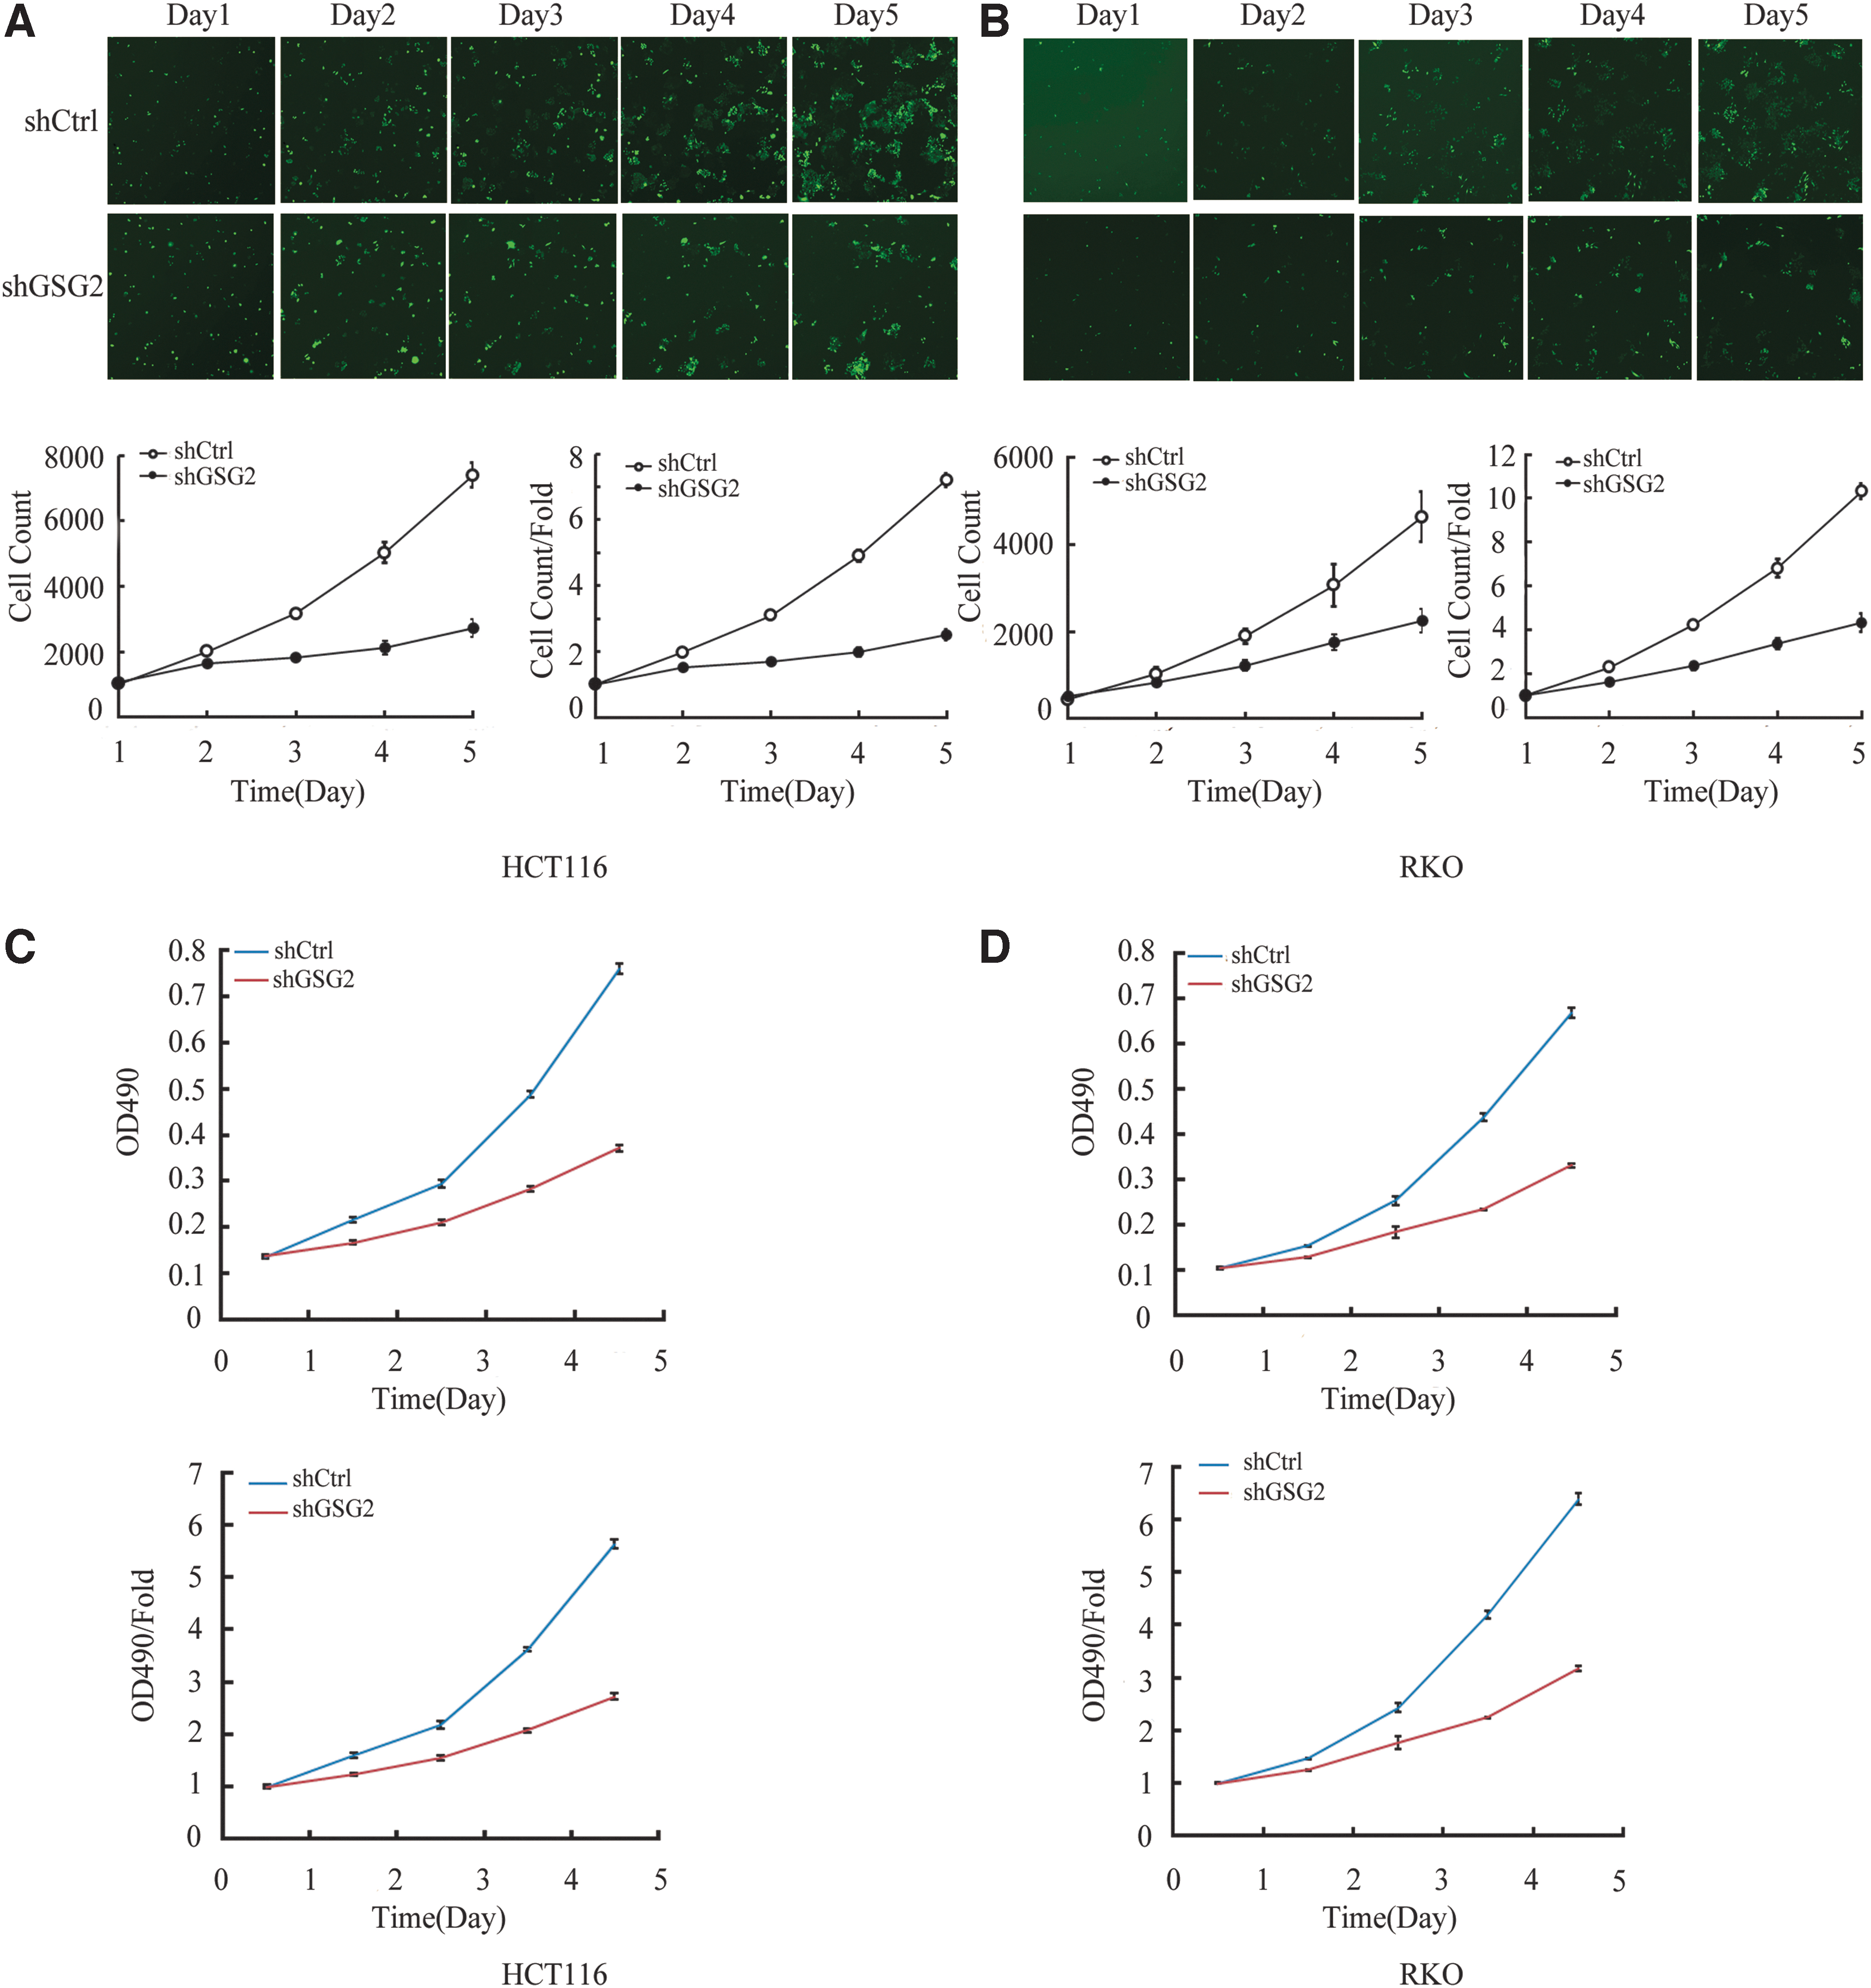
GSG2 knockdown inhibits the viability of HCT116 and RKO cells.
MTT assays were also used to verify the influence of GSG2 knockdown on the viability of CRC cells. According to the MTT assay results, the viability rate was markedly inhibited in the shGSG2, compared with the shCtrl groups (p < 0.01; Fig. 3C, D). This revealed that the loss of GSG2 could markedly suppress cellular viability, consistent with the cell counting results. As shown in Figure 3C and D, the viability rate was higher in the negative control groups for both HCT116 and RKO cells. These results indicated that GSG2 knockdown markedly attenuated the viability of CRC cells, which demonstrates its potential for reducing the growth and viability of CRC cells.
GSG2 knockdown inhibits HCT116 and RKO cell colony formation
The functional role of GSG2 in HCT116 and RKO cell proliferation was further assessed using clonogenic assays following shGSG2 or shCtrl lentivirus transduction. The representative images are displayed in Figure 4A and B. Downregulation of GSG2 expression notably decreased the colony-forming capacity of HCT116 and RKO cells. An average of 158 HCT116 cell clones were formed following shCtrl lentiviral transduction, while 75 clones were formed following GSG2 knockdown (p < 0.01; Fig. 4A). Similarly, RKO cells formed an average of 118 clones in the control group, compared with ∼38 clones in the shGSG2 group (p < 0.01; Fig. 4B). These findings indicated that inhibiting GSG2 expression reduced colony formation ability.
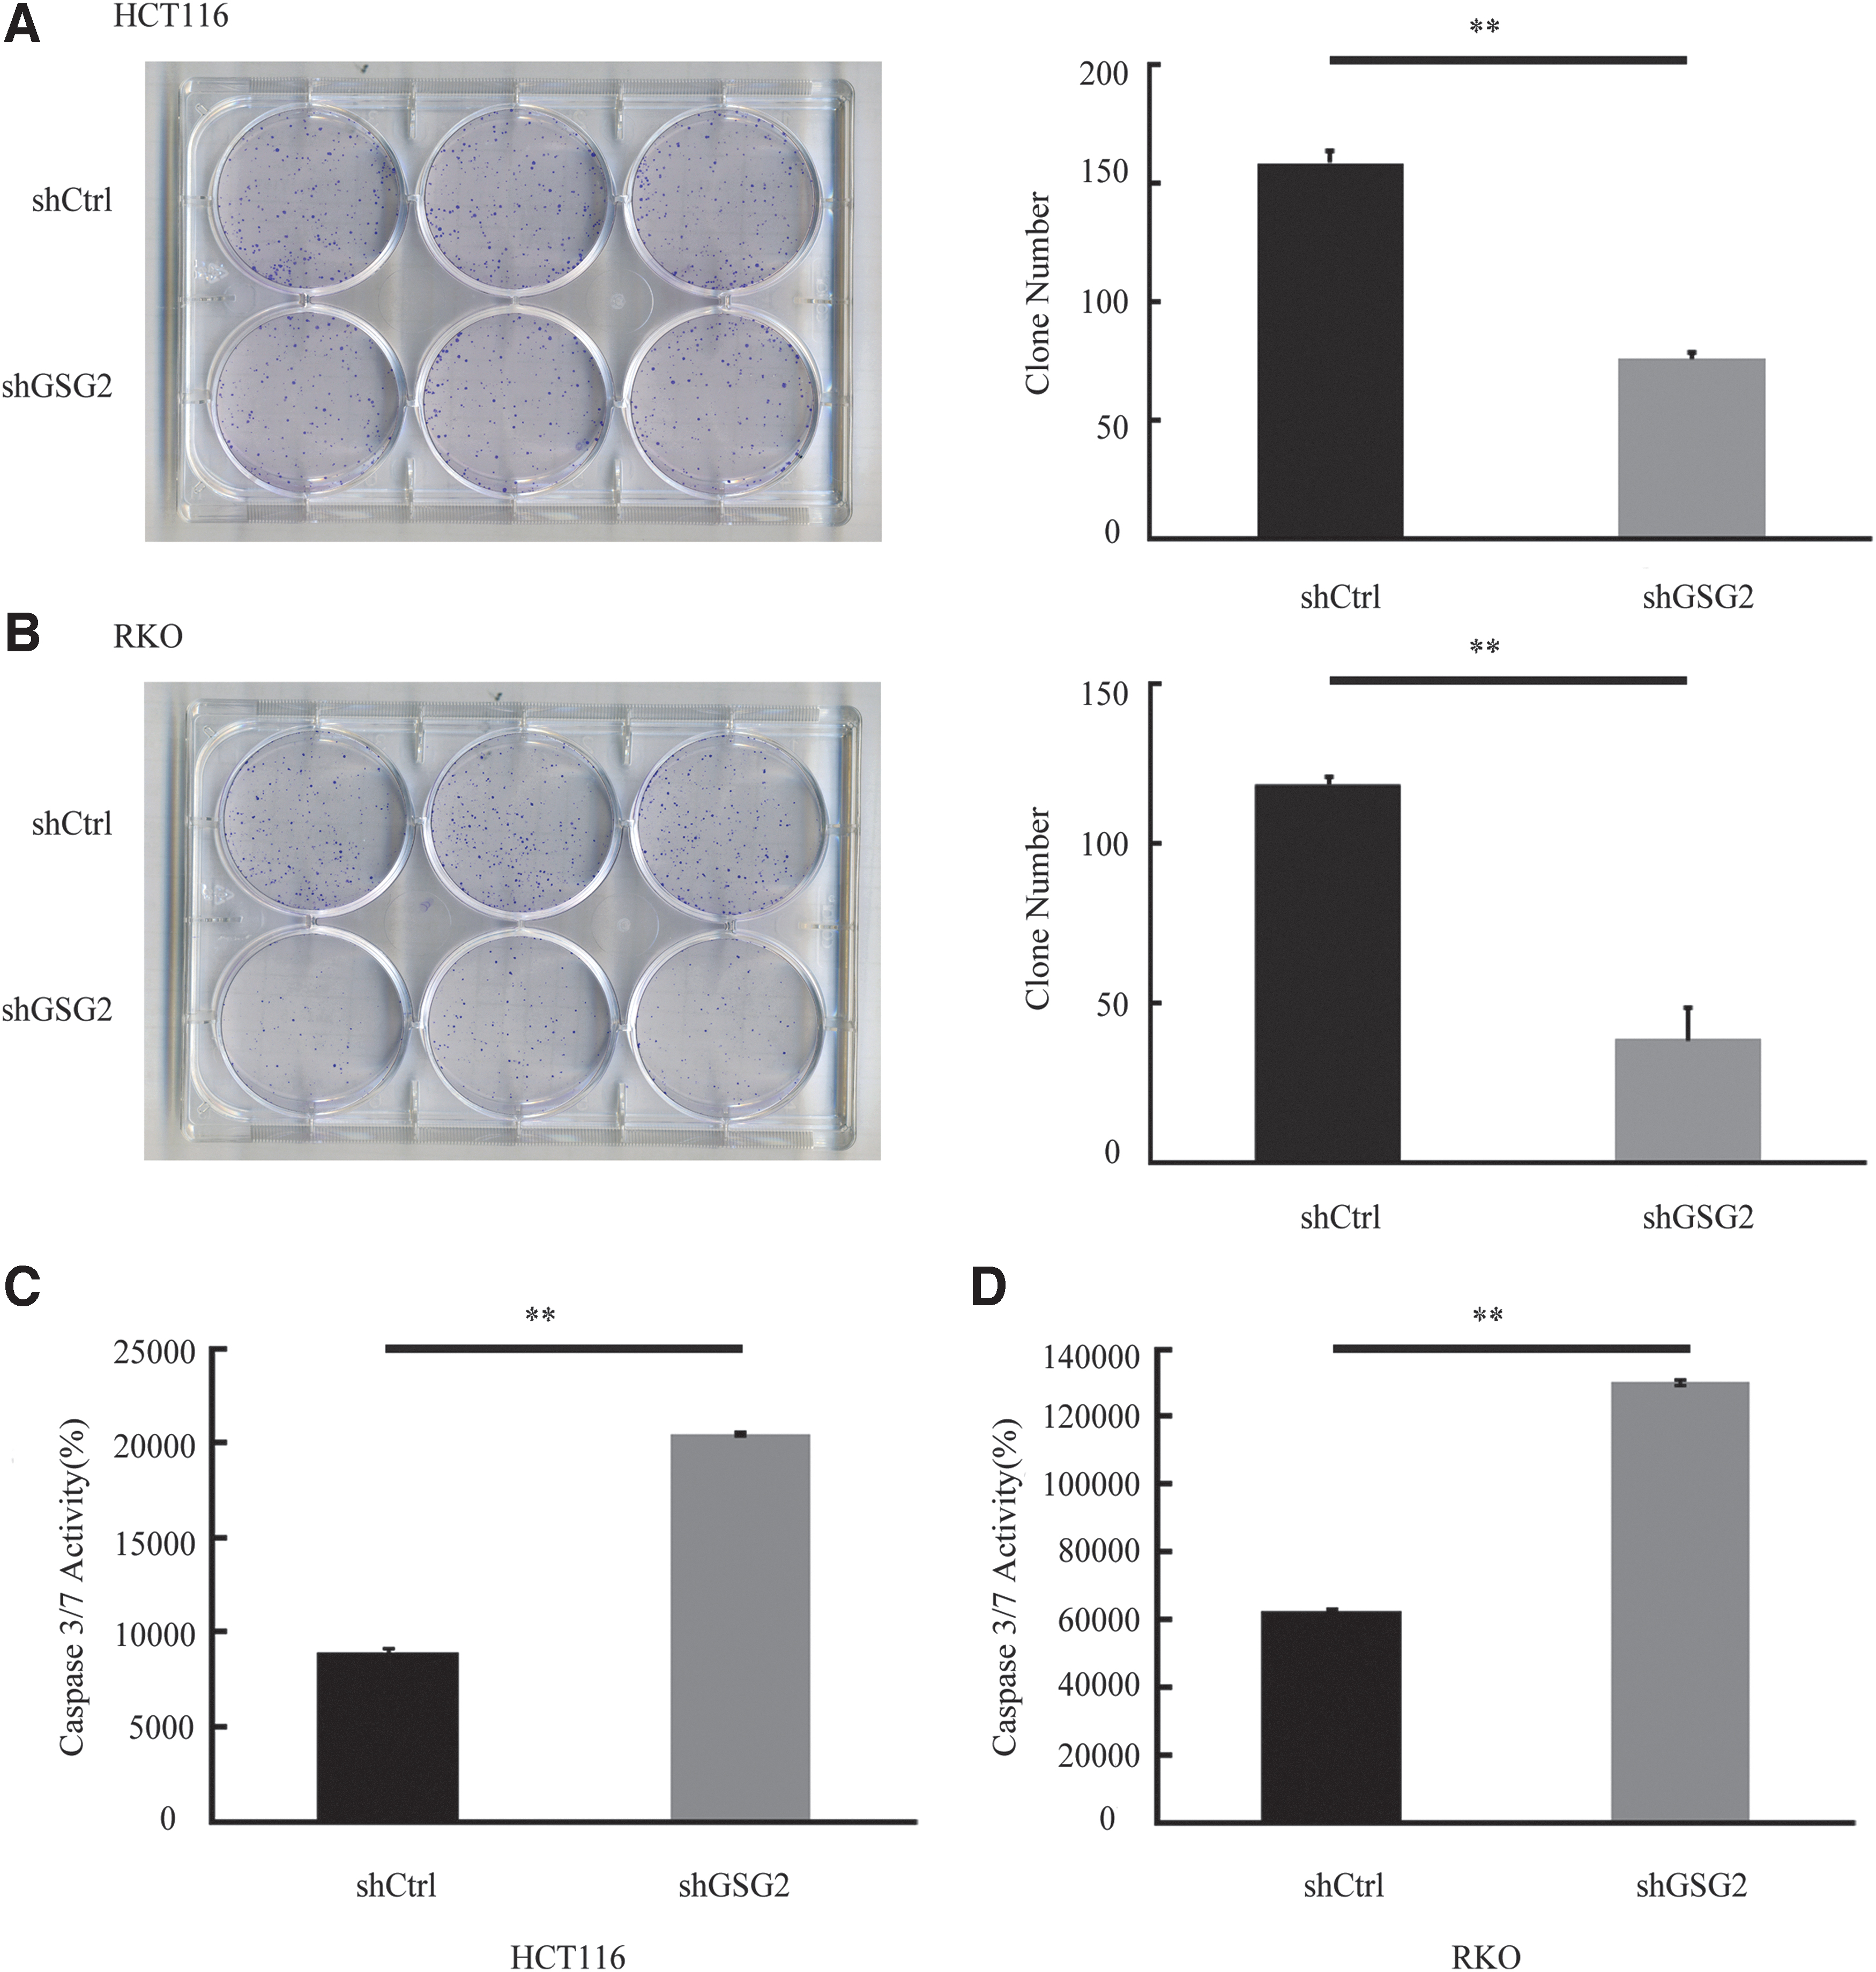
GSG2 knockdown inhibits HCT116 and RKO cell colony formation.
GSG2 knockdown induced apoptosis in HCT116 and RKO cells
The results of the caspase 3/7 assay demonstrated that caspase 3/7 activities were markedly enhanced in the shGSG2 groups (Fig. 4C, D), compared with the shCtrl groups, indicated that apoptosis was significantly increased (>2.0-fold) following GSG2 knockdown in HCT116 and RKO cells.
GSG2 knockdown suppressed the migration of HCT116 and RKO cells
The results of the wound-healing experiment indicated that the migratory capacities of cells in the shGSG2 group were lower than that in the shCtrl group, 48 h posttransduction. In addition, the wound-healing rate of the shGSG2 group (52.46% ± 0.1) was lower than that of the shCtrl group (97.14% ± 0.03) for HCT116 cells (p < 0.01; Fig. 5A). Furthermore, the wound-healing rate of the shGSG2 group (27.95% ± 0.03) was also lower in RKO cells, compared with the control group (64.28% ± 0.06; p < 0.01; Fig. 5B).
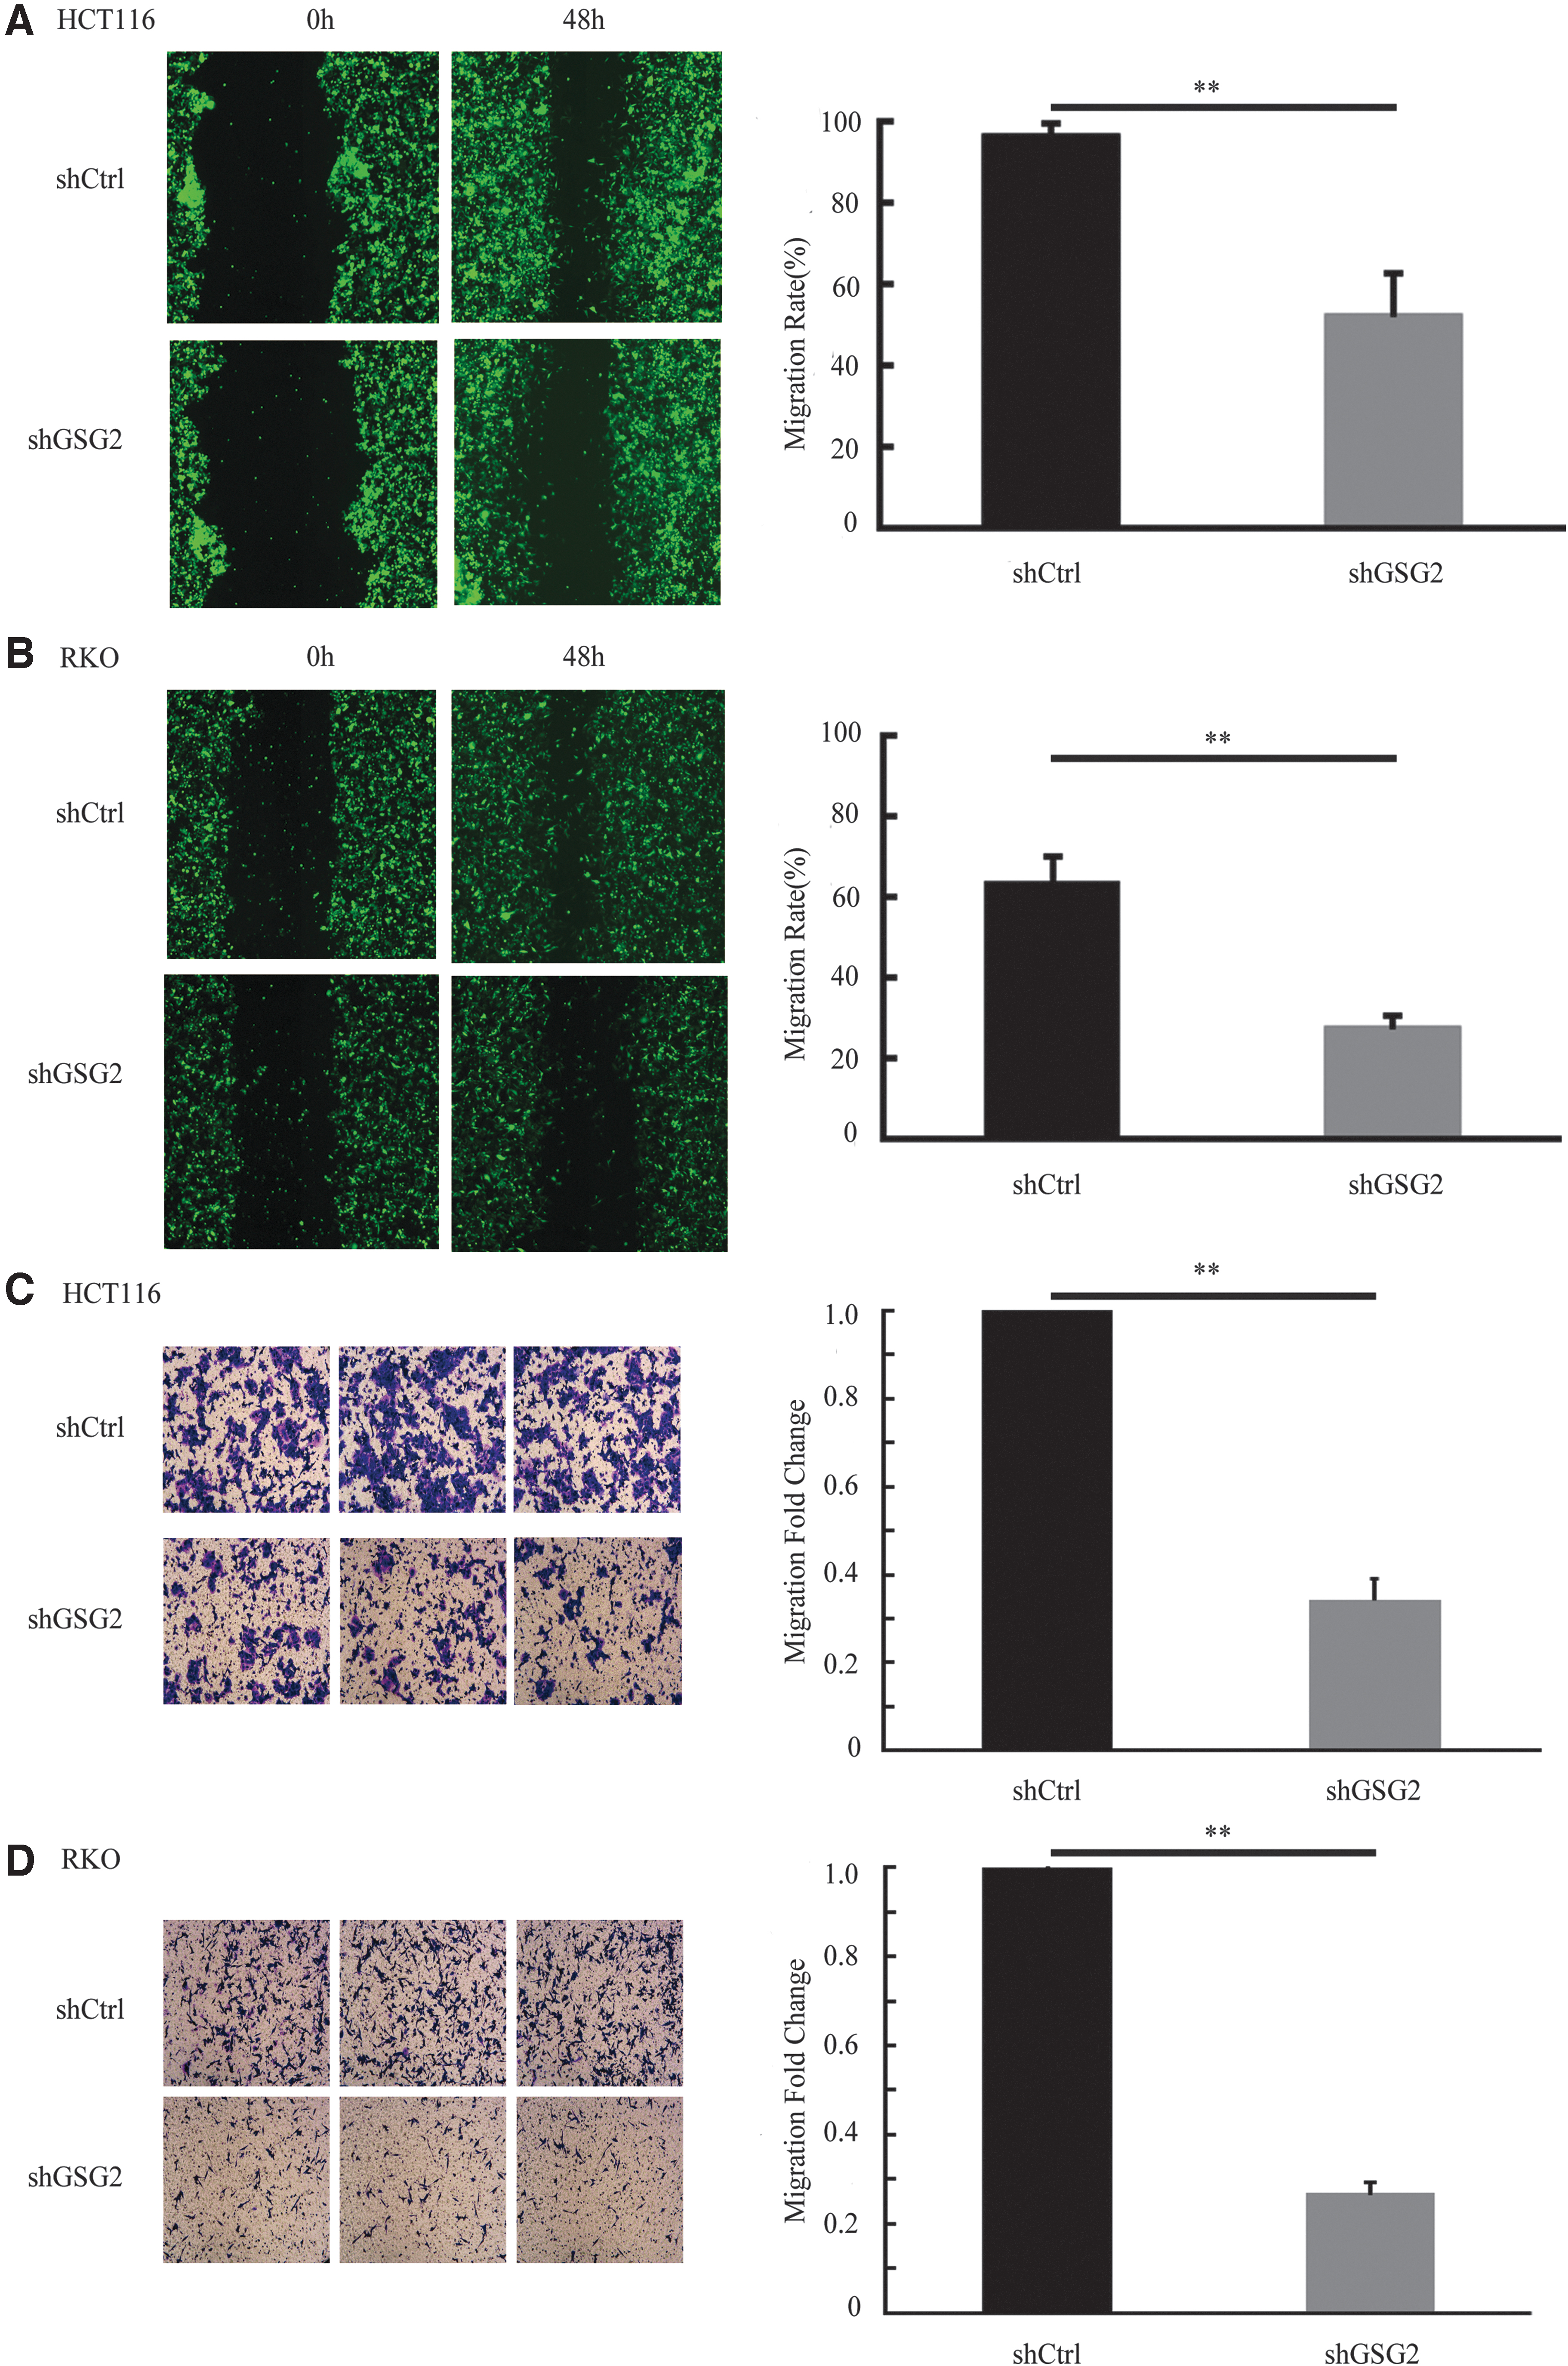
GSG2 knockdown suppressed the migration of HCT116 and RKO cells.
Transwell assays were also performed to confirm the inhibitory effects of GSG2 knockdown on CRC cell migration and invasiveness. GSG2 knockdown significantly suppressed the invasive capacities of HCT116 and RKO cells, compared with the controls (Fig. 5C, D). The number of migratory cells was also significantly reduced in the shGSG2 than in the shCtrl group (p < 0.01). These results indicated that GSG2 promoted the invasion and migration abilities of CRC cells.
GSG2 regulated Myc, NF-κB, Snail-1, and β-catenin
Based on the effects of classical signaling pathways on cellular viability and differentiation (Linnekamp et al., 2015; Maffeis et al., 2019), a number of key factors were selected to further clarify the regulatory mechanisms of GSG2 in CRC. The protein expression levels of these genes were analyzed by western blotting. The results clarified that among numerous selected genes associated with tumor proliferation and metastasis, Myc, NF-κB, Snail-1, and β-catenin were downregulated in the GSG2 knockdown group compared with the negative control group (p < 0.05; Fig. 6A). In summary, these results illustrated that GSG2 may be involved in the initiation and development of CRC by regulating Myc, NF-κB, Snail-1, and β-catenin expression.

GSG2 regulated Myc, NF-κB, Snail-1, and β-catenin (n = 3). Compared with NC *p < 0.01. NC, Negative Control.
GSG2 inhibitor CHR-6494 regulated Myc, NF-κB, Snail-1, and β-catenin
Since GSG2 inhibitor CHR-6494 is important in other clinical studies, some key proteins were also selected to evaluate the role of GSG2 in CRC. Myc, NF-κB, Snail-1, and β-catenin were analyzed by western blotting. Myc, NF-κB, Snail-1, and β-catenin were decreased in the GSG2 inhibitor CHR-6494 group compared with the negative control group (Fig. 7).
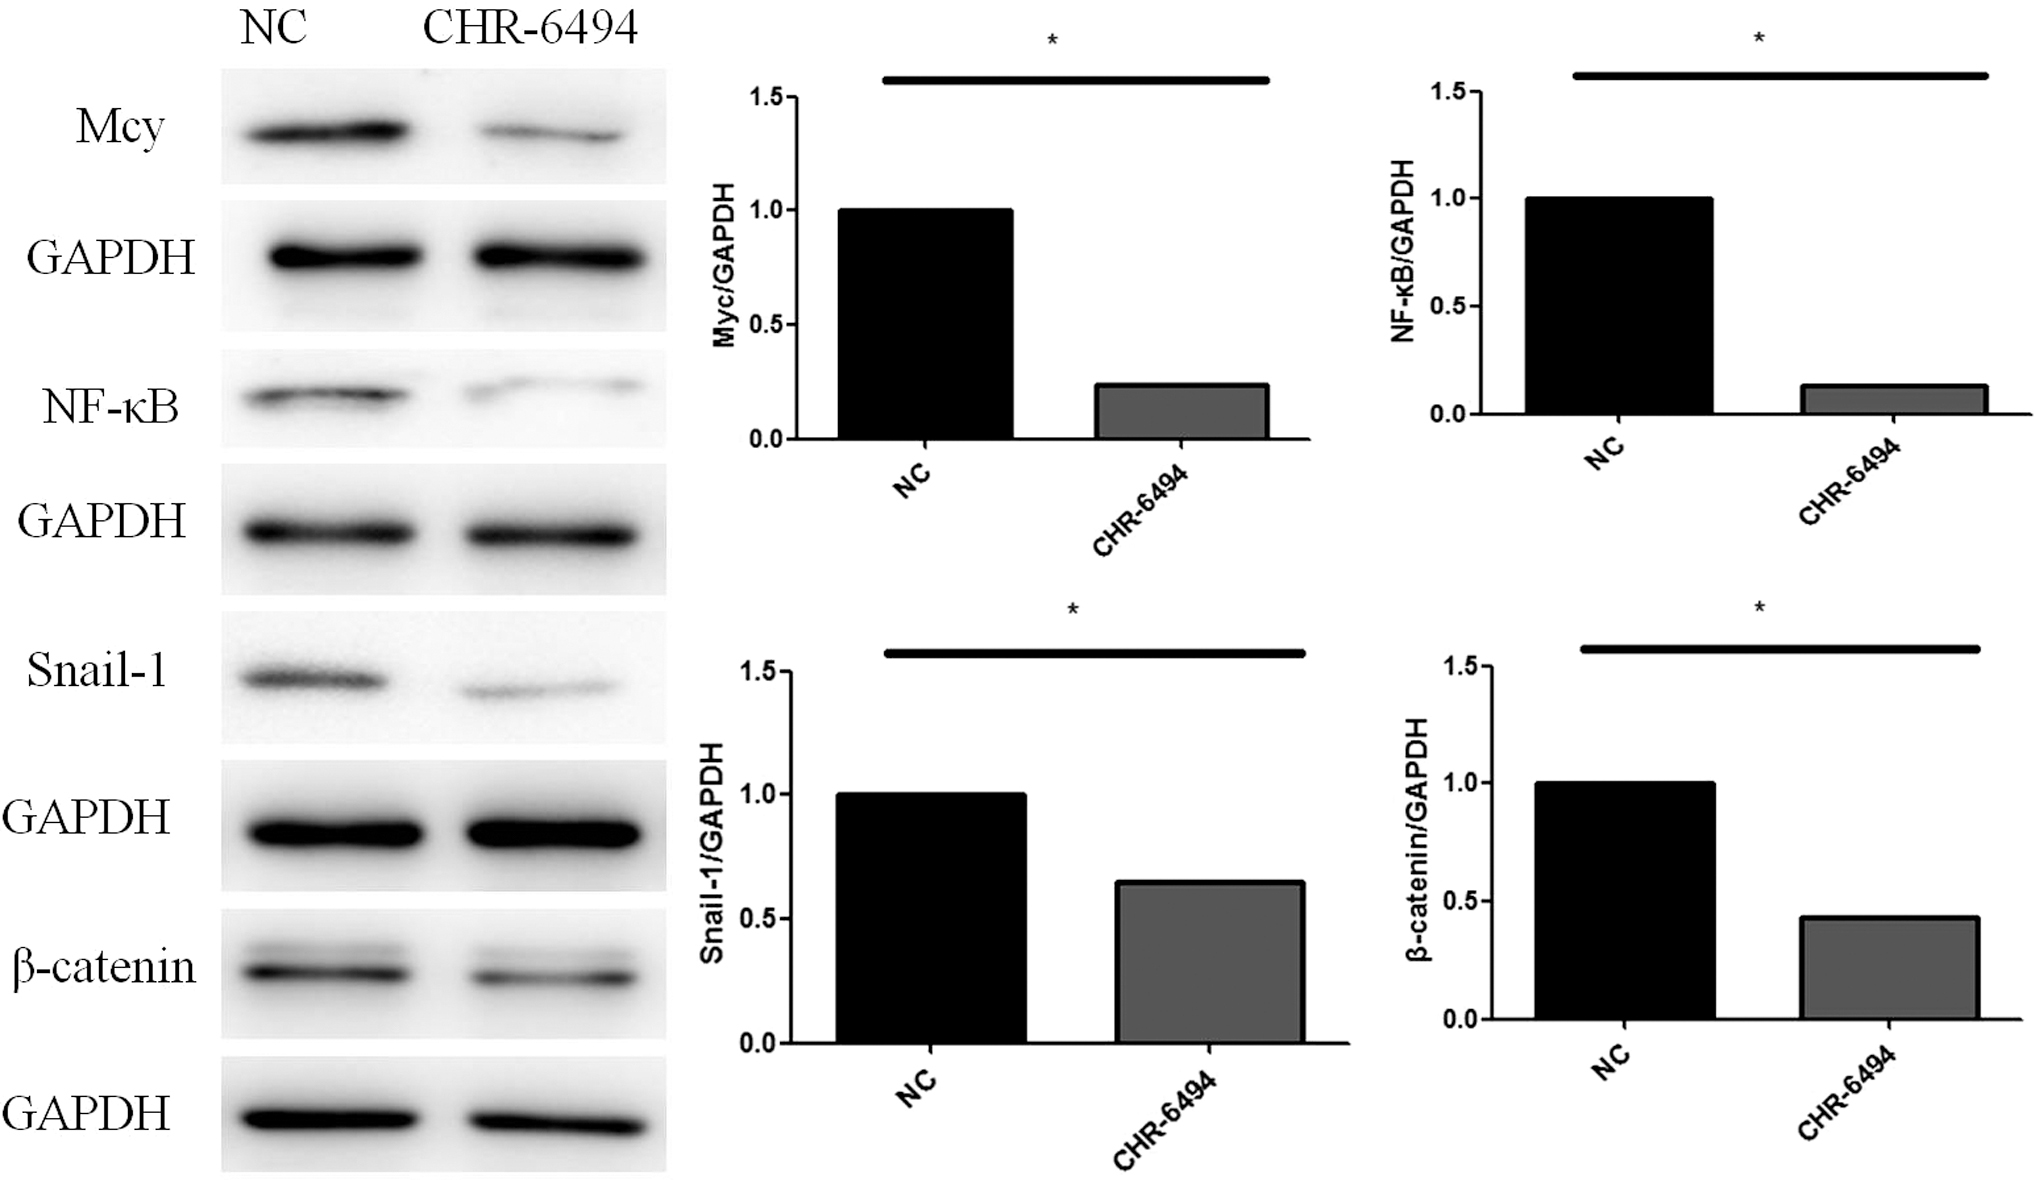
GSG2 inhibitor CHR-6494 regulated Myc, NF-κB, Snail-1, and β-catenin (n = 3). Compared with NC *p < 0.01.
GSG2 knockdown suppressed p-H3 in HCT116 cells
Since GSG2 is known to phosphorylate histone H3 during mitosis. Immunoprecipitation was used to evaluate interaction between GSG2 and p-H3. The results indicated that the binding of GSG2 to p-H3 was impaired by GSG2 knockdown (Fig. 8).
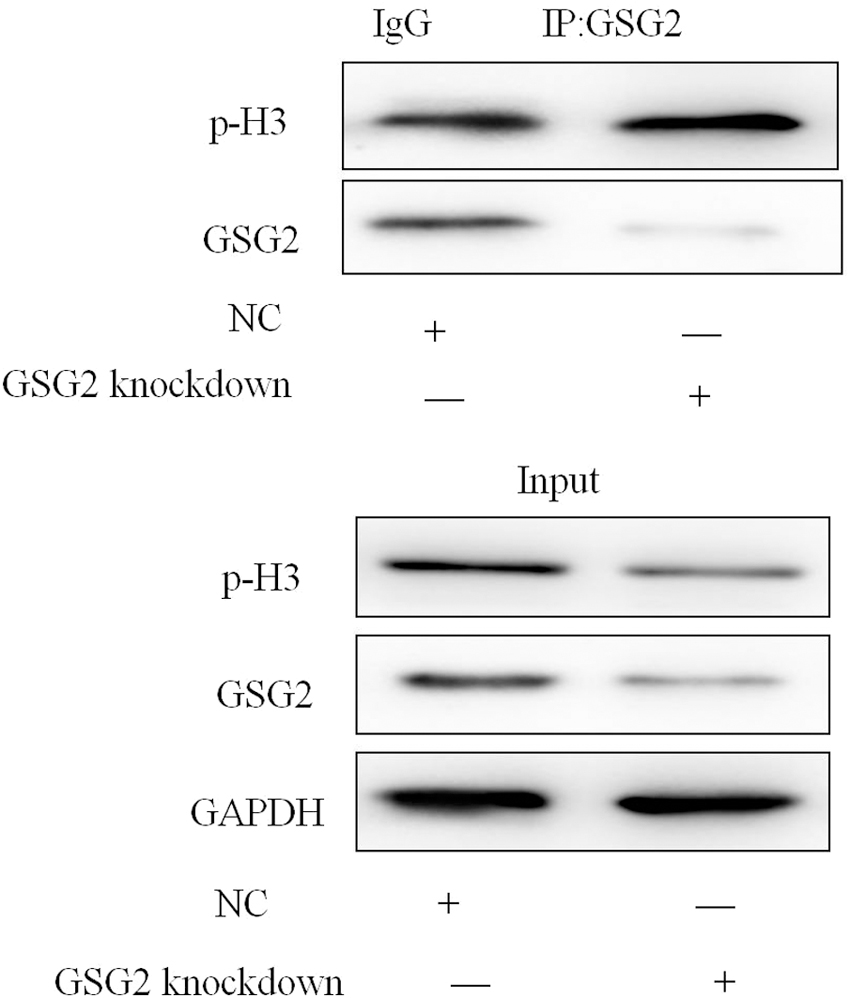
GSG2 knockdown suppressed p-H3 in HCT116 cells by immunoprecipitation (n = 3).
Discussion
mRNA of the serine/threonine kinase GSG2 was initially detected in male germ cells of mice. Haspin (encoded by germ cell-specific gene 2, GSG2) has divergent members of the eukaryotic protein kinase family (Tanaka et al., 1994, 1999). GSG2 phosphorylates Thr3 of the histone H3 (H3) (Yamagishi et al., 2010), which demonstrates its catalytic effect (Kestav et al., 2015), and until recently, H3 was the only identified substrate of GSG2 (Higgins, 2010). Chromosomal instability caused by the erroneous separation of mitotic chromosomes is an indicator of cancerous cells (Yi et al., 2019).
Therefore, GSG2 is a histone H3 threonine-3 kinase required to maintain centromeric cohesion during mitosis (Dai et al., 2006) and plays a central role in modulating the growth of cancer cells (Opoku-Temeng et al., 2018). The role of GSG2 in promoting the proliferation and migration of pancreatic cancer cells has also been reported (Han et al., 2019). Consequently, GSG2 may represent an attractive therapeutic target.
The incidence of CRC was on the rise worldwide (Rawla et al., 2019). The results of the present study indicated that GSG2 was highly expressed in CRC tissues and cell lines. Using loss-of-function experiments, the influence of GSG2 on the progression and metastasis of CRC was also investigated, and GSG2 knockdown was confirmed to significantly inhibit proliferation and migration and promote apoptosis in CRC cells and also suppress p-H3. Previous studies have shown that the absence of GSG2 resulted in irregular arrangement of metaphase chromosomes, while the overexpression of GSG2 delayed the early progression of mitosis (Hada et al., 2017), thereby retarding cellular proliferation, this further supported the results of the present study.
GSG2 knockdown was also found to reduce the protein expression levels of Myc, NF-κB, Snail-1, and β-catenin, thus overall, these findings verify GSG2 as an oncogene in CRC. In addtion, GSG2 inhibitor CHR-6494 also decreased the levels of Myc, NF-κB, Snail-1, and β-catenin.
The Wnt/β-catenin signaling pathway plays a crucial role in cellular metabolism, proliferation, differentiation, migration, and apoptosis (Johnson and Rajamannan, 2006). Myc is a proto-oncogene, which has also been associated with cellular proliferation, various metabolic processes, and low survival rates (Hartl et al., 2020). As a key regulator of the Wnt signaling pathway in tumors, such as CRC, hepatocellular carcinoma, and breast cancer, nuclear β-catenin specifically activated downstream target genes, including c-Myc, cyclin D1, and FGF20 (Yochum et al., 2008). Deregulation of Myc expression lead to genomic instability, which contributed to metabolic disturbances in cancer cells (Rogulski et al., 2005).
In the present study, Myc and β-catenin were downregulated in human HCT116 colonic cells, following lentiviral GSG2 knockdown, suggesting that the expression of Myc and β-catenin to suppress tumor growth in CRC.
Snail-1, which has been associated with CRC metastasis, played a crucial role in the molecular mechanisms of epithelial-to-mesenchymal transition (EMT) (Kaufhold and Bonavida, 2014). Transcriptional repression of E-cadherin results from the activation of its repressors like Snail-1 during EMT (Galvan et al., 2015). The results of the present study show that the downregulation of Snail-1 was decreased after interfering GSG2. There are still many uncertainties about whether GSG2 participates in EMT, and additional experiments are required to confirm the exact mechanisms.
The NF-κB proteins were key regulators of the proinflammatory molecular network, which promoted cellular proliferation, inhibited cell death, accelerated tumor growth and invasion, and induced angiogenesis and metastasis (Karin and Greten, 2005). The tumor formation capacity of NF-κB attributes to its ability to inhibit apoptosis in chemically transformed premalignant cells (Taniguchi and Karin, 2018). In the present study, NF-κB was downregulated following GSG2 knockdown, which may have contributed to the inhibition of viability and promotion of apoptosis in HCT116 cells.
The limitations of the present study were the use of a single shRNA when conducting GSG2 functional studies, as the results may have been influenced by the off-target effects of RNA interference. CRISPR/Cas9 technology was a more promising format for the complete knockout of GSG2. Moreover, animal experiments may help to further clarify the exact function and regulatory mechanisms of GSG2 in CRC.
Conclusion
In conclusion, the present study revealed that GSG2 was expressed in CRC tissues and cell lines, and that GSG2 knockdown by shRNA lentivirus suppresses cellular viability and colony formation, and induces apoptosis in HCT116 and RKO CRC cells. In addition, western blotting verified that several proto-oncogenes or suppressor genes (namely Myc, NF-κB, Snail-1, and β-catenin) are regulated by GSG2 in CRC cells. To the best of our knowledge, the present study is the first to provide novel insights on future therapeutic targets of GSG2 in CRC.
Ethical Approval
This work is not a research involving human participants and/or animals.
Footnotes
Authors' Contributions
C.Z. conceived and designed the experiments. W.Y. and Y.F. performed all the experiments. W.Y. and W.L. wrote and revised the article. All authors read and approved the final version of the article.
Author Disclosure Statement
No competing financial interests exist.
Funding Information
The work was supported by Suzhou Science and Technology Project (grant no. SYS201752).