




Abstract
Background:
Mutations in the fibroblast growth factor receptor 3 (FGFR3) gene are related to skeletal dysplasias (SDs): acondroplasia (ACH), hypochodroplasia (HCH) and type I (TDI) and II (TDII) tanatophoric dysplasias. This study was designed to standardize and implement a high-resolution melting (HRM) technique to identify mutations in patients with these phenotypes.
Methods:
Initially, FGFR3 gene segments from 84 patients were PCR amplified and subjected to Sanger sequencing. Samples from 29 patients positive for mutations were analyzed by HRM.
Results:
Twelve of the patients FGFR3 mutations had ACH (six g.16081 G > A, three g.16081 G > C and three g.16081 G > A + g.16002 C > T); thirteen of patients with HCH had FGFR3 mutations (eight g.17333 C > A, five g.17333 C > G and five were negative); and four patients with DTI had FGFR3 mutations (three g.13526 C > T and one g.16051G > T and two patients with DTII (presented mutation g.17852 A > G). When analyzing the four SDs altogether, an overlap of the dissociation curves was observed, making genotyping difficult. When analyzed separately, however, the HRM analysis method proved to be efficient for discriminating among the mutations for each SD type, except for those patients carrying additional polymorphism concomitant to the recurrent mutation.
Conclusion:
We conclude that for recurrent mutations in the FGFR3 gene, that the HRM technique can be used as a faster, reliable and less expensive genotyping routine for the diagnosis of these pathologies than Sanger sequencing.
Introduction
The fibroblast growth factor receptor 3 (FGFR3) gene spans over 22,561 bp in the human chromosome 4p13 and is a member of a gene family that codes for four tyrosine kinase receptors for fibroblast growth factors (FGFs). The FGFR3 protein has three immunoglobulin-like domains (IgI, IgII, and IgIII) in its extracellular region, a transmembrane (TM) domain and two tyrosine kinase domains (TK1, TK2) in its intracellular region (Harada et al., 2009). Mutations in the FGFR3 gene have been associated with some skeletal dysplasias (SD) such as achondroplasia (ACH) (OMIM: 100800), hypochondroplasia (HCH) (OMIM: 146000), thanatophoric dysplasia type I (TDI) (OMIM: 187600), and thanatophoric dysplasia type II (TDII) (OMIM: 187601).
ACH is the most common form of skeletal dwarfism, with an incidence of 1:10,000 to 1:30,000 live births, followed by HCH. Both conditions have clinical and radiological characteristics, including macrocephaly, brachydactyly, and metaphyseal enlargement, shortening of the pedicles of the vertebrae, narrowing of the interpedicular distance, square ilia, and short femoral neck. However, the abnormalities observed in ACH are more severe than those observed in HCH (Heuertz et al., 2006). TD is a congenital skeletal dysplasia, sporadic, and generally lethal at birth. Its incidence ranges from 1:20,000 to 1:50,000 live births and is characterized by micromelia, small chest, platyspondyly (flat vertebral bodies), and macrocephaly. TD is divided into two subtypes: type I and type II, which can be differentiated by the shape of the skull and the morphology of the femur (Sharma et al., 2015). Even though they are distinct diseases, some overlapping characteristics among SDs make specific diagnosis difficult. Therefore, methodologies that molecularly distinguish SDs can assist in the differentiation of SDs.
The molecular etiology of ACH is caused, in about 99% of the cases, by the p.Gly380ArgG>A and p.Gly380ArgG>C mutations (Wang et al., 2013; Ornitz and Marie, 2015). HCH mutations are dispersed in FGFR3 gene, with a point mutation in the p.Asn540Lys tyrosine kinase domain, responsible for 60-65% of affected patients (Almeida et al., 2009). TDI originates from several amino acid substitutions in extracellular and intracellular domains of the FGFR3 protein, such as p.Arg248Cys, p.Tyr 373Cys, and p.Lys650Met. Unlike TDI, only one mutation (p.Lys650GluA>G) has been shown to be responsible for TDII (Foldynova-Trantirkova et al., 2011). Most of these mutations are caused by events associated with paternal age over 36 years (Orioli et al., 1995).
Several methods for mutation screening and genotyping have been used and, Sanger's sequencing is considered the “gold standard.” Most of these methodologies are relatively labor intensive, time consuming and expensive, on the other hand high-resolution melting (HRM) is a fast, simple, closed-tube, economical post-polymerase chain reaction (PCR) method, with high specificity and sensitivity, where data can reveal amplicon melting temperatures as peaks. A comparison of data derived from homozygous wild types, homozygous mutant, and heterozygous samples can reveal differences in peak characteristics such as peak number and position. Two peaks represent heterozygote amplicons, whereas one peak indicates homozygotes at different positions for wild type and mutant (Słomka et al., 2017; Er T-K et al., 2012; Hosseini-Safa et al., 2018).
For genotyping purposes, samples carrying known recurrent mutations can be used as positive controls and homozygous wild types as negative controls. Unique melting profile can discriminate between control and patient samples, by grouping amplicons with similar melting curve shape together (Zhou et al., 2005; Ribeiro Ferreira et al., 2019).
This makes this two-step method a high-throughput technique, suitable for mutation tracking or for the routine detection of known variants (based on a defined single nucleotide polymorphism curve [SNPs]).
HRM technique has been used to detect mutations in several diseases, including SD related to the FGFR3 gene (Hung et al., 2008; Liu et al., 2011; He et al., 2012).
In this study, we sequenced samples from a cohort of 84 Brazilian patients (43 male and 41 female, ranging from newborns to 15 years of age), with ACH, HCH, TDI, and TDII phenotypes and selected 29 to HRM analysis to detect mutations in the FGFR3 gene.
Materials and Methods
Patients and DNA samples
Peripheral blood samples were collected in anticoagulant tubes containing EDTA from 84 patients with clinical and radiographic diagnosis of SDs related to FGFR3 gene mutations. Genomic DNA was isolated using the salting out method (Miller et al., 1988). The study was approved by the IFF/Fiocruz Human Research Ethics Committee (approval number: 3.381.275) and the Free and Informed Consent Form was filled out by the patients.
DNA amplification by PCR
Exons 7 and 17 (TDI), 10 (ACH), 13 (HCH), and 15 (TDII) known for recurrent mutations in the FGFR3 gene were amplified by PCR with specific primers (available upon request) using the thermocycler Veriti from Applied Biosystems (Thermo Fisher Scientific). The amplifications were performed in a final volume of 50 μL, using 100 ng of genomic DNA, 10 mM of each dNTP (dATP, dCTP, dGTP, and dTTP), 1 U of Taq DNA polymerase enzyme (Promega), 1X buffer appropriate for the enzyme Taq DNA polymerase (Invitrogen), MgCl2 concentration according to the oligonucleotide used, and 10 picomol of each oligonucleotide (sense and antisense). The reactions were carried out in a final volume of 50 μL and incubated at 94°C for 5 min; and 35 cycles of 30 s at 94°C, 30 s at 54°C, and 30 s at 72°C; and finally an incubation at 72°C for 5 min.
PCR products were purified using the PureLink™ PCR Purification Kit (Invitrogen), following the manufacturer's instructions. The primers were designed based on the reference sequence of the FGFR3 gene (NG_012632.1).
Sanger sequencing
The PCR products were sequenced in an ABI 3730 automated DNA sequencer (Applied Biosystems) as described by Otto et al. (2008) using BigDye version 3.1 Sequencing Buffer (Applied Biosystems). Sequence data were analyzed using BioEdit Software version 7.2 (Ibis Biosciences).
HRM analysis
The amplification was established in a volume of 20 μL containing 10 μL of Melt Doctor™ HRM Master Mix (containing AmpliTaq Gold® 360 DNA Polymerase, MeltDoctor * trade; HRM Dye, dNTPs, including dUTP, and MgCl2), 10 pm from each initiator and 30 ng of isolated DNA. The amplification profile consisted of a single cycle of enzymatic activation at 95°C for 10 min, followed by 40 cycles of denaturation at 95°C for 15 s and an annealing/extension step at 60°C for 1 min. To determine the melting points, the curve analysis was performed at 95°C for 10 s and 60°C for 1 min, followed by slow heating from 65°C to 95°C at a rate of 1°C/s. All reactions were tested in triplicates, using the wild-type allele to compare the dissociation curves.
The qPCR-HRM analysis was performed using the 7500 Fast Real-Time PCR System (Life Technologies). The data were analyzed using the High-Resolution Melt software (version 3.0.1; Life Technologies).
Results
We selected 84 Brazilian patients with clinical and radiological diagnosis of SDs associated with the FGFR3 gene for molecular investigation by sequencing analysis, with 59 cases of ACH (49 p.Gly380Arg, 5 p.Gly380ArgG>C, and 5 p.Gly380ArgG>A + c.1076-17C>T), 18 cases of HCH (8 p.Asn540LysC>A, 5 p.Asn540LysC>G, and 5 negatives), 4 cases of TDI (3 p.Arg248CysC>T and 1 p.Gly370CysG>T), and 3 cases of TDII (Lys650GluA>G) (Table 1). No homozygous and double heterozygous variant(s) were found in patients included in this study.
Genotyping of 29 Brazilian Patients with Associated Fibroblast Growth Factor Receptor 3 Gene Skeletal Dysplasias
ACH, achondroplasia; HCH, hypochondroplasia; TDI/TDII, thanatophoric dysplasia type I/II; TM, transmembrane.
Polymorphism.
Allelic frequency of c.1076-17C>T.
Previously sequenced (Gomes et al., 2018).
Patient's characteristics and demographic data are available in the Table 2. It is noteworthy that the Instituto Brasileiro de Geografia e Estatística (IBGE), which is responsible for the official census of Brazil, has employed only few pre-established color categories based on ethnoracial self-classification with five groups: White, Brown or Mixed (“pardo” in official Portuguese), Black, Yellow (Asian), and Indigenous (Native American) (Schwartzman, 1999).
Patient's Characteristics and Demographic Data
NA, not available; TDI, thanatophoric dysplasia I; TDII, thanatophoric dysplasia II.
Among the 84 patients, 29 were selected for HRM analysis. Were included: 12 patients with ACH (6 p.Gly380ArgG>A, 3 p.Gly380ArgG>C, and 3 p.Gly380ArgG>A + c.1076-17C>T), 10 with HCH (6 p.Asn540LysC>A and 4 p.Asn540LysC>G), 4 with TDI (3 p.Arg248CysC>T and 1 p.Gly370CysG>T), and 3 TDII (Lys650GluA>G).
ACH patients
Sanger sequencing detected a heterozygous substitution p.Gly380ArgG>A in nine patients with ACH. In addition, concurrently with pathogenic variants, we identified one known SNP (rs17881967) in three of nine patients. The allele frequency in dbsnp (https://www.ncbi.nlm.nih.gov/snp/) T = 0.0185/580 (GnomAD); T = 0.0188/94 (1000 genomes); T = 0.0208/270 (GoESP); and T = 0.0215/2700 (TOPMED). In addition, a heterozygous mutation p.Gly380ArgG>C was detected in three patients (Fig. 1).
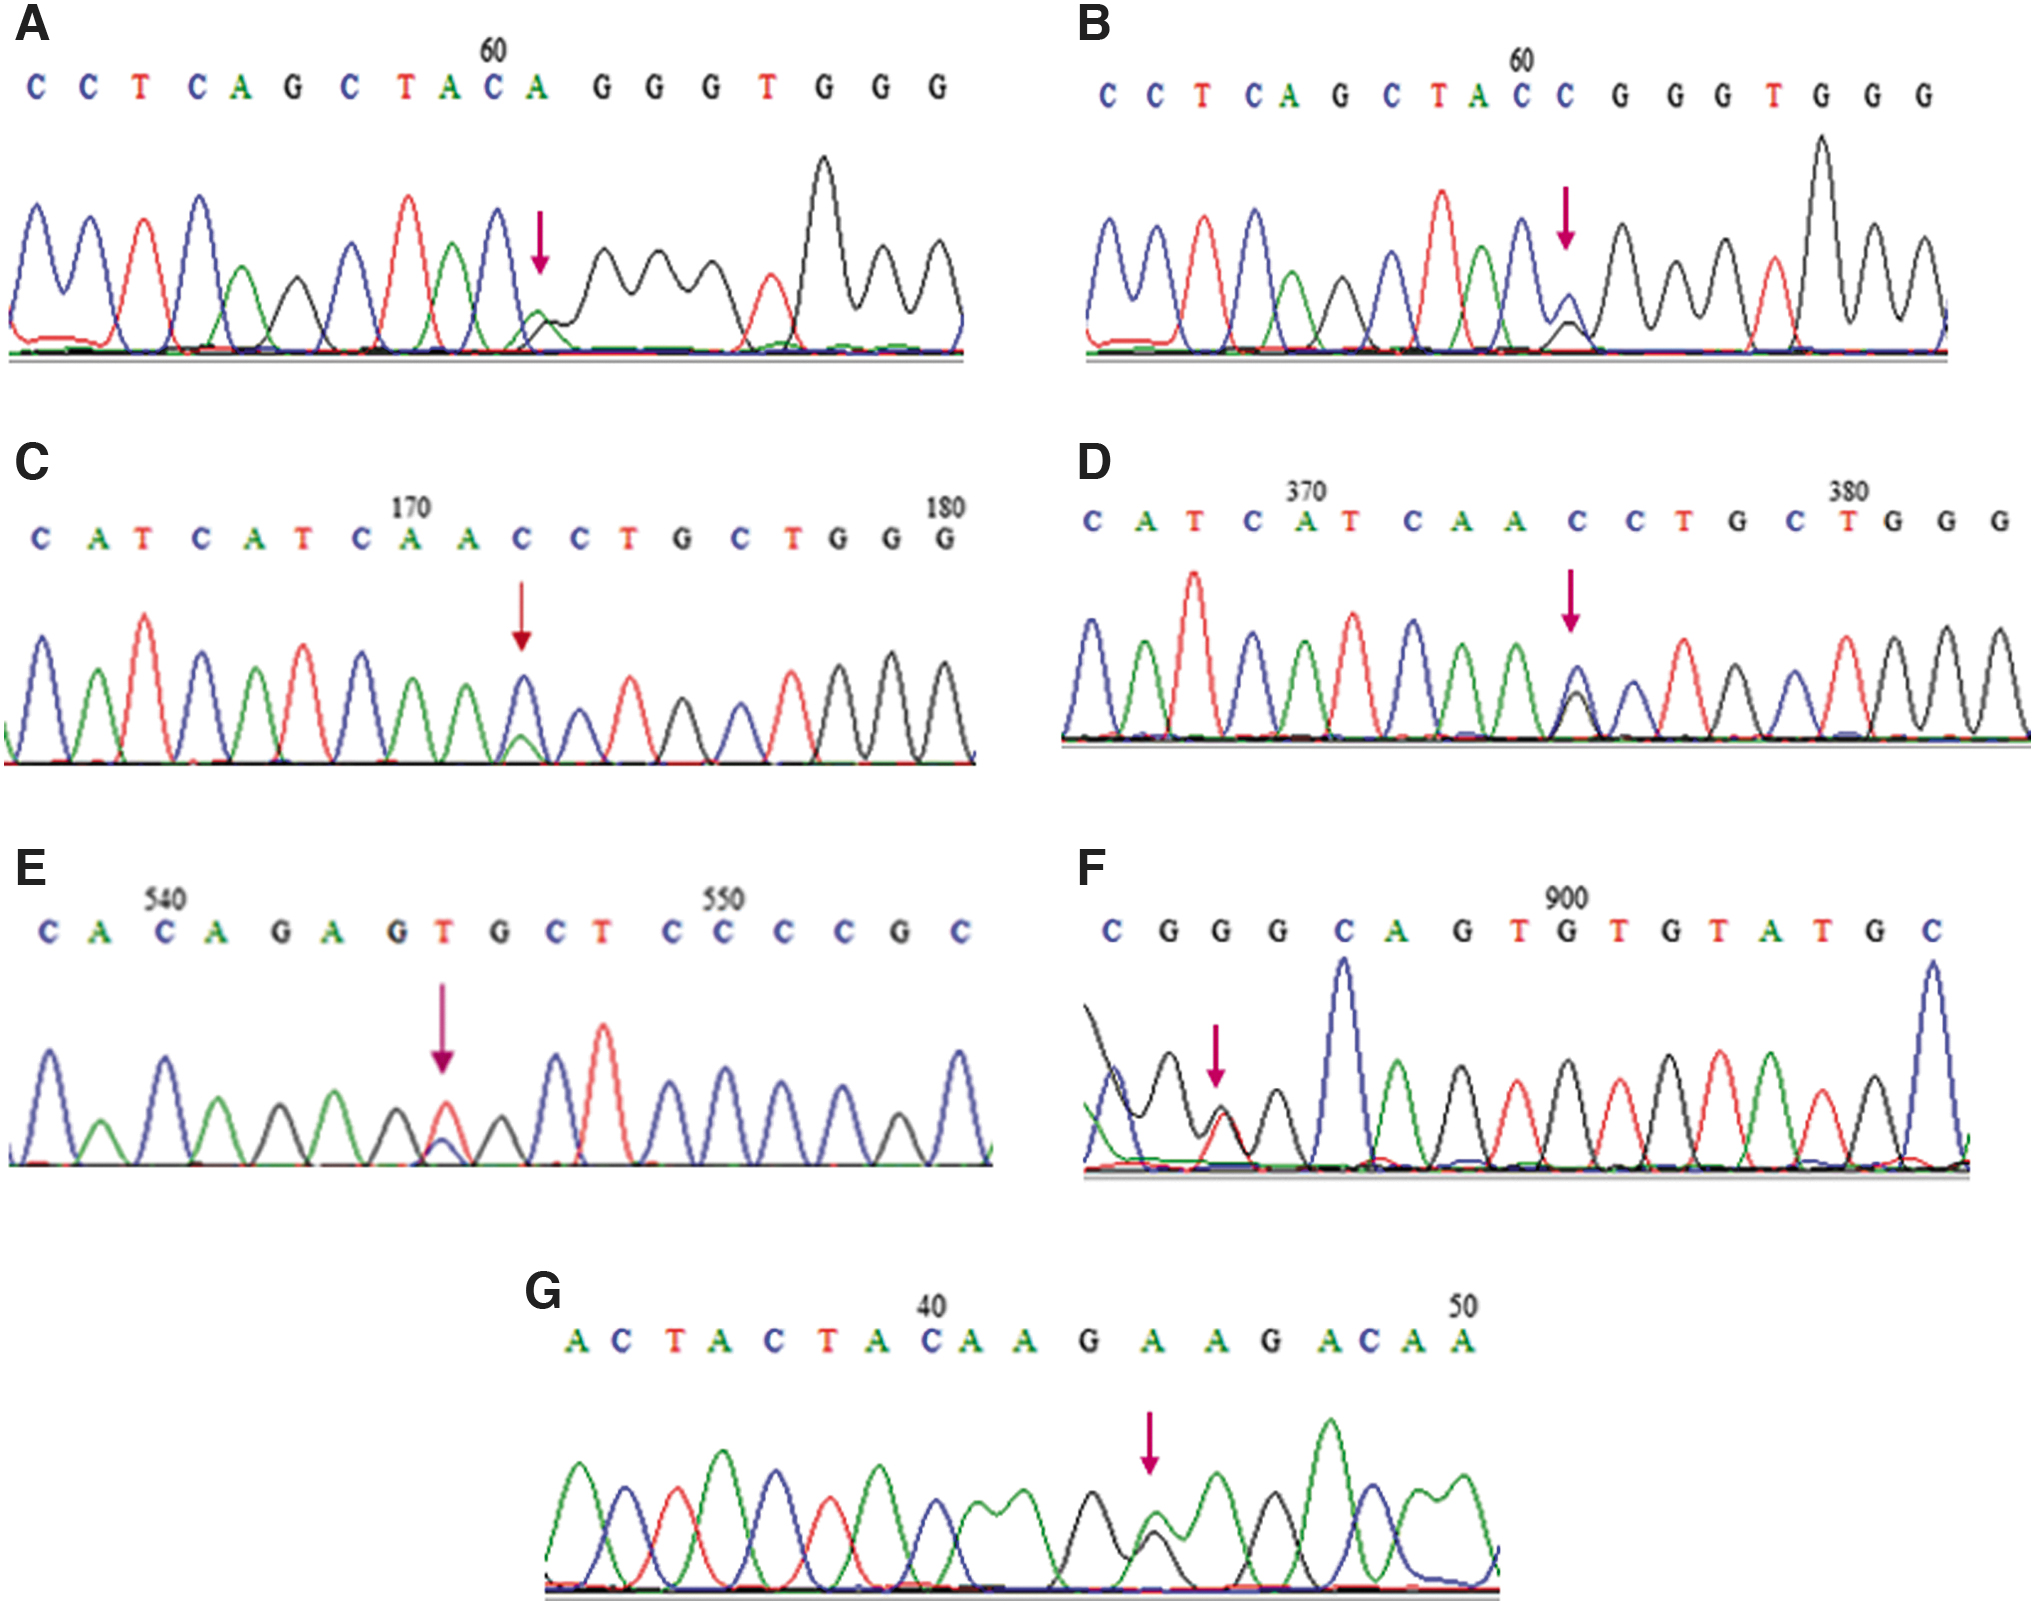
Electropherogram representative of the mutations that were identified.
These 12 samples from patients with ACH were submitted to analysis by HRM.
The 199bp amplicon dissociation curves can differentiate the two distinct mutations p.Gly380ArgG>A, p.Gly380ArgG>C, and the wild type (Fig. 2).

HRM analysis.
The mutations p.Gly380ArgG>A, p.Gly380ArgG>A+ c.1076-17C>T, and the wild type can also be distinguished through the dissociation fusion curve (Fig. 2).
Surprisingly, when we performed HRM analysis on DNA containing changes p.Gly380ArgG>A, p.Gly380ArgG>A+ c.1076-17C>T, and p.Gly380ArgG>C, it was not possible to discriminate the dissociation curve between the changes p.Gly380ArgG>C and p.Gly380ArgG>A+ c.1076-17C>T (Fig. 2).
HCH patients
Among the 10 patients with HCH, 6 presented the p.Asn540LysC>A mutation through Sanger sequencing and 4 patients the p.Asn540LysC>G mutation (Fig. 1).
These samples from patients with HCH were also subjected to HRM analysis. The dissociation curves of amplicon (133 bp) can differentiate the two mutations: p.Asn540LysC>A and p.Asn540LysC>G (Fig. 2).
The clinical diagnosis in some cases of ACH and HCH can be difficult to establish, due to the phenotypic overlap, making it important to test the mutations underlying any disorder when ACH or HCH is suspected (Almeida et al., 2009; Xue et al., 2014).
The patient´s samples were analyzed together using the HRM technique making it possible to differentiate samples with mutation g.16081 (ACH) from those with alteration p.Asn540Lys (HCH) (Fig. 2).
TDI patients
The heterozygous substitution p.Arg248CysC>T was detected in Sanger sequencing in three patients with TDI. In addition, a p.Gly370CysG>T mutation was detected in one patient (Fig. 1).
All four samples from patients with TDI (mutations p.Arg248CysC>T and p.Gly370CysG>T) were successfully identified by HRM analysis. Figure 2 shows the high-resolution dissociation curves of the three genotypes (wild type and heterozygous).
TDII patients
We detected the heterozygous substitution p.Lys650GluA>G using the Sanger sequencing in three patients with TDII (Fig. 1).
These three samples from patients with TDII were also submitted to HRM analysis. Figure 1 shows the high-resolution dissociation curves of the three genotypes (wild type and heterozygous).
The HRM technique was performed using, jointly, all the mutations found for the four SD
Discussion
In this study, we used the analysis of the HRM for rapid genotyping of exons 7, 17, 10, 13, and 15 of the FGFR3 gene. A total of 12 samples from patients with ACH, 10 with HCH, 4 with TDI, and 3 with type TDII.
With the analysis of the HRM technique, it was possible to differentiate the samples that presented the p.Gly380ArgG>A and p.Gly380ArgG>C mutations, when compared with the wild type. These data corroborate those obtained from sequencing analysis.
However, it was not possible to distinguish the dissociation curve of the samples of patients with ACH presenting the change p.Gly380ArgG>A + c.1076-17C>T, from the positive samples for the p.Gly380ArgG>C mutation. Under the conditions applied in this study, the ideal would be to perform separate runs for each change, or try to solve the problem with the use of a new pair of oligonucleotides, where the size of the amplicon was smaller than those used herein. The resolution of the HRM methodology can be increased by optimizing amplified regions and, above all, reducing the size of the amplicon.
The length of the fragment used in the HRM technique is the most discussed limitation in the literature. Słomka et al. (2017) communicated that there was a low resolution in the dissociation and partial overlap in the dissociation curve of the samples when using initially oligonucleotides with a length of 108 bp. Consequently, new oligonucleotides were synthesized with the resulting amplicon of 74 bp, and a significant improvement in the dissociation curve was observed. Also, Vossen et al. (2009), recommended that for routine work, it is better to use small fragments, 150 to 250 bp for gene scanning and 80 to 100 bp for genotyping.
It is worth mentioning that there is a phenotypic overlap between ACH and HCH, which can lead to a difficulty in classifying the clinical and radiological criteria as milder form of ACH or more severe form of HCH (Horton et al., 2007). Therefore, samples from patients with clinical suspicion of HCH and ACH were routinely investigated for both dysplasias.
For this reason, samples from patients with ACH and HCH were tested together using the HRM technique. We then observed a change in the dissociation curve when comparing the results for each SD. It is possible to significantly differentiate samples with the p.Gly380Arg (ACH) mutation from samples with p.Asn540Lys (HCH).
Through the HRM technique, it was possible to differentiate HCH-related p.Asn540LysC>A and p.Asn540LysC>G mutations, although the difference in the dissociation curve is subtle. However, when analyzed in conjunction with ACH-related mutations, the change in the dissociation curve was more pronounced than before.
Furthermore, we also observed that samples from patients with HCH showed two peaks in the dissociation curves during the trial. This result suggests two dissociation domains in a single PCR product. A similar result was observed by Dos Santos Rocha et al. (2018) who described two dissociation domains in a single DNA sequence, where two GC-rich regions were observed that dissociated at different temperatures, resulting in two peaks. An alternative to solve this problem would be to reduce the size of the amplicon used in the HRM technique, restricting it further around the target SNP. Reed et al. (2006) demonstrated that, by increasing the length of the fragment, the difference between wild and mutated curves becomes smaller. By decreasing the size of the fragment, there was a significant improvement in the melting curve during the HRM technique.
Some methods have been developed to determine point mutations for detecting differences in the DNA sequence. Many of these techniques require great automation, separation of the samples into gel and, for some, enzymatic or chemical processing it is still needed. For this reason, HRM is a technique that presents low cost and requires little time to be performed, which reduces the unnecessary amount of sequencing and increases the number of samples to be analyzed. HRM can be considered a simple, reliable, cheap, and fast alternative for genotyping studies (Reed et al., 2007; Yang et al., 2014).
HRM analysis has several limitatations and according to the literature (Reed et al., 2007; Ghasemi et al., 2016; Abidi et al., 2017; Słomka et al., 2017), one of the main factors that alter the results of the technique is DNA with a high salt content. It is recommended that these samples be extracted from commercial kits and resuspended in a low salt buffer, such as Tris-EDTA. In the present study, the DNAs of the patients used for the HRM technique, were extracted using the salting out method, a technique to separate the genomic DNA using high concentrations of salt (Miller et al., 1988). The difference in the dissociation curve of the samples that were extracted by kit from the samples obtained by salting out was not observed.
As cases of SDs usually have recurrent mutations, the HRM technique can be used as a genotyping method for detecting recurrent changes using specific genotypes as a control (He et al., 2012).
In this study, the HRM technique proved to be effective in discriminating samples from control subjects from samples from individuals that had any mutation present in one of the four studied dysplasias.
Footnotes
Authors' Contributions
F.R.G.R. was responsible for patient genotyping, data curation, and article writing. M.E.S.G. and M.C.C.Z. assisted in conducting molecular studies. N.C.R. assisted in standardization of the HRM technique. J.C.L. provided patient samples and data. A.L.M. contributed to the design of the research and assisted in performing the HRM technique. S.G. devised the project, data curation, and project administration. A.L.M. and S.G. also wrote the article.
Acknowledgments
The authors thank all the doctors who provided samples and patient data. They also thank all patients and family members who participated in this study. The authors are appreciative of the Genomic Platform—DNA Sequencing—RPT01A (Fiocruz Technological Platform Network).
Author Disclosure Statement
No competing financial interests exist.
Funding Information
This work was funded by the Research Incentive Program—PIP IFF/Fiocruz/Fiotec (IFF-008-FIO-13-3-18-30), Curricular Internship Program—PEC IFF/Fiocruz, Institutional Scientific Initiation Scholarship Program—PIBIC/CNPQ, National Council for Scientific, Technological Development—CNPq (402008/2010-3 and 590148/2011-7 for DPC), and BioMarin Pharmaceutical.