




Abstract
Introduction
Breast cancer is the most common cancer among women in the United States and remains the second leading cause of cancer death in the world (Ahmad 2019; Narayan et al., 2020). Triple-negative breast cancer (TNBC) constitutes only ∼15% of all diagnosed invasive breast cancer cases in the United States (Jemal et al., 2009; Prakash et al., 2020). TNBC refers to breast cancer cells that lack the expression of the estrogen receptor (ER), nuclear progesterone receptor (nPR), and human epidermal growth factor receptor 2 (HER2) (Carey et al., 2006; Irvin and Carey, 2008; Chen et al., 2012).
TNBCs tend to behave more aggressively and have a poorer prognosis than other subtypes of breast cancer (Perou et al., 2000; Chacon and Costanzo, 2010; Sharma, 2018; Howard and Olopade, 2021). This is, in part, due to limited treatment options available compared to other molecular subtypes (Costa and Gradishar, 2017; Plevritis et al., 2018).
Although not synonymous, TNBC clinical phenotypes are mostly made up of basal-like molecular subtypes and the most common histological feature is infiltrating ductal carcinoma (Trop et al., 2014). TNBCs can exhibit geographic necrosis, a pushing border of invasion, and a stromal lymphocytic response (Livasy et al., 2006). In mammograms, TNBCs lack speculated margins, irregular shape, and suspicious calcifications associated with other forms of breast cancers, despite being significantly larger than other subtypes at the time of diagnosis (Farshid and Walters, 2018). Although ultrasound and MRI are highly sensitive in detecting breast cancers, both are associated with a high false-positive rate (Baltzer et al., 2010).
Unfortunately, imaging studies do not provide early detection of TNBCs. Most TNBCs are detected after palpating a large mass in the breast tissue, or when the patient starts showing symptoms like tenderness of the breast and pathologic nipple discharge (Provencher et al., 2016). After a diagnosis of TNBC, patients have limited options for treatment since immunotherapies that target the ER, PR, and HER2 receptors are ineffective (Zhu et al., 2021). Two of the only main options remaining are surgery and chemotherapy. If TNBCs are caught during the early stage (stage I-III), and the tumor is small enough, it can be removed by surgery followed by an examination of the sentinel lymph node (Sekine et al., 2020).
If the sentinel lymph node is found to have cancer, surgery is frequently complemented with radiation. For late-stage (stage IV) TNBCs, chemotherapy with drugs like anthracyclines, taxanes, and platinum is usually first-line treatment options (Villarreal-Garza et al., 2014; Mustacchi and De Laurentiis, 2015; Davison et al., 2021). If the TNBC tumor expresses PDL1 (used to suppress immune responses), immunotherapy plus chemotherapy are frequently implemented (Ghosh et al., 2021).
Progesterone (PRG), a sex steroid hormone, is capable of inducing its effects through classic, nonclassic, or combined responses by binding to either classic nuclear PRG receptors (nPRs) or nonclassic membrane PRG receptors (mPRs). Under PRG-induced actions, it has been found that the CSC (CCM signaling complex), composed of CCM1, CCM2, and CCM3, can couple both nPRs and mPRs into a CSC-mPR-PRG-nPR (CmPn) signaling network, which plays an important role in breast cancer tumorigenesis (Abou-Fadel et al., 2020a). Mifepristone (MIF), an nPR antagonist and mPR agonist, has been shown to suppress basal TNBC stem cells (Liu et al., 2016).
Our previous data show that combined steroid actions (MIF+PRG) is mPR specific, and work synergistically toward mPRs (Abou-Fadel et al., 2020a). Furthermore, several reports have demonstrated that elevated levels of MIF can enhance growth inhibition and induction of apoptosis in the presence of high-dose PRG in either nPR(±) subtype, and is also able to inhibit the growth of nPR(−) MB231 [TNBC-Caucasian American women (CAW)] cells (Liang et al., 2003; Moe et al., 2009; Fjelldal et al., 2010). Among TNBCs, over 70% are basal phenotype, one of the most aggressive TNBCs, and mPR role in tumorigenesis, especially in basal phenotype, is of great interest since basal phenotype-derived breast cancer cells do not express nPRs (Zuo et al., 2010).
In our previous studies, utilizing a multiomics and systems biology approach, at both the transcriptional and translational levels, we identified 21 clinically relevant African American women (AAW)-TNBC-specific biomarkers with differential expression, in basal A (BaA) MDA-MB-468 (MB468) cells with significant survival curves, generating a collection of intrinsic and mPR-specific steroid-inducible biomarkers for AAW-TNBCs (Abou-Fadel et al., 2021).
In this study, utilizing similar techniques, we are extending our previous findings by utilizing basal phenotype breast cancer line basal B (BaB) MDA-MB-231(MB231) cells, which also only express mPRs (Dressing and Thomas, 2007; Pang and Thomas, 2011; Dressing et al., 2012), to investigate the roles of key players of our previously defined CmP network (Abou-Fadel et al., 2021) under mPR-specific steroid actions, specifically in CAW-derived TNBC cells.
Our main objective is to understand the molecular regulatory mechanisms in breast cancer tumorigenesis, under mPR-specific steroid actions, through cellular and molecular manipulation of CAW-derived TNBC cell lines in vitro. Twenty-one potential biomarkers, initially identified in CAW-derived TNBC cells at both the transcriptional and translational levels, under mPR-specific steroid actions, followed by filtration with human clinical data associated with altered expression in CAW-TNBC tissues, have been identified through our systems biology approach, which is essential for establishing a solid foundation for future CAW-TNBC therapeutic strategies.
Materials and Methods
Cell culture and treatments
Cell culture and treatments
Cell culture and treatments were performed as previously described (Abou-Fadel et al., 2021). Briefly, nPR(−) MDA-MB-231 CAW-derived TNBC cells were cultured in RPMI1640 medium following manufacturer's instructions (ATCC), and once cells reached 80% confluency, cells were starved with FBS-free RPMI1640 medium for 3 h, followed with either vehicle control (ethanol/DMSO, VEH) or combined steroids (MIF+PRG, 20 μM each). After cells were treated, they were harvested for RNA and protein extraction as described before (Jiang et al., 2019; Abou-Fadel et al., 2020c).
RNA extraction, RT-qPCR, and RNA-seq for CAW-derived TNBC cells
RNA extraction was performed as previously described (Abou-Fadel et al., 2021). Briefly, total RNAs from MDA-MB-231 cells were extracted using TRIZOL reagent (Invitrogen) following the manufacturer's protocol. The cell monolayer was rinsed with ice-cold PBS and then lysed directly in a culture dish with 1 mL of TRIZOL reagent by scraping with a cell scraper. The cell lysate was aspirated and dispensed several times using a pipette and vortexed thoroughly. The purity and integrity of each RNA sample were analyzed using a Bioanalyzer (Agilent). All RNA-seq data were produced using Illumina HiSeq 2000; clean reads for all samples were over 99.5%; 60-80% of reads were mapped to respective reference genomes.
RNA-seq processing of files to assemble interactomes for CAW-derived TNBC cells
RNA-seq was performed as previously described (Abou-Fadel et al., 2021). Briefly, RNA-seq files were processed through paired-end (PE) sequencing with 100 bp reads (2 × 100) in Illumina HiSeq2000. The data consisted of four FASTQ files, two PE FASTQ files for each of the two groups: MDA-MB-231_Veh and MDA-MB-231_MP treated 48hrs with both cohorts having biological and technical duplicates.
RNA data were cleaned and ensured to pass quality control before performing bioinformatics analysis. After extracting the FASTQ files, they were aligned to the Human Genome Build 38 (GRCh38) using HISAT2 and then converted to SAM using SAMtools 1.9 and SAMtools quick check. The SAM files were then converted to BAM files, sorted, and Cufflinks was used to assemble transcripts and cuffmerge to merge all the transcript files.
Differential gene expression was performed with CuffDiff followed by identifying differentially expressed genes between cohorts using a Python script and annotated in Excel. Identified significant differentially expressed genes were then filtered using our MDA-MB-468_MP treated (AAW-derived TNBC cells) RNA-seq data (Abou-Fadel et al., 2021) to obtain significant differentially expressed genes unique for MDA-MB-231_MP treated cells.
The remaining differentially expressed genes after filtering were inputted into the PANTHER (Mi et al., 2021) classification system (GeneONTOLOGY) as well as iDEP (Ge et al., 2018) (Integrated Differential Expression and Pathway Analysis) program to generate heat maps and build signaling networks with altered GO biological processes, GO molecular functions, PANTHER protein classes, and altered KEGG pathways.
Protein extraction and proteomics analysis for CAW-derived TNBC cells
Protein extraction and quality assessment
Protein extraction for MDA-MB-231 cells was performed as previously described (Abou-Fadel et al., 2021). Briefly, MDA-MB-231 cells were harvested and lysed using a digital sonifier cell disruptor (Branson model 450 with model 102C converter and double-step microtip) in ice-cold lysis buffer (50 mM Tris-HCl (pH 7.5), 150 mM NaCl, 0.5% NP-40 (Sigma), 50 mM sodium fluoride (Sigma), 1 mM PMSF (Sigma), 1 mM dithiothreitol (Invitrogen), and 1 EDTA-free complete protease inhibitor tablet (Roche)). Protein concentration was assessed using a Qubit assay (Invitrogen). For proteomics analysis, 20-25 μg of protein was prepped using the filter-aided sample preparation (FASP) method (Expedeon, San Diego, CA).
Samples were reduced with 10 mM DTT for 30 min at RT, centrifuged on a spin filter at 14,000 g for 15 min at RT, and washed twice with 8 M urea in 50 mM Tris-HCl buffer. Samples were then washed 3 × with 50 mM ammonium bicarbonate, then digested with trypsin (Sigma-Aldrich, St. Louis, MO), and peptides eluted using 0.1% formic acid.
Liquid chromatography-tandem mass spectrometry
Liquid chromatography-tandem mass spectrometry (LC-MS/MS) for MDA-MB-231 cells was performed as previously described (Abou-Fadel et al., 2021). Briefly, the cell lysates were generated from the two cohorts, MDA-MB-231_Veh and MDA-MB-231_MP treated 48 h. All cohorts consisted of biological triplicates. After FASP preparation, four microliters of each digested sample (100 ng/μL) was loaded onto a 25-cm custom-packed porous silica Aqua C18, 125Å, 5 μm (Phenomenex) column. The porous silica was packed into a New Objective PicoTip Emitter, PF360-100-15-N-5, 15 ± 1 μm, pre-equilibrated with 95% solvent A (100% water and 0.1% formic acid) and 5% solvent B (90% acetonitrile, 10% water, and 0.1% formic acid) before injection of the digested peptides.
LC separation of the peptides was performed on an Ultimate 3000 Dionex RSLC-nano UHPLC (Thermo Fisher Scientific), equilibrated with 95% solvent A and 5% solvent B (equilibration solution).
Samples were loaded onto the column for 10 min (flow rate of 0.5 μL/min), before beginning the elution gradient. Solvent B was increased from 5% to 35% over 85 min, followed by a sharp increase to 95% solvent B over 5 min. The plateau was maintained at 95% solvent B for 9 min, followed by a sharp decrease to 5% solvent B over 1 min. Peptides were analyzed using a Q Exactive Plus Hybrid Quadrupole-Orbitrap Mass Spectrometer (Thermo Fisher Scientific), equipped with a Nanospray Flex Ion Source (Thermo Fischer Scientific). Parameters for the mass spectrometer were as follows: full MS; the resolution was set at 70,000 and 17,500, for MS1 and MS2, respectively; AGC target was set at 3e6 and 1e5 for MS1 and MS2, respectively; Max IT at 50 ms; scan range from 350 to 1600 m/z dd-MS2; Max IT at 100 ms; and isolation window at 3.0.
Proteomics processing of files for CAW-derived TNBC cells
Proteomics data analysis for MDA-MB-231 cells was performed as previously described (Abou-Fadel et al., 2021). Briefly, analysis was performed with Proteome Discoverer (PD) 2.1.1.21 (Thermo Fisher Scientific), using an FDR of 1%. The Human Database was downloaded in FASTA format on July 1, 2021, from UniProtKB; www.uniprot.org/. Common contaminants (trypsin autolysis fragments, human keratins, and protein laboratory standards) were included in the contaminants database (Mellacheruvu et al., 2013). The following parameters were used in the PD: HCD MS/MS; fully tryptic peptides only; up to two missed cleavages; parent-ion mass tolerance of 10 ppm (monoisotopic); and fragment mass tolerance of 0.6 Da (in Sequest) and 0.02 Da (in PD 2.1.1.21) (monoisotopic).
A filter of two high confidence peptides per protein was applied for identifications. PD dataset was further processed through Scaffold Q + 4.8.2 (Proteome Software, Portland, OR). A protein threshold of 99%, peptide threshold of 95%, and a minimum number of two peptides were used for protein validation. Data were then exported to perSPECtives 3.0.0 (Proteome Software, Portland, OR) and used to validate and statistically compare protein identifications derived from MS/MS search results. Proteomic biological and technical samples were analyzed by Students t-test with a multiple test correction using Benjamini-Hochberg procedure and an FDR level of 0.05. Normalized weighted spectral counts were used for the comparisons. A cutoff of p ≤ 0.05 was utilized to determine significance in vehicle and PRG+MIF-treated comparisons.
Processing of proteomic files to assemble interactomes for CAW-derived TNBC cells
Bioinformatics data analysis for MDA-MB-231 cells was performed as previously described (Abou-Fadel et al., 2021). Briefly, a Python script was created to identify differentially expressed proteins in vehicle and PRG+MIF-treated comparisons. These comparisons were annotated and identified significant differentially expressed proteins were then filtered using our MDA-MB-468_MP treated proteomics data (Abou-Fadel et al., 2021) to obtain significant differentially expressed proteins unique for MDA-MB-231 cells.
The remaining differentially expressed proteins after filtering were inputted into the PANTHER (Mi et al., 2021) classification system (GeneONTOLOGY) as well as iDEP (Ge et al., 2018) (Integrated Differential Expression and Pathway Analysis) program to generate heat maps and build signaling networks as aforementioned.
Omics analysis to assemble interactomes for CAW-derived TNBC cells at both the transcriptional and translational levels
A Python script was created to identify shared differentially expressed genes/proteins identified in MDA-MB-231_MP treated samples compared to MDA-MB-231_Veh treated samples. These were annotated in Excel, and simple set operations were used to find the overlaps. The overlaps were then filtered using our MD-MBA-468_MP treated 48 h proteomics/RNA-seq data (Abou-Fadel et al., 2021) to obtain significant differentially expressed genes/proteins unique for MDA-MB-231 (CAW-derived TNBC) cells. The genes/proteins were inputted into the PANTHER (Mi et al., 2021) classification system (GeneONTOLOGY) as well as iDEP (Ge et al., 2018) (Integrated Differential Expression and Pathway Analysis) program to generate heat maps and build signaling networks as aforementioned.
The goal was to identify similarities between MDA-MB-231_MP-treated 48-h samples (compared to vehicle samples) at both the transcriptional and translational levels. The agreements in differential expression were noted using the Python comparison script.
Prognostic outcomes for key CmP members using TNBC patient samples
Differential expression of key CmP members using TCGA
Expression analysis was performed as previously described (Abou-Fadel et al., 2021). Briefly, utilizing publicly available microarray data (normalized) from TCGA, we assessed expression profiles of key CmP members using various datasets to include phenotypic filters such as PAM50 classification, race, and tumor growth and lymph node infiltration measurements, as well as tumor recurrence information from follow-up data (Goldman et al., 2020).
In addition, microarray data containing breast cancer tumors, with progesterone receptor (PR) status determined by immunohistochemistry (IHC), were analyzed using kmplot software (Gyorffy et al., 2010). This resulted in 925 nPR(−) and 926 nPR(+) breast cancer samples that were used to obtain expression data for the candidate biomarkers identified in this study.
Differential expression of candidate biomarkers using RNA-seq data for AAW- and CAW-TNBCs
Expression analysis for AAW- and CAW-TNBCs was performed as previously described (Abou-Fadel et al., 2021). Briefly, to evaluate the basal expression of our identified candidate biomarkers in AAW- and CAW-TNBC tumor samples, we utilized publicly available RNA-seq data comparing expression levels in 23 AAW-TNBCs and 19 CAW-TNBC tumor samples that were used for the analysis of the candidate biomarkers identified in this study (Saleh et al., 2021).
Construction of Kaplan-Meier survival curves for identified CAW-TNBC biomarkers
Construction of Kaplan-Meier (KM) survival curves for TNBC patients was performed as previously described (Abou-Fadel et al., 2021). Briefly, publicly available microarray data (22,277 probes) from 1809 breast cancer patients were analyzed using KM plotter (Gyorffy et al., 2010) integrating gene expression and clinical data simultaneously. To ensure the patients in the database reflected cohorts seen in everyday clinical practice, we only analyzed cohort data similar to SEER published prevalence's (Gyorffy et al., 2010). In addition, publicly available microarray data were also assessed from TCGA for CAW-TNBC patients to integrate gene expression and clinical data simultaneously (Goldman et al., 2020), to confirm the initial analysis performed using KM plotter.
Breast cancer patients were filtered to only analyze patient samples classified as TNBC/BASAL subtype [ER(−)/nPR(−)/HER2(−)], which reduced our initial 1809 patients to 176-442 patient samples (depending on biomarker analyzed, and database used). Log rank p-values, as well as hazard ratios (and 95% confidence intervals), were calculated by the software (Gyorffy et al., 2010).
Statistical analysis
For transcriptomics analysis
All pairwise multiple comparison procedures were analyzed using Tukey and Student's t-test. For proteomics analysis, all pairwise multiple comparison procedures were analyzed using Tukey and Student's unpaired t-test. For microarray/RNA-seq analysis, statistical significance was performed with Student's t-test. All graphs, plots, and charts were constructed and produced by SigmaPlot 12.0 (Systat Software, Inc.) and GraphPad Prism 8.
Results
Differential expression of mPRs and CCM genes across clinical tumors suggests their simultaneous involvement in breast cancer tumorigenesis
Given our recent findings of the CSC's potential significant role in reproductive tumorigenesis, and the important functions of mPRs for PRG signaling (Zhang et al., 2017; Abou-Fadel et al., 2019, 2020c, 2020d; Jiang et al., 2019), we began by evaluating basal expression of key CmP players, including the CSC (CCM1-3) and mPRs (PAQR5-9 and PGRMC1/PGRMC2) in breast cancer tumor tissues using publicly available RNAseq databases in TCGA.
We first assessed CSC and mPR expression profiles by filtering tissues based on PAM50 classification, to evaluate expression data for two aggressive breast cancer tissues, basal [ER(−), nPR(−), and HER2(−)] and Her2 [ER(−), nPR(−), and HER2(+)] tumors, and observed significant differences in expression patterns of almost all CmP members (except CCM2/3, PAQR6, and PGRMC1) between the two subtypes (Fig. 1A), shedding light on the impact of HER2 receptor status on expression levels of key players in the CmP network.

RNAseq expression profiling for key CmP players utilizing multiple TCGA Breast cancer databases. Utilizing TCGA, we assessed expression profiles for key CmP members to evaluate TNBC outcomes using clinical tumor patient samples.
Next, when looking at only TNBC (Basal) tissues, we observed significant expression differences among the three most prevalent races diagnosed with TNBCs for CCM1/2, PAQR6, and PGRMC1, suggesting a potential role for these key CmP players in racial disparities observed in TNBC patients (Fig. 1B). When assessing expression differences among various histological types for only CAW-TNBCs, we observed significant differences in expression patterns of almost all CmP members (except PAQR6/8 and PGRMC1/2; Fig. 1C), reinforcing the involvement of both the CSC and mPRs during TNBC tumorigenesis. Next, we profiled CAW-TNBCs based on standard immune subtypes [categories used to represent features of the tumor microenvironment (TME)] involved in breast cancer and observed significant differential expression for CCM2/3, PAQR5, and PGRMC2 (Fig. 1D).
These results suggest involvement of the CSC and mPRs in the TME; this newer classification system using immune subtypes has proven to be essential in helping physicians cut across traditional breast cancer classifications (using histological types) to create new groupings and suggest alternative treatment approaches (Thorsson et al., 2018). Taken together (Fig. 1C, D), we can see that several key CmP members, including CCM2/3 and PAQR5, have significant differential expression in both the traditional histological as well as the newer immune subtype classification model used for characterizing and treating CAW-TNBC patients.
Differential expression patterns of mPR and CCM genes across various histological categories of CAW-TNBC tumors and their associated prognostic effects
TNM staging, a widely used system in cancer biology, allows for assisting in prognostic cancer assessment to evaluate tumor size (T), regional lymph node involvement (N), and metastases of the primary tumor (M). Tumor size assessment revealed significant alterations in expression of CCM1/3 across various tumor size categories (Fig. 1E), suggesting involvement of the CSC in influencing the size and extent of the primary tumor in CAW-TNBCs. Next, we repeated expression profiling to evaluate genes potentially involved in infiltration mechanisms into lymph nodes. We discovered significant differential expression for CCM1 and PAQR7 across multiple tumor lymph node status clinical samples, suggesting potential involvement of these key CmP members in lymph node infiltration mechanisms in CAW-TNBCs (Fig. 1F).
Together, these results validate the involvement of the CSC and mPRs in CAW-TNBC tumorigenesis by illustrating significant differential expression of key CmP members: (1) across various histological and immunological subtypes (TME) in CAW-TNBCs and (2) across various tumor and lymph node staging categories in CAW-TNBCs, all of which are summarized in Table 1.
Summarized Differential Gene Expression Patterns for Key CmP Members Utilizing Clinical RNAseq Data Available in TCGA
Differential gene expression patterns are summarized for key CmP players (column 1) assessing trends among Basal [ER(−), nPR(−), and HER2(−)] and Her2 [ER(−), nPR(−), and HER2(+)] tumors among CAW-TNBC patients (column 2), trends among the three most prevalent races diagnosed with TNBCs (column 3), trends among various histological types for CAW-TNBCs (column 4), trends among histological data evaluating tumor immune subtypes involved in CAW-TNBCs (column 5), trends among histological data evaluating size and extent of the primary tumor in CAW-TNBCs (Column 6), and finally trends among histological data evaluating infiltration into lymph nodes in CAW-TNBCs (Column 7).
Sig. Diff. Exp-, significant differential expression; CAW, Caucasian American Women; TNBC, triple-negative breast cancer; CmP, CSC-mPR-PRG signaling network.
Differential expression patterns of mPR genes across clinical tumors with follow-up clinical data on tumor recurrence
Tumor recurrence is an essential parameter to measure treatment effectiveness in TNBC patients. Patients, if treatment was ineffective, will present with local, regional, or distant recurrence. We evaluated CSC and mPR members' expression data in CAW-TNBC patient tumors integrating follow-up clinical data to assess impact on tumor recurrence and observed significant expression differences for PAQR9 (Fig. 2A) using the latest updated tumor status data from follow-up patients who were either tumor free or presenting with a new growth.

RNAseq expression profiling for key CmP players integrating follow-up clinical data using TCGA. Utilizing the TCGA PANCAN and GDC-TCGA breast cancer database, we evaluated CmP members' expression data in CAW-TNBC patient tumors integrating follow-up clinical data to assess impact on tumor recurrence.
In addition, CAW-TNBC patients with tumor recurrence were further divided based on type of recurrence, demonstrating significant differential expression for PGRMC1 (Fig. 2B) between patients presenting with a new primary tumor, locoregional disease [recurrence of cancer cells at the same site as the original (primary) tumor], or distant metastasis.
Interestingly, we observed significant differences in expression patterns for PAQR5 and PGRMC2 (Fig. 2C) when looking among the 4 major locations where tumor recurrence was observed. Finally, we also assessed CmP members' expression data for a few CAW-TNBC patients who had initially undergone therapy treatment. We observed significant differential expression for PAQR5 and PAQR7 (Fig. 2D) between patients who presented with new tumor growth vs no tumor growth, after their initial treatment, suggesting involvement of mPRs in influencing tumor recurrence even after therapy treatment.
Together, these results further solidify the involvement of CmP signaling network in CAW-TNBC tumorigenesis by illustrating significant differential expression of key CmP members using follow-up data to assess tumor recurrence, regardless of therapy treatment, which is summarized in Table 2. Therefore, we propose the future use of CmP members' expression data as potential prognostic biomarkers for CAW-derived TNBCs.
Summarized Differential Gene Expression Patterns (RNAseq) and Kaplan-Meier Survival Curves for Key CmP Members Utilizing Follow-Up Clinical Data Available in TCGA
Differential gene expression patterns are summarized for key CmP players (column 1) assessing trends among the latest updated tumor status from CAW-TNBC patient follow-up data, who were either tumor free or presenting with a new growth (column 2), trends among CAW-TNBC patients presenting with a new primary tumor, locoregional disease [recurrence of cancer cells at the same site as the original (primary) tumor] or distant metastasis (column 3), trends among the 4 major locations for tumor recurrence for CAW-TNBCs (column 4), trends among CAW-TNBC patients who presented with new tumor growth vs no tumor growth after they had initially undergone therapy treatment for their diagnosis (column 5), KM survival curve results obtained for TNBC patients in KM plotter (Column 6), and finally KM survival curve results obtained for CAW-TNBC patients in TCGA (Column 7).
D.S., decreased survival; N.S., No statistical significance; Up, higher expression levels in patient tumors; Down, lower expression levels in patient tumors.
Differential expression patterns of mPR and CCM genes across clinical tumors and their associated survival effects
To further evaluate prognostic effects for the CSC and mPRs in CAW-TNBC tissues, we utilized tumor tissue gene expression data (microarray) (Gyorffy et al., 2010), integrating gene expression and clinical data simultaneously to generate KM survival curves. First, breast cancer patients were filtered to only analyze TNBC subtypes. Our analysis revealed that decreased expression of CCM1/PAQR8 and increased expression of PGRMC2 had significantly worst prognostic effects [overall survival (OS)] in CAW-TNBCs (Table 2, column 6), reaffirming the essential role of the CSC and mPRs during TNBC tumorigenesis.
Interestingly, when we repeated our analysis utilizing TCGA through the Xena browser software, our new analysis instead identified that only increased expression of PAQR8 was associated with significantly worst OS in CAW-TNBCs (Table 2, column 7). Overall, these results further solidify the involvement of key members of the CmP signaling network during TNBC tumorigenesis and elucidate the great potential of the CmP signaling network for prognostic applications in CAW-TNBCs.
Dissecting the CmP network in CAW-derived TNBC cells using omics approaches
To dissect key players involved in the CmP signaling network, investigate key altered pathways affected in CAW-derived TNBC cells (MB231) under mPR-specific steroid actions, and identify potential biomarkers, we examined the expression patterns at both the transcriptional and translational levels using high-throughput RNAseq and LC-MS/MS omics approaches.
In our previous findings utilizing AAW-derived TNBC cells (MB468), we observed that expression levels of key factors in the CmP signaling network differed between CAW- and AAW-derived TNBC cells, in which mPRs were enhanced at both the transcriptional and translational levels in CAW-derived TNBC cells under mPR-specific steroid actions, while mPR expression was variable at both the transcriptional and translational levels in AAW-derived TNBC cells, suggesting multiple functions of the CmP signaling network for different TNBC subtypes (Abou-Fadel et al., 2021).
As a result of these previous findings, we filtered out our RNAseq and proteomics data for CAW-derived TNBC cells by removing similarly altered differentially expressed genes/proteins (DEGs/DEPs) shared between AAW- and CAW-derived TNBC cells to evaluate CAW-TNBC-specific DEGs/DEPs.
Key signaling cascades identified within the CmP network in CAW-derived TNBC cells using RNAseq
Using the identified DEGs (Supplementary Table S1), we performed hierarchical clustering to visualize changed gene expression between vehicle and mPR-specific steroid-treated CAW-derived TNBC cells (Fig. 3A). Further bioinformatics processing allowed us to visualize 200+ genes upregulated and 350+ genes downregulated, under mPR-specific steroid actions, yielding a great foundation of potential biomarkers for CAW-derived TNBC cells (Fig. 3B). These results also illustrated that, in general, combined steroid actions have a stronger repressive role in the expression of CAW-TNBC-specific DEGs (Fig. 3B).

DEGs among CAW-derived TNBC cells utilizing high-throughput RNA sequencing (RNAseq). Extracted significant DEGs, compared to vehicle controls, were further filtered using corresponding MB468 cells to obtain DEGs specific to CAW-derived TNBC cells.
Pathway functional enrichment performed with these DEGs revealed several major altered signaling biological processes, including overall downregulation of cellular and metabolic, developmental, immune system as well as reproductive processes in CAW-derived TNBC cells (Fig. 3C).
Analysis of molecular functions affected revealed that the majority of alterations occurring in CAW-derived TNBC cells, under mPR-specific steroid actions, are associated with an overall downregulation in binding, catalytic activity, as well as molecular function regulation pathways (Fig. 3D). Alteration of KEGG signaling pathways demonstrated that Wnt signaling was the major signaling pathway affected (Fig. 3E), which has major impacts on regulating development and stemness, and is involved in carcinogenesis in several major cancers, including gastrointestinal (Polakis, 2012; Christie et al., 2013), leukemia (Luis et al., 2012; Lento et al., 2013; Wang et al., 2014), melanoma (Miroliubov and Miroliubov, 1991; Pawlikowski et al., 2013; Juan et al., 2014; Webster et al., 2015), and all subtypes of breast cancer (Lin et al., 2000; Li et al., 2014).
In addition, Wnt signaling has been shown to affect the maintenance of cancer stem cells, metastasis, and immune control (Zhan et al., 2017). The other top signaling pathway altered in CAW-derived TNBC cells, under mPR-specific steroid actions, included inflammation mediated by chemokines and cytokines (Fig. 3E), which is known to contribute to tumor progression, in multiple cancers, specifically through mechanisms involved in migration, invasion, and metastasis (Coussens and Werb, 2002).
Alterations in the gonadotropin-releasing hormone (GnRH) signaling pathway (Fig. 3E) were also one of the top pathways affected, which is responsible for regulating mammalian reproduction, including production of hormones in both men and women (Perrett and McArdle, 2013). Several angiogenesis-related pathways, heterotrimeric G-protein, as well as integrin signaling pathways (Fig. 3E) were also among the top signaling pathways perturbed in CAW-derived TNBC cells. Overall, observations of altered key signaling cascades associated with tumorigenesis in CAW-derived TNBC cells, under mPR-specific steroid actions, including apoptosis, p53, Wnt, RAS, CCKR, inflammation, angiogenesis, PDGF, and hormone signaling pathways (Fig. 3E), validate crosstalk between the CSC and mPRs in the CmP signaling network involved during CAW-TNBC tumorigenesis.
Finally, to understand the classes of proteins primarily responsible for the observed alterations in key tumorigenesis signaling cascades, we performed further pathway functional enrichment, which demonstrated the top 5 altered classes of proteins included metabolite interconversion enzymes, protein-modifying enzymes, transporters, gene-specific transcriptional regulators, as well as nucleic acid metabolism proteins (Fig. 3F). Other classes of proteins contributing toward the observed altered pathways in CAW-derived TNBC cells included protein binding activity modulators, transmembrane signal receptors, cytoskeletal proteins, cell adhesion, immunity, and structural proteins (Fig. 3F).
Key signaling cascades within the CmP network in CAW-derived TNBC cells using LC-MS/MS approaches
Among the identified DEPs (Supplementary Table S2), we again performed hierarchical clustering to visualize changed protein expression between vehicle and mPR-specific steroid-treated CAW-derived TNBC cells (Fig. 4A). Further bioinformatics processing demonstrated 50+ proteins upregulated and 100+ proteins downregulated, under mPR-specific steroid actions (Fig. 4B). These results, in complementation to potential DEG biomarkers identified (Fig. 3B), provided us with an additional index of potential CAW-TNBC-specific DEP biomarkers to be further investigated. These results also illustrated that, in general, mPR-specific steroid actions also have a stronger repressive role in the expression of CAW-TNBC-specific DEPs (Fig. 4B). Protein functional enrichment demonstrated that several pathways overlaid with RNA enrichment, reinforcing that these pathways may play potential key roles in hormone signaling and factors in CAW-TNBCs (Figs. 3C-F and 4C-F).
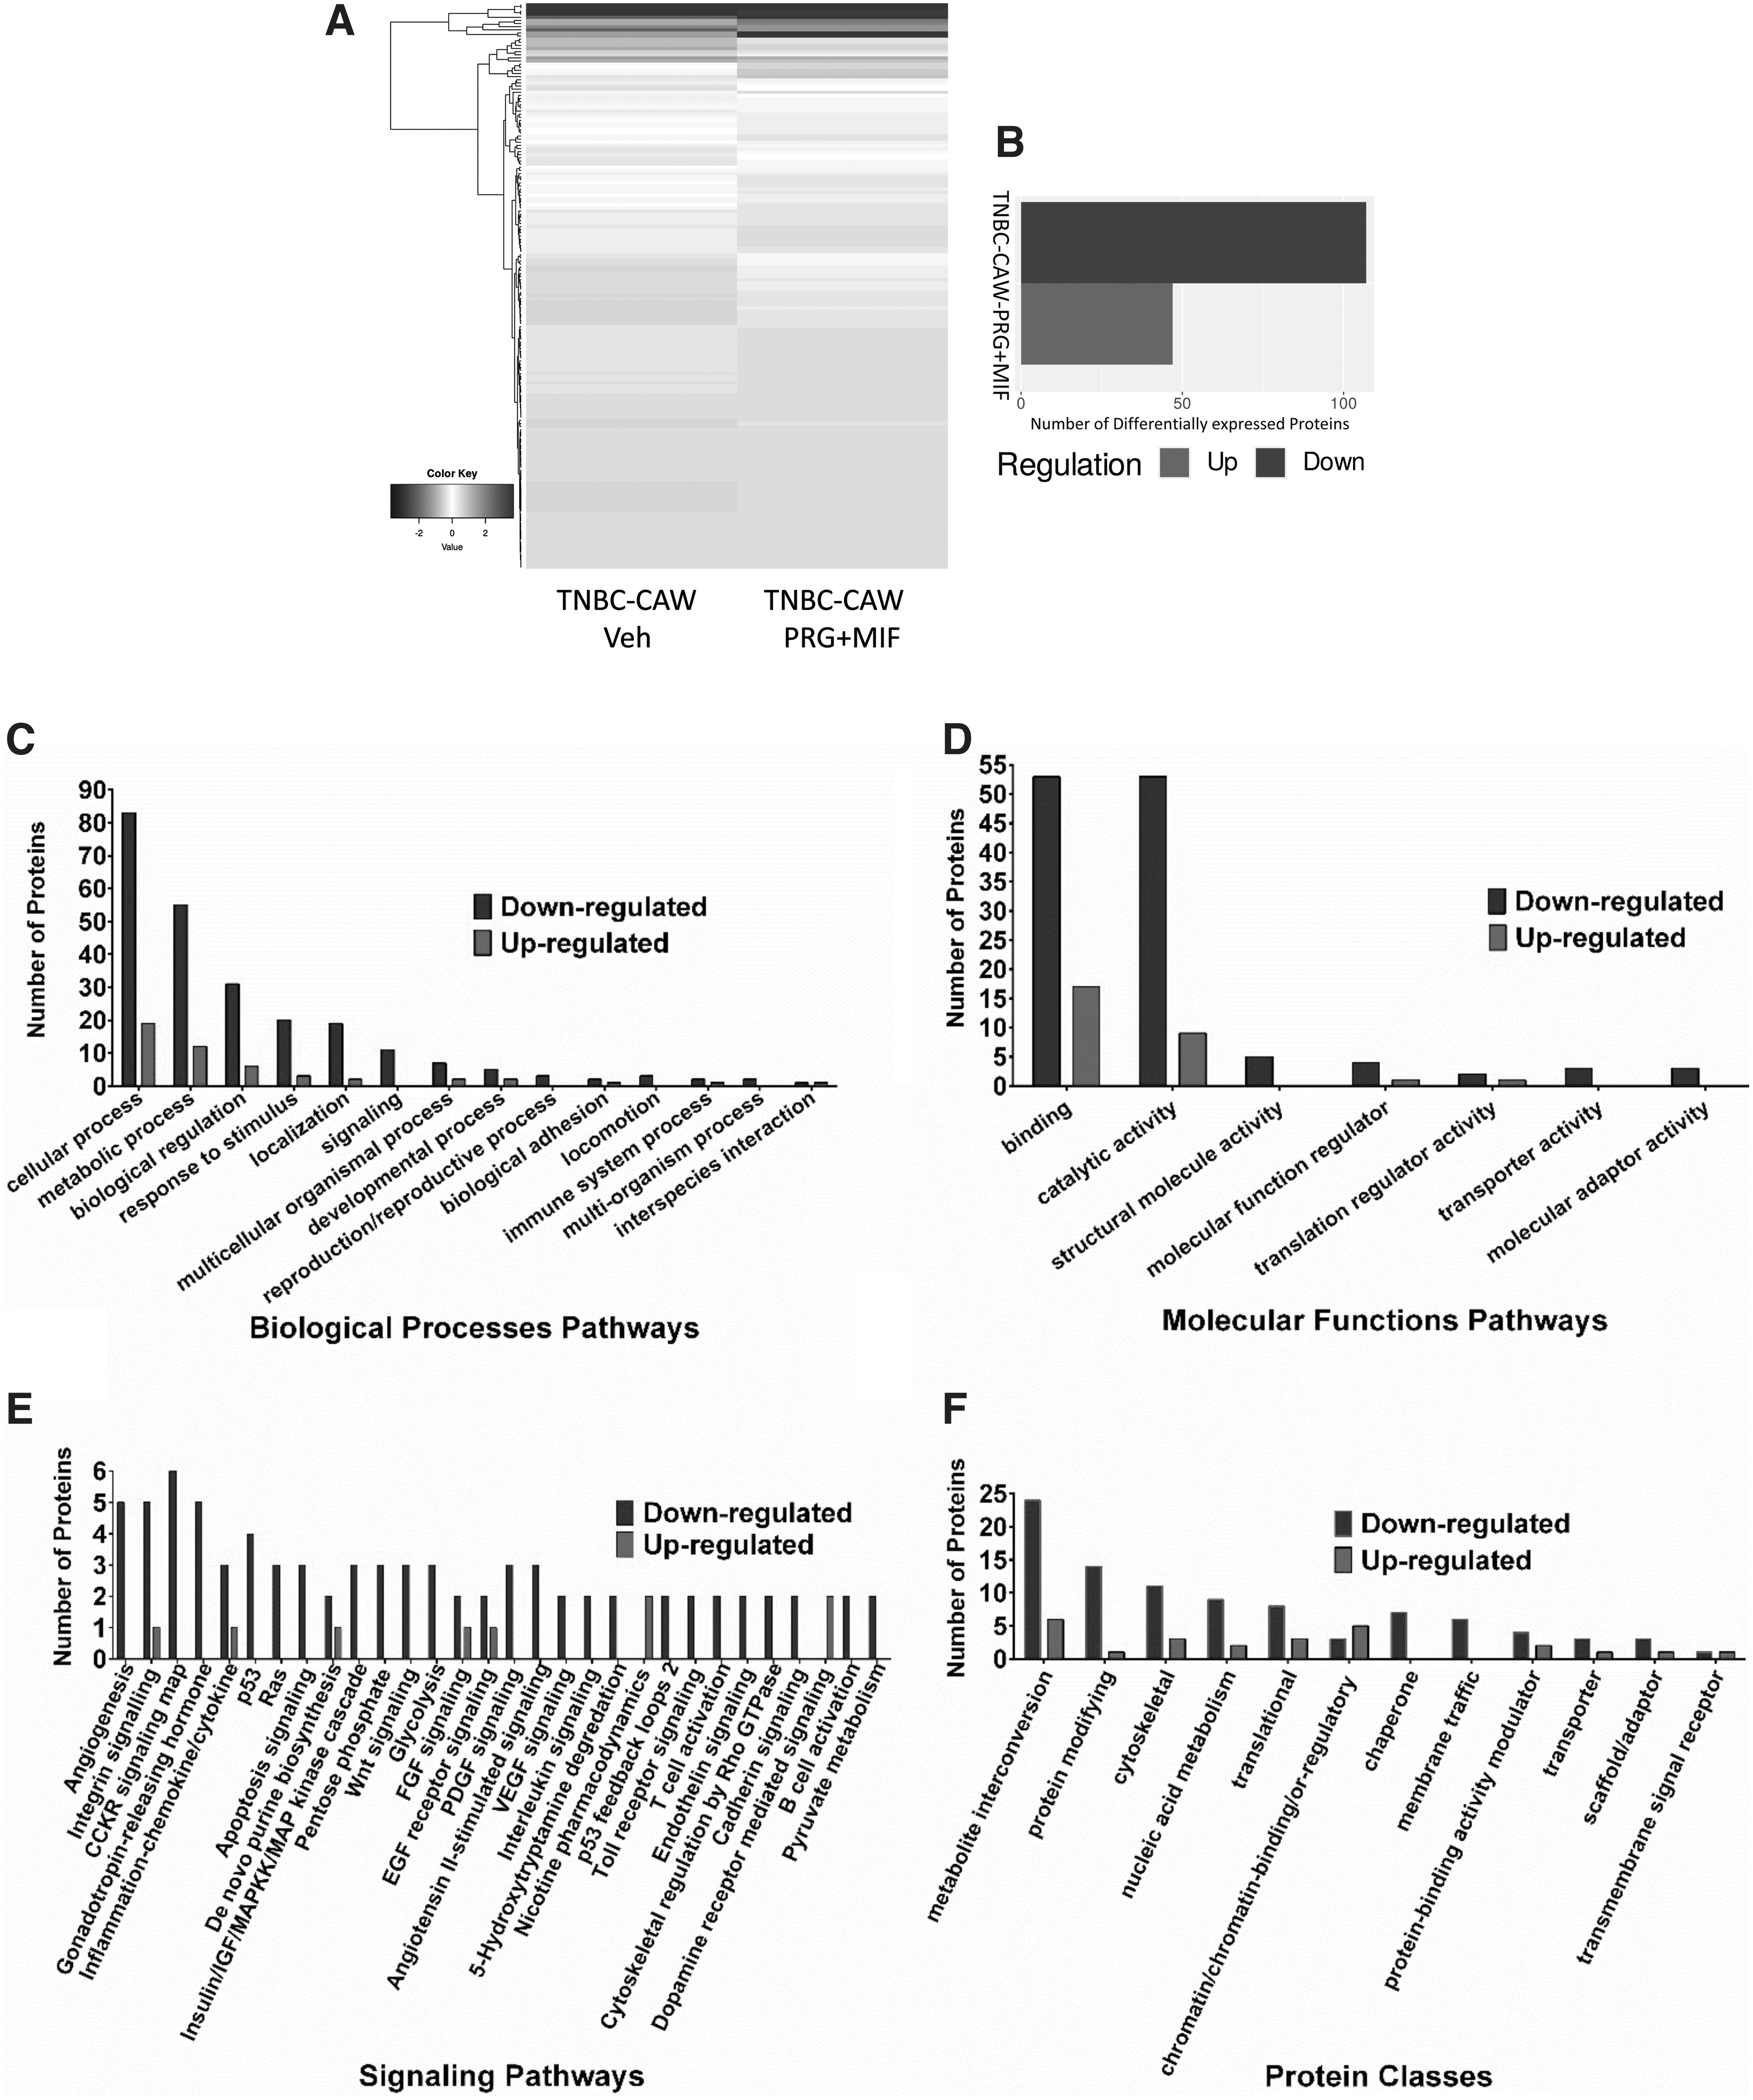
DEPs among CAW-derived TNBC cells utilizing high-throughput proteomics. Extracted significant DEPs, compared to vehicle controls, were further filtered using corresponding MB468 cells to obtain DEPs specific to CAW-derived TNBC cells.
Pathway functional enrichment performed with DEPs revealed all the same major altered signaling biological processes seen at the transcriptional level, including overall downregulation of cellular, metabolic, developmental, and immune system, as well as reproductive processes in CAW-derived TNBC cells (Fig. 4C).
Similarly, analysis of molecular functions also revealed that the majority of alterations, identical to the results obtained at the transcriptional level, is associated with an overall downregulation in binding, catalytic activity, and structural molecule activity, as well as molecular function regulation pathways (Fig. 4D). Surprisingly, Wnt was not the most impacted KEGG pathway at the translational level, as was seen at the transcriptional level, but instead downregulation of angiogenesis was the most impacted signaling pathway in mPR-specific steroid-treated CAW-derived TNBC cells (Fig. 4E), which was also in the top affected signaling pathways observed in our RNAseq data (Fig. 3E).
At the translational level, Wnt signaling was still in the top 15 pathways disrupted, reinforcing its definitive role in CAW-TNBC tumorigenesis. Synonymous with our transcriptomics data, the top signaling pathway altered in CAW-derived TNBC cells, under mPR-specific steroid actions, included inflammation mediated by chemokines and cytokines, GnRH, heterotrimeric G-protein, integrin, apoptosis, and p53, RAS, CCKR, and PDGF signaling pathways (Fig. 4E).
These results further reinforce the existence of crosstalk between the CSC and mPRs in the CmP signaling network involved during CAW-TNBC tumorigenesis, and further validate the involvement of the CmP network in CAW-TNBC progression. It must be noted that overall, the number of proteins identified for each pathway in our proteomics study is greatly decreased from the number of genes identified in our RNAseq analysis, which is not surprising, given the reduced sensitivity of proteomics compared to RNAseq; however, the identification of the same top affected signaling pathways validates the results seen at both levels independently.
Similar to our transcriptomics analysis, 3 of the top 5 altered classes of proteins included metabolite interconversion enzymes, protein-modifying enzymes, and nucleic acid metabolism proteins, with the other top two including cytoskeletal and translational proteins (Fig. 4F) in mPR-specific steroid-treated CAW-derived TNBC cells.
Together, these results solidify the existence of a cellular relationship between the CSC and mPR signaling, at both the transcriptional and translational levels, in CAW-derived TNBC cells under mPR-specific steroid actions. In addition to identifying key perturbed signaling pathways, our extensive omics analysis has also provided several new candidate biomarkers that can be further investigated to determine their potential clinical applications for CAW-TNBCs.
Key signaling cascades within the CmP network in CAW-derived TNBC cells identified using systems biology approaches
To evaluate the interrelationship between RNA and protein expression from CAW-derived TNBC cells, under mPR-specific steroid actions, we overlaid the regulation patterns and extrapolated the overlaps between the two datasets producing a list of 32 CAW-TNBC-specific potential biomarkers that were seen perturbed at both the transcriptional and translational levels (Fig. 5A and Supplementary Table S3). Overall, downregulation of biological processes, molecular functions, and protein classes affected with these overlapped DEGs/DEPs (Fig. 5B, C, E) were nearly identical to the individual analysis seen. Downregulation of 18 KEGG pathways were also very similar to the individual analysis performed with the RNAseq and proteomics data, however, the top affected signaling pathway using our reduced list of potential biomarkers now demonstrated P53 signaling at the top, followed by integrin, inflammation by chemokines and cytokines, Wnt, followed by apoptosis signaling, all of which were also seen at the individual levels (Fig. 5D).
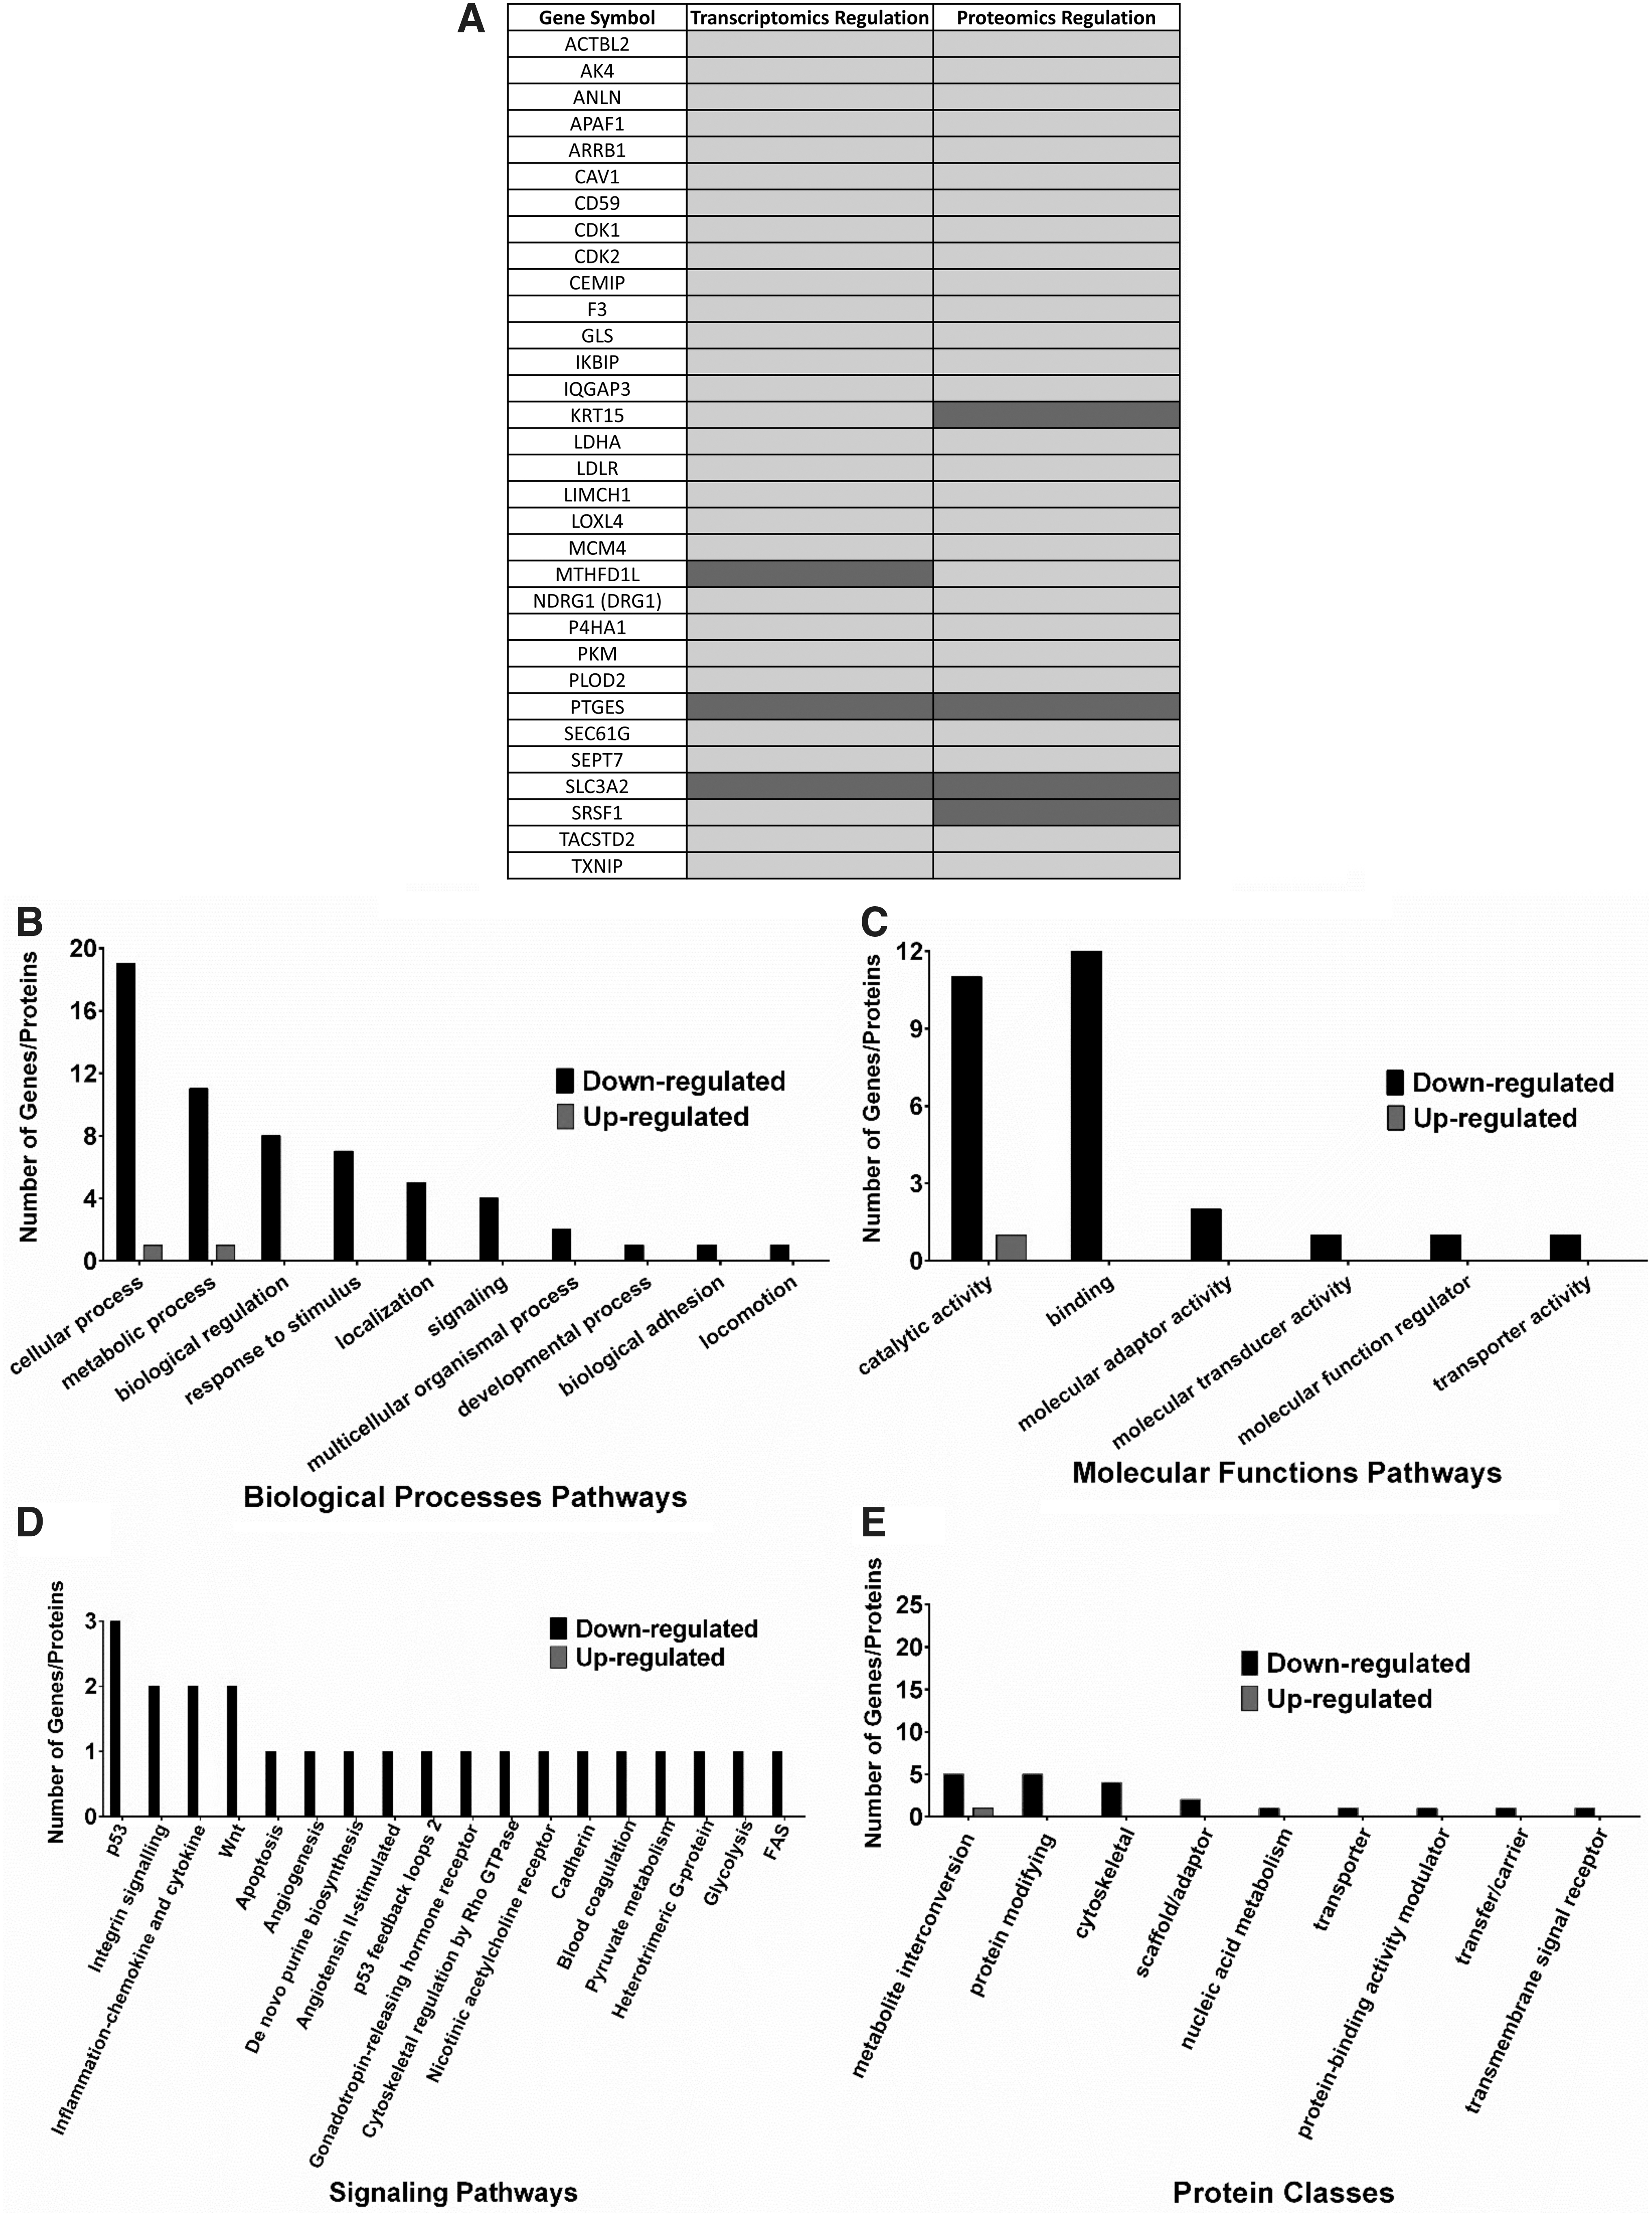
Overlapped DEGs/DEPs among CAW-derived TNBC cells utilizing high-throughput RNA sequencing (RNAseq) and proteomics. Overlapped extracted significant DEGs/DEPs, compared to vehicle controls, were further filtered using corresponding overlapped extracted significant DEGs/DEPs in MB468 cells to obtain 32 DEGs/DEPs specific to CAW-derived TNBC cells to serve as the potential list of candidate CAW-TNBC biomarkers.
Other consistently downregulated pathways also identified in the individual analysis included angiogenesis, GnRH signaling, as well as heterotrimeric G-protein pathways (Fig. 5D), further validate our independent observations at both the transcriptional and translational levels. To reduce the list of identified potential biomarkers, we reviewed expression patterns between DEGs/DEPs (Fig. 5A), and only genes/proteins with the same regulation trends (averaged log2 Fold Changes) seen at both the transcriptional and translational levels were further assessed (29 DEGs/DEPs). Genes/proteins displaying opposite expression at the transcriptional and translational levels (3 DEGs/DEPs) were excluded from further analysis as these reflected genes capable of undergoing potential feedback autoregulation in CAW-derived TNBC cells under mPR-specific steroid actions.
Differential expression of our candidate biomarkers and their associated prognostic effects
We next set out to filter out our 29 remaining candidate biomarkers for CAW-TNBCs from our multiomics analysis to evaluate their clinical relevance. To accomplish this, we analyzed publicly available microarray data (Gyorffy et al., 2010) for the remaining 29 candidate biomarkers to generate KM survival curves as previously performed. Breast cancer patient samples were filtered to only analyze patient samples classified as TNBC subtype. For the first group of biomarkers, a worst prognostic effect was illustrated in TNBC patients corresponding with our observed differential expression in CAW-derived TNBC cells under mPR-specific steroid actions (Fig. 5A) for SLC3A2, IKBIP, ARRB1, CD59, GLS, LDLR, MCM4, PTGES, and TXNIP (Supplementary Fig. S1A-C).
These results suggest that a disrupted CmP signaling network, under mPR-specific steroid actions, in CAW-derived TNBC cells could lead to worst prognostic outcomes.
Conversely, for the second group of biomarkers, a better prognostic effect was obtained in TNBC patients corresponding with our observed differential expression in CAW-derived TNBC cells, under mPR-specific steroid actions (Fig. 5A), for AK4, CAV1, F3, TACSTD2, LDHA, PLOD2, APAF1, CDK2, IQGAP3, DRG1 (NDRG1), P4HA1, and SEPT7 (Supplementary Fig. S1D-F). Together these results demonstrate the heterogeneity response of CAW-derived TNBC cells under mPR-specific steroid actions. For five biomarkers, we did not obtain significant clinical relevance with differential expression in TNBC patients (Supplementary Fig. S2), and three of our initially identified biomarkers did not have any data available to perform the analysis.
Utilizing our KM survival curve data (regardless of prognostic effect), we further assessed our biomarkers by only proceeding with biomarkers that had significant KM survival curves (21 biomarkers) in TNBC patients to assess their basal expression patterns in clinical samples.
Investigating differential expression of our candidate biomarkers in breast cancer tissues
With our remaining 21 clinically significant CAW-TNBC-specific candidate biomarkers, we next sought out to evaluate their differential expression among breast cancer subtypes. Utilizing publicly available breast cancer tumor tissue gene expression data (microarray) (Gyorffy et al., 2010), we explored differential expression patterns for our candidate biomarkers, associated with significant KM survival curves identified in this study, in nPR(±) breast cancer tissues (ER and HER2 receptor status not available). Expression data, from breast cancer tissue microarrays, were divided based on progesterone receptor status (nPR±). Twelve of our candidate biomarkers, AK4, APAF1, CD59, CDK2, LDHA, GLS, IQGAP3, PLOD2, NDRG1, SLC3A2, P4HA1, and TACSTD2, were found to be significantly upregulated in nPR(−) tumor tissues, compared to nPR(+) tumor tissues (Supplementary Fig. S3A-C).
Interestingly, we only observed the same upregulation for 1/12 biomarkers (SLC3A2) in CAW-derived TNBC cells under mPR-specific steroid actions (Fig. 5A), suggesting little effect of hormone actions on SLC3A2 expression.
The other 11 biomarkers, however, were downregulated in CAW-derived TNBC cells, under mPR-specific steroid actions (Fig. 5A), suggesting that disruption of the CmP signaling network has a huge influence in altering expression for these biomarkers at both the transcriptional and translational levels. Alternatively, four of our candidate biomarkers, ARRB1, F3, PTGES, and TXNIP were found to be significantly downregulated in nPR(−) compared to nPR(+) tumor tissues (Supplementary Fig. S3D). Interestingly, we observed opposing upregulation for 1/4 biomarkers (PTGES) in CAW-derived TNBC cells (Fig. 5A), under mPR-specific steroid actions, suggesting that disruption of the CmP signaling network has a huge influence in altering expression for this naturally underexpressed gene in nPR(−) tumor tissues.
The other three biomarkers (ARRB1, F3, and TXNIP) demonstrated similar downregulated patterns in our omics data (Fig. 5A), suggesting little effect of hormone actions on their expression levels. Furthermore, five biomarkers, CAV1, IKBIP, LDLR, MCM4, and SEPT7, were found to have similar expression patterns in nPR(±) tumor tissues (Supplementary Fig. S4). However, disruption of the CmP signaling network, under mPR-specific steroid actions in CAW-derived TNBC cells resulted in significant downregulation of all five biomarkers (Fig. 5A), suggesting that combined steroid actions induce decreased expression, at both the transcriptional and translational levels for these five biomarkers in CAW-derived TNBC cells.
We next sought to further our analysis to investigate differential expression patterns between AAW- and CAW-TNBCs utilizing publicly available RNA-seq data, comparing expression levels in 23 AAW- and 19 CAW-TNBC samples (Saleh et al., 2021) for our candidate biomarkers associated with significant KM curves identified in this study (Fig. 5A).
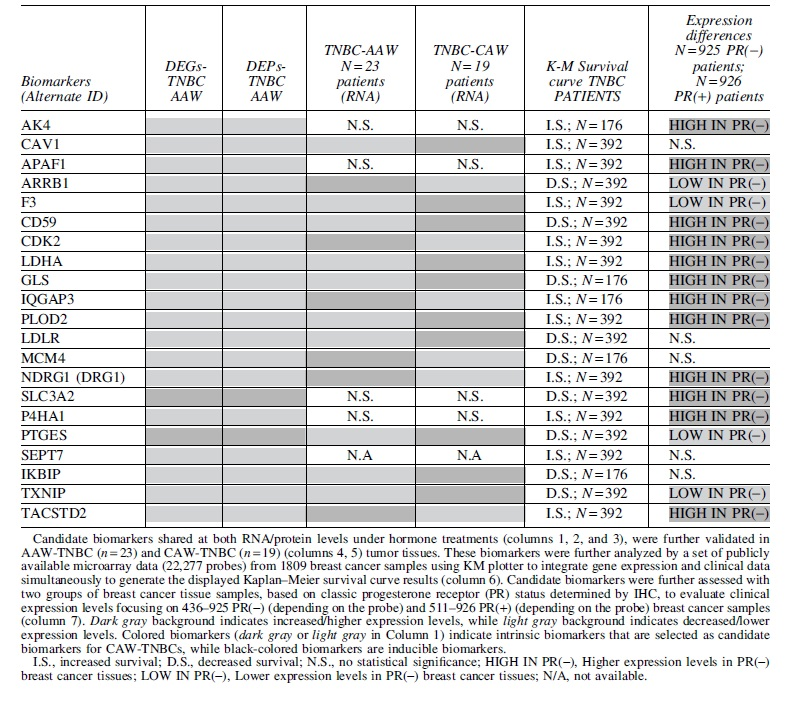
ARRB1, CDK2, IQGAP3, MCM4, NDRG1, and TACSTD2 displayed similar downregulated trends in CAW-derived TNBC cells (Fig. 6A, columns 1-3), under mPR-specific steroid actions, as was naturally observed in the CAW-TNBC patient samples (Fig. 6A, column 5 and Supplementary Fig. S3E), allowing us to define these genes/proteins as downregulated intrinsic biomarkers for CAW-TNBCs (Fig. 6A, blue-colored biomarkers, column 1). Two representative examples of KM survival curves (Fig. 6B) and differential expression patterns in CAW tissues (Fig. 6C) corresponding to our observed omics analysis (Fig. 5A) are illustrated for two intrinsic biomarkers.

Intrinsic biomarkers identified among CAW-derived TNBC cells utilizing high-throughput RNA sequencing (RNAseq) and proteomics. Overlapped synchronous DEGs/DEPs in CAW-derived TNBC cells identified as intrinsic biomarkers.
In addition, PTGES, which displayed similar upregulated trends in CAW-derived TNBC cells (Fig. 5A), under mPR-specific steroid actions, as was naturally observed in the CAW-TNBC patient samples (Fig. 6C and Supplementary Fig. S3F-panel viii), was the only upregulated intrinsic biomarker identified in our study (Fig. 6A, red-colored biomarker, column 1).
Alternatively, AK4, CAV1, APAF1, F3, CD59, LDHA, GLS, PLOD2, LDLR, SLC3A2, P4HA1, SEPT7, IKBIP, and TXNIP displayed either opposite or inducible trends in CAW-derived TNBC cells (Fig. 5A), under mPR-specific steroid actions, as was naturally observed in the CAW-TNBC patient samples, (Supplementary Fig. S3F all panels except panel viii, and Supplementary Fig. S5), allowing us to define these genes/proteins as inducible biomarkers (CmP perturbation) for CAW-TNBCs (Fig. 7A, black-colored biomarkers, column 1).

Inducible biomarkers identified among CAW-derived TNBC cells utilizing high-throughput RNA sequencing (RNAseq) and proteomics. Overlapped synchronous DEGs/DEPs in CAW-derived TNBC cells identified as inducible biomarkers.
Representative examples of KM survival curves (Fig. 7B) and differential expression patterns in CAW-TNBC tissues (Fig. 7C), corresponding to our observed omics analysis (Fig. 5A), are illustrated for 2/14 inducible biomarkers. Utilizing all expression and prognostic data, we were able to filter our initial 32 candidate biomarker hits (Fig. 5A and Supplementary Table S3) to a clinically relevant list of 21 intrinsic and inducible biomarkers for CAW-TNBCs (Table 3).
Summarized 21 Identified Prognostic Candidate Biomarkers Associated with Clinically Significant Data in Caucasian American Women Triple-Negative Breast Cancer
Differential expression of shared TNBC candidate biomarkers and their associated prognostic effects
To identify DEGs/DEPs shared between AAW- and CAW-derived TNBC cells, we overlapped omics data between the two datasets (unfiltered) to identify shared synchronous DEGs/DEPs to enhance our biomarker analysis. Interestingly, our analysis only resulted in two shared potential biomarkers between the two TNBC cell lines (Supplementary Fig. S6).
Our systems biology analysis revealed that PCNA is a potential intrinsic biomarker for TNBCs with a significant KM survival curve (Supplementary Fig. S6A); however, we did not obtain significant differential expression in either nPR(±) tissues (Supplementary Fig. S6B) or between AAW- and CAW-TNBCs (Supplementary Fig. S6C). Our second identified biomarker, SRSF2, appears to undergo potential feedback autoregulation in both AAW- and CAW-derived TNBC cells under mPR-specific steroid actions (Supplementary Fig. S6D), eliminating it as a potential biomarker in TNBCs.
Discussion
The existence of the PRG-mPR signaling cascade in nPR(±) cells has been well documented (Karteris et al., 2006; Dosiou et al., 2008; Sleiter et al., 2009; Zuo et al., 2010; Pang and Thomas, 2011), demonstrating that PRG signaling in nPR(−) cell lines is solely mediated through mPRs (PAQRs) (Zuo et al., 2010). In our previous study, we defined the novel CmP signaling network in AAW-derived TNBC cells (Abou-Fadel et al., 2021), which overlapped with our previously defined CmPn network in nPR(+) breast cancer cells (Abou-Fadel et al., 2020a), and observed that combined steroid actions have a positive effect on CSC protein expression in AAW-TNBCs (Abou-Fadel et al., 2021).
Using extensive multiomics approaches, we were once again able to demonstrate alterations to key tumorigenesis pathways, including cytokine-mediated responses, Wnt, integrin, GnRH, and angiogenesis signaling pathways, in CAW-derived TNBC cells under mPR-specific steroid actions. These results suggest that even though TNBC diagnoses in AAW are associated with more aggressive forms of the disease (Dignam, 2000; Newman, 2014; Newman and Kaljee, 2017), and experience a higher mortality rate (Baquet et al., 2008), TNBCs in CAW share similar altered signaling pathways, under mPR-specific steroid actions, demonstrating the aggressive nature of TNBCs regardless of racial differences.
Utilizing a similar multiomics approach, we identified 21 new CAW-TNBC-specific candidate biomarkers (Table 3) that will be further validated to evaluate their potential clinical applications for CAW-TNBCs utilizing patient-derived xenograft (PDX) mouse models. In addition, this project reinforces the definitive role of the CmP signaling network in TNBC tumorigenesis that was initially identified in our previous studies with AAW-TNBCs (Abou-Fadel et al., 2021). This new set of potential prognostic biomarkers for CAW diagnosed with TNBC may revolutionize molecular mechanisms and currently known concepts of tumorigenesis in CAW-TNBCs, leading to hopeful new therapeutic strategies.
Potential prognostic biomarkers for CAW-TNBCs
Biomarkers, identified through cutting-edge biomedical technologies (such as genetics, epigenetics, genomics, proteomics, etc.), are prognostic tools that can be used to predict patient response to therapy and future course of the disease (Schmidt et al., 2012), and have been widely used in breast cancer therapies to offer precise treatment based on tumor characteristics (Fasching et al., 2015).
As mentioned previously, TNBC patients have limited options for treatment since most immunotherapies target ER, nPR, and HER2 receptors, which are ineffective for TNBCs (Zhu et al., 2021). TNBCs, among all other breast cancer subtypes, have the most limited number of therapeutic strategies available, demonstrate limited responses to currently available treatments, and have the worst prognosis (Chacon and Costanzo, 2010; Costa and Gradishar, 2017; Sekine et al., 2020; Zhu et al., 2021). Therefore, the identification of new biomarkers for TNBC subtypes is of the utmost importance in guiding treatment decisions and predicting prognosis in the future for precision-based cancer therapies (Krop et al., 2017a, 2017b; Colomer et al., 2018; Vieira and Schmitt, 2018; Andre et al., 2019; Liang et al., 2019; Wu and Chu, 2021).
Utilizing our expertise in multiomics analysis, we utilized CAW-derived TNBC cells to discover a total of 29 potential biomarkers synchronously regulated at the transcriptional and translational levels, associated with tumorigenesis in CAW-derived TNBC cells (Fig. 5A). Furthermore, using systems biology methods, we utilized publicly available clinical data (expression and prognosis), to filter the 29 biomarkers identified in vitro using CAW-derived TNBC cells under mPR-specific steroid actions, down to 21 clinically relevant CAW-TNBC specific biomarkers demonstrating differential expression associated with significant survival curves (Table 3).
This analysis resulted in the identification of 7 intrinsic and 14 inducible biomarkers for CAW-TNBCs (Table 3). Despite previous reports of DEGs/DEPs between TNBC basal subtypes (Neve et al., 2006; Lehmann et al., 2011; Toft and Cryns, 2011; Dai et al., 2017), our results demonstrated that disruption of the CmP signaling network, through mPR-specific steroid actions in CAW-derived TNBC cells, induces differential expression patterns of key players in the CmP network, as well as disrupts key tumorigenesis signaling pathways (Figs. 3-5). Furthermore, our findings do not overlap with any previous publications and are unrelated to the reported DEGs/DEPs in TNBC subtypes, yielding our newly identified biomarkers as great candidates for CAW-TNBC clinical applications (Table 3).
Pathways functional enrichment analysis using DEGs/DEPs demonstrates perturbation in key tumorigenic signaling cascades
Pathways functional enrichment results obtained from significantly altered genes/proteins in CAW-derived TNBC cells, under mPR-specific steroid actions, demonstrated perturbation in key signaling cascades known to participate in tumorigenesis and cancer progression. One of the main altered pathways, seen at both the transcriptional and translational levels, included inflammation by chemokines and cytokines. These proteins are known to have a vast range of functionalities, including preventing apoptosis, thereby inducing proliferation of cancer cells (Esquivel-Velazquez et al., 2015) and contributing to induction/metastasis as well as homeostatic regulation of breast cancer (Klopocki et al., 2004). In addition, they are also suspected to modulate tumor growth by stimulating angiogenic factors in tumor cells (Balkwill, 2004).
Another key signaling pathway affected in CAW-derived TNBC cells, under mPR-specific steroid actions, included Wnt, which has been shown to affect the maintenance of cancer stem cells, metastasis, and immune control, and is responsible for signal transduction through cell surface receptors (Zhan et al., 2017). Wnt, classified as a proto-oncogene, can induce uncontrolled cell division (Freese et al., 2010) and has been associated with various cancers, including lung (Anastas and Moon, 2013), prostate (Zimmerli et al., 2017), gastrointestinal (Polakis, 2012; Christie et al., 2013), leukemia (Luis et al., 2012; Lento et al., 2013; Wang et al., 2014), melanoma (Miroliubov and Miroliubov, 1991; Pawlikowski et al., 2013; Juan et al., 2014; Webster et al., 2015), and all subtypes of breast cancer (Lin et al., 2000; Li et al., 2014).
Altered integrin signaling was also observed in our multiomics analysis in CAW-derived TNBC cells, under mPR-specific steroid actions, and has been shown to aid in cell proliferation, adhesion, growth, division, and apoptosis, and is suspected to induce angiogenesis, another major altered pathway in our functional enrichment analysis, through activation of MAPKs (Chow and Luster, 2014). Furthermore, regulation of integrins, along with IGF-IR in mitogenesis, has been shown to contribute toward prostate cancer development (Bergh et al., 2005).
Modulation of the GnRH pathway, another major pathway affected in our enrichment analysis with CAW-derived TNBC cells, under mPR-specific steroid actions, is responsible for regulating mammalian reproduction, including production of hormones in both men and women (Perrett and McArdle, 2013), and is known to contribute toward endometrium, prostate, and breast cancer progression (Schally, 1999).
Interestingly, integrins and GnRH are known to mediate one another in ovarian cancer progression (Goel et al., 2005). These observations further validate the possible existence of crosstalk between the CSC and mPRs, in the CmP signaling network involved in tumorigenesis pathways, and further validate the involvement of the CmP network in CAW-TNBC progression observed in this study.
Intrinsic and inducible CAW-TNBC biomarkers have known roles in cancer progression
Identification of novel CAW-TNBC biomarkers with clinical relevance is of great importance, especially due to limited treatment options (Zhu et al., 2021). During our studies, we found an overwhelming amount of literature support, demonstrating that many of our identified biomarkers had confirmed roles in signaling pathways toward cancer progression, validating their potential as prognostic biomarkers in CAW-TNBCs. AK4, observed to be downregulated in our studies, is involved in the progression of serous ovarian cancer (Huang et al., 2020), and AK4 depletion was shown to impair cell proliferation and invasion in MCF7 as well as MB231 breast cancer cells (Zhang et al., 2019).
CAV1, a tumor suppressor gene candidate, is a negative regulator of the Ras-p42/44 mitogen-activated kinase cascade (Engelman et al., 1999), and has been shown to play a critical role in the progression of breast cancer through autophagy, invasion, proliferation, apoptosis, migration, and breast cancer metastasis (Qian et al., 2019). Differential expression of CAV1 has also been observed under disrupted CSC conditions in endothelial cells (Abou-Fadel and Zhang, 2020; Abou-Fadel et al., 2020b). Furthermore, CAV1 has demonstrated involvement in radiotherapy and chemotherapy resistance, which are key issues encountered in breast cancer treatment, and stromal CAV1 has been proposed as a potential indicator for breast cancer prognosis (Qian et al., 2019).
APAF1, suppressed in our studies, is mutated in human melanomas, and its depletion has been shown to contribute toward malignant transformations in cancerous mouse models (Cecconi and Gruss, 2001). Overexpression of ARRB1, identified here as an intrinsic downregulated biomarker, reduced TNBC cell migration and growth, and expression levels have been reported to inversely correlate with histological grade and positively associate with patient survival, suggesting a tumor-suppressive role for ARRB1 in TNBCs (Son et al., 2019). F3 has been shown to increase tumor growth through enhancing integrin β1 signaling and contributes to metastasis through thrombin mechanisms that protect tumor cells from natural killer cells (Hisada and Mackman, 2019).
CD59 overexpression promotes proliferation of MCF-7 breast cancer cells, while simultaneously decreasing Bcl-2 expression, which is a strategy used by tumor cells to evade complement-dependent cell cytotoxicity stimulated by monoclonal antibodies (Ziller et al., 2005; Li et al., 2011). Interestingly, CDK2 has been shown to activate poly-(ADP)-ribose polymerase 1, which is required for hormonal gene regulation in breast cancer cells, and the connecting signaling pathway involved with this process has been proposed as a novel pathway for pharmacological management of breast cancer (Wright et al., 2012).
LDHA, downregulated in our studies, is normally overexpressed in TNBCs, and expression of LDHA was significantly correlated with TNM staging, distant metastasis, and survival outcomes; its expression levels along with AMPK have been proposed as prognostic biomarkers in breast cancer (Huang et al., 2016). GLS is involved in both breast and colorectal cancer progression through its ability to deregulate glutaminolysis (Huang et al., 2014; Masisi et al., 2020).
IQGAP3, proposed as a novel diagnostic/prognostic marker and therapeutic target for both pancreatic and serous ovarian cancer, is suspected to act as an oncogene by regulating Cdc42 expression in pancreatic cancer (Xu et al., 2016) and was shown to promote cancer proliferation and metastasis in high-grade serous ovarian cancer (Dongol et al., 2020).
PLOD2, contributing toward drug resistance in laryngeal cancer (Sheng et al., 2019) as well as regulating peritoneal dissemination in gastric cancer (Kiyozumi et al., 2018), has also been shown to be critical for fibrillary collagen formation in breast cancer cells, contributing to tumor stiffness, and the main mechanism for metastasis to the lungs and lymph nodes (Gilkes et al., 2013). MCM4 expression has been associated with the pathological staging of esophageal cancer (Huang et al., 2005) and has also been shown to play an essential role in the proliferation of non-small cell lung cancer (Kikuchi et al., 2011).
NDRG1 and its interaction with Cap43 have been shown to predict tumor angiogenesis and have been proposed as a poor prognosis marker in non-small cell lung cancer using in-vivo animal models (Azuma et al., 2012). Furthermore, NDRG1 expression has been associated with breast atypia-to-carcinoma progression and is suspected to participate in the carcinogenesis and progression of invasive breast cancer, identifying this gene as an important biomarker for invasive breast cancers (Mao et al., 2011).
SLC3A2 was shown to play a role in aggressive breast cancer subtypes driven by c-MYC and has been proposed as a potential poor prognostic marker for highly proliferative breast cancer subtypes (El Ansari et al., 2018). P4HA1 expression has recently been shown to induce HIF-1α expression in TNBCs, revealing a novel HIF-1 regulation mechanism in TNBCs, and P4HA1 was also shown to promote chemoresistance by modulating HIF-1-dependent cancer cell stemness (Xiong et al., 2018; Xu, 2019). Cytoskeletal proteins, SEPT7 along with SEPT2, which have been evolutionarily conserved from yeast to mammals, when silenced in CAW-derived TNBC, cells demonstrated inhibitory effects in cellular proliferation, apoptosis, migration, and invasion.
These results strongly suggest that SEPT7 is involved in breast carcinogenesis and can serve as therapeutic targets for highly invasive breast cancers (Zhang et al., 2016). IKBIP, a gene not commonly reported in cancer data, was recently shown to be highly involved in EMT and was associated with more aggressive phenotypes in gliomas (Yang et al., 2021). Finally, downregulation of TXNIP, demonstrated in breast, bladder, and gastric cancer, was recently shown to be a common feature in human tumor xenograft models in which intratumoral leukocytes are responsible for the decreased expression of TXNIP, suggesting that TXNIP expression levels can be used to monitor the functional state of tumor-infiltrating leukocytes (Schröder et al., 2020).
Interestingly, it needs to be emphasized that several of our identified biomarkers in this study, including the aforementioned CAV1, overlap with previously identified DEGs/DEPs in several endothelial cell lines with disruption of the CSC (Abou-Fadel and Zhang, 2020; Abou-Fadel et al., 2020b) or under mPR-specific steroid actions (Abou-Fadel et al., 2020b), confirming the importance of the CmP network across multiple cell lines/tissues. Together, these findings provide possible mechanisms by which all our identified intrinsic and inducible biomarkers in CAW-derived TNBC cells, under mPR-specific steroid actions, could be acting on to perturb the tumorigenesis/angiogenesis signaling pathways observed in our multiomics analysis.
Further validation of the CmP signaling network in cancer
PRG-mediated signaling has been shown to play a critical role in the progression of ovarian, as well as breast cancer (Lange and Yee, 2008; Hennessy et al., 2009), and its ability to regulate specific functions in nPR(−) breast cancers implicates mPRs in breast cancer progression and initiation (Zuo et al., 2010; Xie et al., 2012).
Accumulating evidence over the years demonstrating the role of mPRs in reproductive tumor biology has grown exponentially as overexpression of mPRs has been associated with the development and progression of cervical and ovarian cancer (Romero-Sanchez et al., 2008; Thomas, 2008; Charles et al., 2010) as well as breast cancers (Dressing and Thomas, 2007; Dressing et al., 2012). Furthermore, mPRs are widely expressed in all breast cancer cell lines and biopsies (Dressing and Thomas, 2007; Zuo et al., 2010; Pang and Thomas, 2011; Dressing et al., 2012; Xie et al., 2012).
Our previous studies investigating the role of mPRs in the CmP signaling network in AAW-TNBC progression also provide additional support for these findings in which we observed expression levels of mPRs were altered at both the transcriptional and translational levels in AAW-derived TNBC cells under mPR-specific steroid actions, and that mPRs were localized within the nucleus and could participate in nucleocytoplasmic shuttling (Abou-Fadel et al., 2021).
In this study, we observed differential gene/protein expression of inducible biomarker CAV1, which is known to co-localize at caveolae with mPRα and epidermal growth factor receptor (EGFR), and interestingly, PRG has been shown to induce repression of EMT through caveola bound signaling complexes (Dressing and Thomas, 2007; Thomas, 2008). Furthermore, mPRα has been shown to function as an essential mediator for PRG-induced inhibition on cell invasion and migration in basal phenotype breast cancer cells (Xie et al., 2015). Together these results reinforce the overwhelming evidence of the involvement of the CmP signaling network during TNBC progression in both CAW and AAW (Abou-Fadel et al., 2021).
Conclusion
In our previous study, we defined the novel CmP signaling network in AAW-derived TNBC cells (Abou-Fadel et al., 2021), which overlapped with our earlier defined CmPn network in nPR(+) luminal-A breast cancer cells (Abou-Fadel et al., 2020a), and observed that mPR-specific steroid actions have a positive effect on CSC protein expression in TNBCs with inducible patterns of expression in AAW-derived TNBC cells (Abou-Fadel et al., 2021). In this study, we were once again able to demonstrate alterations to key tumorigenic pathways in CAW-derived TNBC cells, under mPR-specific steroid actions, similar to our observations in AAW-TNBC cells under identical conditions (Abou-Fadel et al., 2021).
These results suggest that even though TNBC diagnoses in AAW are associated with more aggressive forms of the disease (Dignam, 2000; Newman, 2014; Newman and Kaljee, 2017), and experience a higher mortality rate (Baquet et al., 2008), TNBC in CAW shares similar altered signaling pathways, under mPR-specific steroid actions, demonstrating the aggressive nature of TNBCs regardless of racial differences. Utilizing expression and prognostic data, we were able to identify 21 clinically relevant intrinsic and inducible biomarkers for CAW-TNBCs (Table 3). This new set of potential prognostic biomarkers may revolutionize molecular mechanisms and currently known concepts of tumorigenesis and cancer management in CAW-TNBCs, leading to hopeful new therapeutic strategies.
Footnotes
Acknowledgments
We wish to thank Victoria Reid, Chantal Alvarado, Yanchun Qu, Shen Sheng, Ahmed Badr, Junli Zhang, Amna Siddiqui, Pallavi Dubey, Saafan Malik, and Edna Lopez at Texas Tech University Health Science Center El Paso (TTUHSCEP) for their technical help during the experiments.
Authors' Contribution
J.Z.: conceptualization and writing- reviewing and editing; J.A.F.: investigation, methodology, software, data curation, validation, writing- original draft preparation, and writing- reviewing and editing, M.B.: software, data curation, validation, and writing- reviewing and editing, B.G.: software, data curation, and validation.
Author Disclosure Statement
No competing financial interests exist.
Funding Information
1R21NS061191 (NINDS/NIH) and the Coldwell foundation (J.Z.).

References
Supplementary Material
Please find the following supplemental material available below.
For Open Access articles published under a Creative Commons License, all supplemental material carries the same license as the article it is associated with.
For non-Open Access articles published, all supplemental material carries a non-exclusive license, and permission requests for re-use of supplemental material or any part of supplemental material shall be sent directly to the copyright owner as specified in the copyright notice associated with the article.
