




Abstract
Objective:
This study was designed to evaluate the association between macrophage migration inhibitory factor (MIF) gene polymorphisms, serum MIF levels and tuberculosis (TB) susceptibility.
Methods:
All satisfactory studies were included; the MIF genotype number and serum MIF levels were reviewed. The Stata and Review Manager software were used for the pooled analyses.
Results:
The pooled analyses showed that the MIF-173G/C gene polymorphism was associated with TB (allele C vs allele G: odds ratio (OR) = 1.44, 95% confidence interval (CI): 1.28-1.62, p < 0.01; genotype CC vs genotype GG: OR = 1.69, 95% CI: 1.05-2.73, p = 0.03; genotype CC+GC vs genotype GG: OR = 1.56, 95% CI: 1.34-1.81, p < 0.01; genotype GC vs genotype GG: OR = 1.50, 95% CI: 1.28-1.75, p < 0.01). The subgroup analysis showed that the MIF-173G/C gene polymorphism was significantly associated with the risk of both pulmonary tuberculosis (PTB) and spinal tuberculosis (STB).The MIF CATT-794 gene polymorphism was associated with the PTB susceptibility in Asian subjects (genotypes 5/X+6/X vs genotypes 7/X+8/X: OR = 0.39, 95% CI: 0.24-0.64, p < 0.01; genotypes 5 + 6 vs genotypes 7 + 8: OR = 0.57, 95% CI: 0.48-0.69, p < 0.01). Both PTB and STB patients had significantly elevated serum MIF levels compared to healthy controls.
Conclusion:
The MIF-173G/C gene polymorphism is related to both PTB and STB susceptibility in both Asian and Caucasian populations. The C allele and CC genotype of the MIF-173G/C SNP appear to be TB risk factors. The MIF CATT-794 gene polymorphism is associated with the PTB susceptibility in Asian subjects; serum MIF levels were significantly increased in PTB and STB patients.
Introduction
Bacillus Mycobacterium tuberculosis (TB) can induce a chronic fatal infectious disease. TB contributes to considerable morbidity and mortality globally. According to the World Health Organization, an estimated number of new TB infections reached 10 million in 2017 (Furin et al., 2019). Unfortunately, the detailed pathogenesis of TB is still not fully understood. Many previous studies have demonstrated that several factors are associated with TB infection, including diabetes, human immunodeficiency virus (HIV) infection, and immunosuppressive agents (Narasimhan et al., 2013). Hence, an intensive study on TB pathogenesis is urgently needed.
Genetic susceptibility genes are also critical factors in the TB onset discovered in recent years. In addition, some single gene polymorphisms (e.g., Toll-like receptor 2) can affect TB susceptibility (Ben-Ali et al., 2004). Macrophage migration inhibitory factors (MIFs) were first identified 50 years ago. Activated T lymphocytes produce this soluble factor. Previous studies have shown that MIFs are associated with macrophage activation and negative glucocorticoid regulation. Recent research has reported that MIFs might be vital in TB pathogenesis. The human MIF gene is located on chromosome 22q11.2. Single nucleotide polymorphisms (SNPs) at the nucleotide position −173 (G to C) and the microsatellite polymorphism −794 CATT5-8 are the two most common MIF gene polymorphism markers (Ma et al., 2018).
It was reported that these two MIF polymorphisms are closely related to the TB susceptibility. Previous pooled analyses regarding this topic have been completed. However, these pooled analyses only included five studies (Naderi et al., 2017; Ma et al., 2018), a shortcoming may have affected the accuracy of their conclusions. More studies were included in this meta-analysis to obtain a more accurate research conclusion and explore the potential impact of MIF gene polymorphisms on TB susceptibility. Furthermore, the association between serum MIF level and TB susceptibility was also evaluated.
Materials and Methods
Search strategy
We carefully searched for all eligible trials from multiple databases (e.g., PubMed, Web of Science, EMBASE, and the China National Knowledge Infrastructure Database). Various search terms were used, such as MIF, MIF-173G/C, rs755622, MIF CATT-794, rs5844572, TB, pulmonary tuberculosis (PTB), spinal tuberculosis (STB), gene, and gene polymorphism.
Inclusion criteria
The inclusion criteria for this study were defined as follows:
Included two comparison groups (TB patients vs. control group). Reported the relationship between the MIF-173G/C or CATT-794 gene polymorphisms and TB susceptibility. Serum MIF levels in TB patients and the control group were reported. A detailed number of MIF-173G/C or CATT-794 genotypes was provided. The Hardy-Weinberg equilibrium (HWE) test in the control group met the requirements.
Data analysis
We used Stata software (version 12.0) to explore the association between the MIF-173G/C or CATT-794 gene polymorphisms and TB susceptibility and Review Manager software (version 5.2) to examine the relationship between serum MIF and TB. The odds ratio (OR) and 95% confidence interval (CI) were calculated. The standard mean difference (SMD) was calculated for serum MIF data that used different units. Four different genetic models were used when exploring the impact of the MIF-173G/C gene polymorphism on TB risk: Model 1, allele C versus allele G; Model 2, genotype CC versus genotype GG; Model 3, genotype CC+GC versus genotype GG; and Model 4, genotype GC versus genotype GG.
The impact of the MIF CATT-794 gene polymorphism on TB risk was analyzed using two genetic models: Model 1, 5/X genotype +6/X genotype versus 7/X genotype +8/X genotype and Model 2, 5 allele +6 allele versus 7 allele +8 allele. In addition, we performed Begg's test and I2 statistics to evaluate the publication biases and heterogeneity. A p-value <0.05 was considered statistically significant.
Ethics committee
The experiments were carried out according to the Ethics Review Committee of The Second People's Hospital of Hunan Province.
Results
Study characteristics
We included 20 studies after carefully searching various databases (Gómez et al., 2007; Deng et al., 2010; Sadki et al., 2010; Li et al., 2012a, 2012b; Zhao and Wang, 2012; Shi, 2013; Li, 2014; Hashemi et al., 2015; Kuai et al., 2016; Liu et al., 2016, 2018; Wang, 2017, Wang et al., 2021; Gao, 2019; Reid et al., 2019; Gehlen et al., 2020; Wang et al., 2020; Machado et al., 2021; Xu et al., 2021). Appendix Table A1 describes the principal characteristics of all the included trials. In total, 2959 TB patients and 2562 controls (5521 participants) with an average age of 18 to 78 years were included.
Appendix Table A2 summarizes the characteristics of 11 studies that reported on the association between serum MIF and TB susceptibility. Appendix Tables A3 and A4give the number of various extracted genotypes. Three studies were excluded from this pooled analysis (Li et al., 2012a; Shi, 2013; Kuai et al., 2016) based on their HWE test results.
The correlation between MIF-173G/C gene polymorphism and TB susceptibility
The following studies reported the impact of the MIF-173G/C gene polymorphism on TB susceptibility (Gómez et al., 2007; Deng et al., 2010; Sadki et al., 2010; Li, 2014; Hashemi et al., 2015; Liu et al., 2016; Wang, 2017; Gehlen et al., 2020; Wang et al., 2020). Our study showed that the MIF-173G/C gene polymorphism was associated with TB susceptibility in the overall patients (allele C vs. allele G: OR = 1.44, 95% CI: 1.28-1.62, p < 0.01, Fig. 1; genotype CC vs. genotype GG: OR = 1.69, 95% CI: 1.05-2.73, p = 0.03, Fig. 2; genotype CC+GC vs. genotype GG: OR = 1.56, 95% CI: 1.34-1.81, p < 0.01, Fig. 3; genotype GC vs. genotype GG: OR = 1.50, 95% CI: 1.28-1.75, p < 0.01, Fig. 4) (Table 1).

Forest plot of the MIF-173 gene polymorphism linked to TB susceptibility (C allele vs. G allele). The pooled analysis indicated that the MIF-173 gene locus C allele was a PTB and STB risk factor. MIF, macrophage migration inhibitory factor; PTB, pulmonary tuberculosis; STB, spinal tuberculosis; TB, tuberculosis.

Forest plot of the MIF-173 gene polymorphism linked to TB susceptibility (genotype CC vs. genotype GG). The pooled analysis indicated that the MIF-173 gene locus CC genotype was a PTB risk factor.
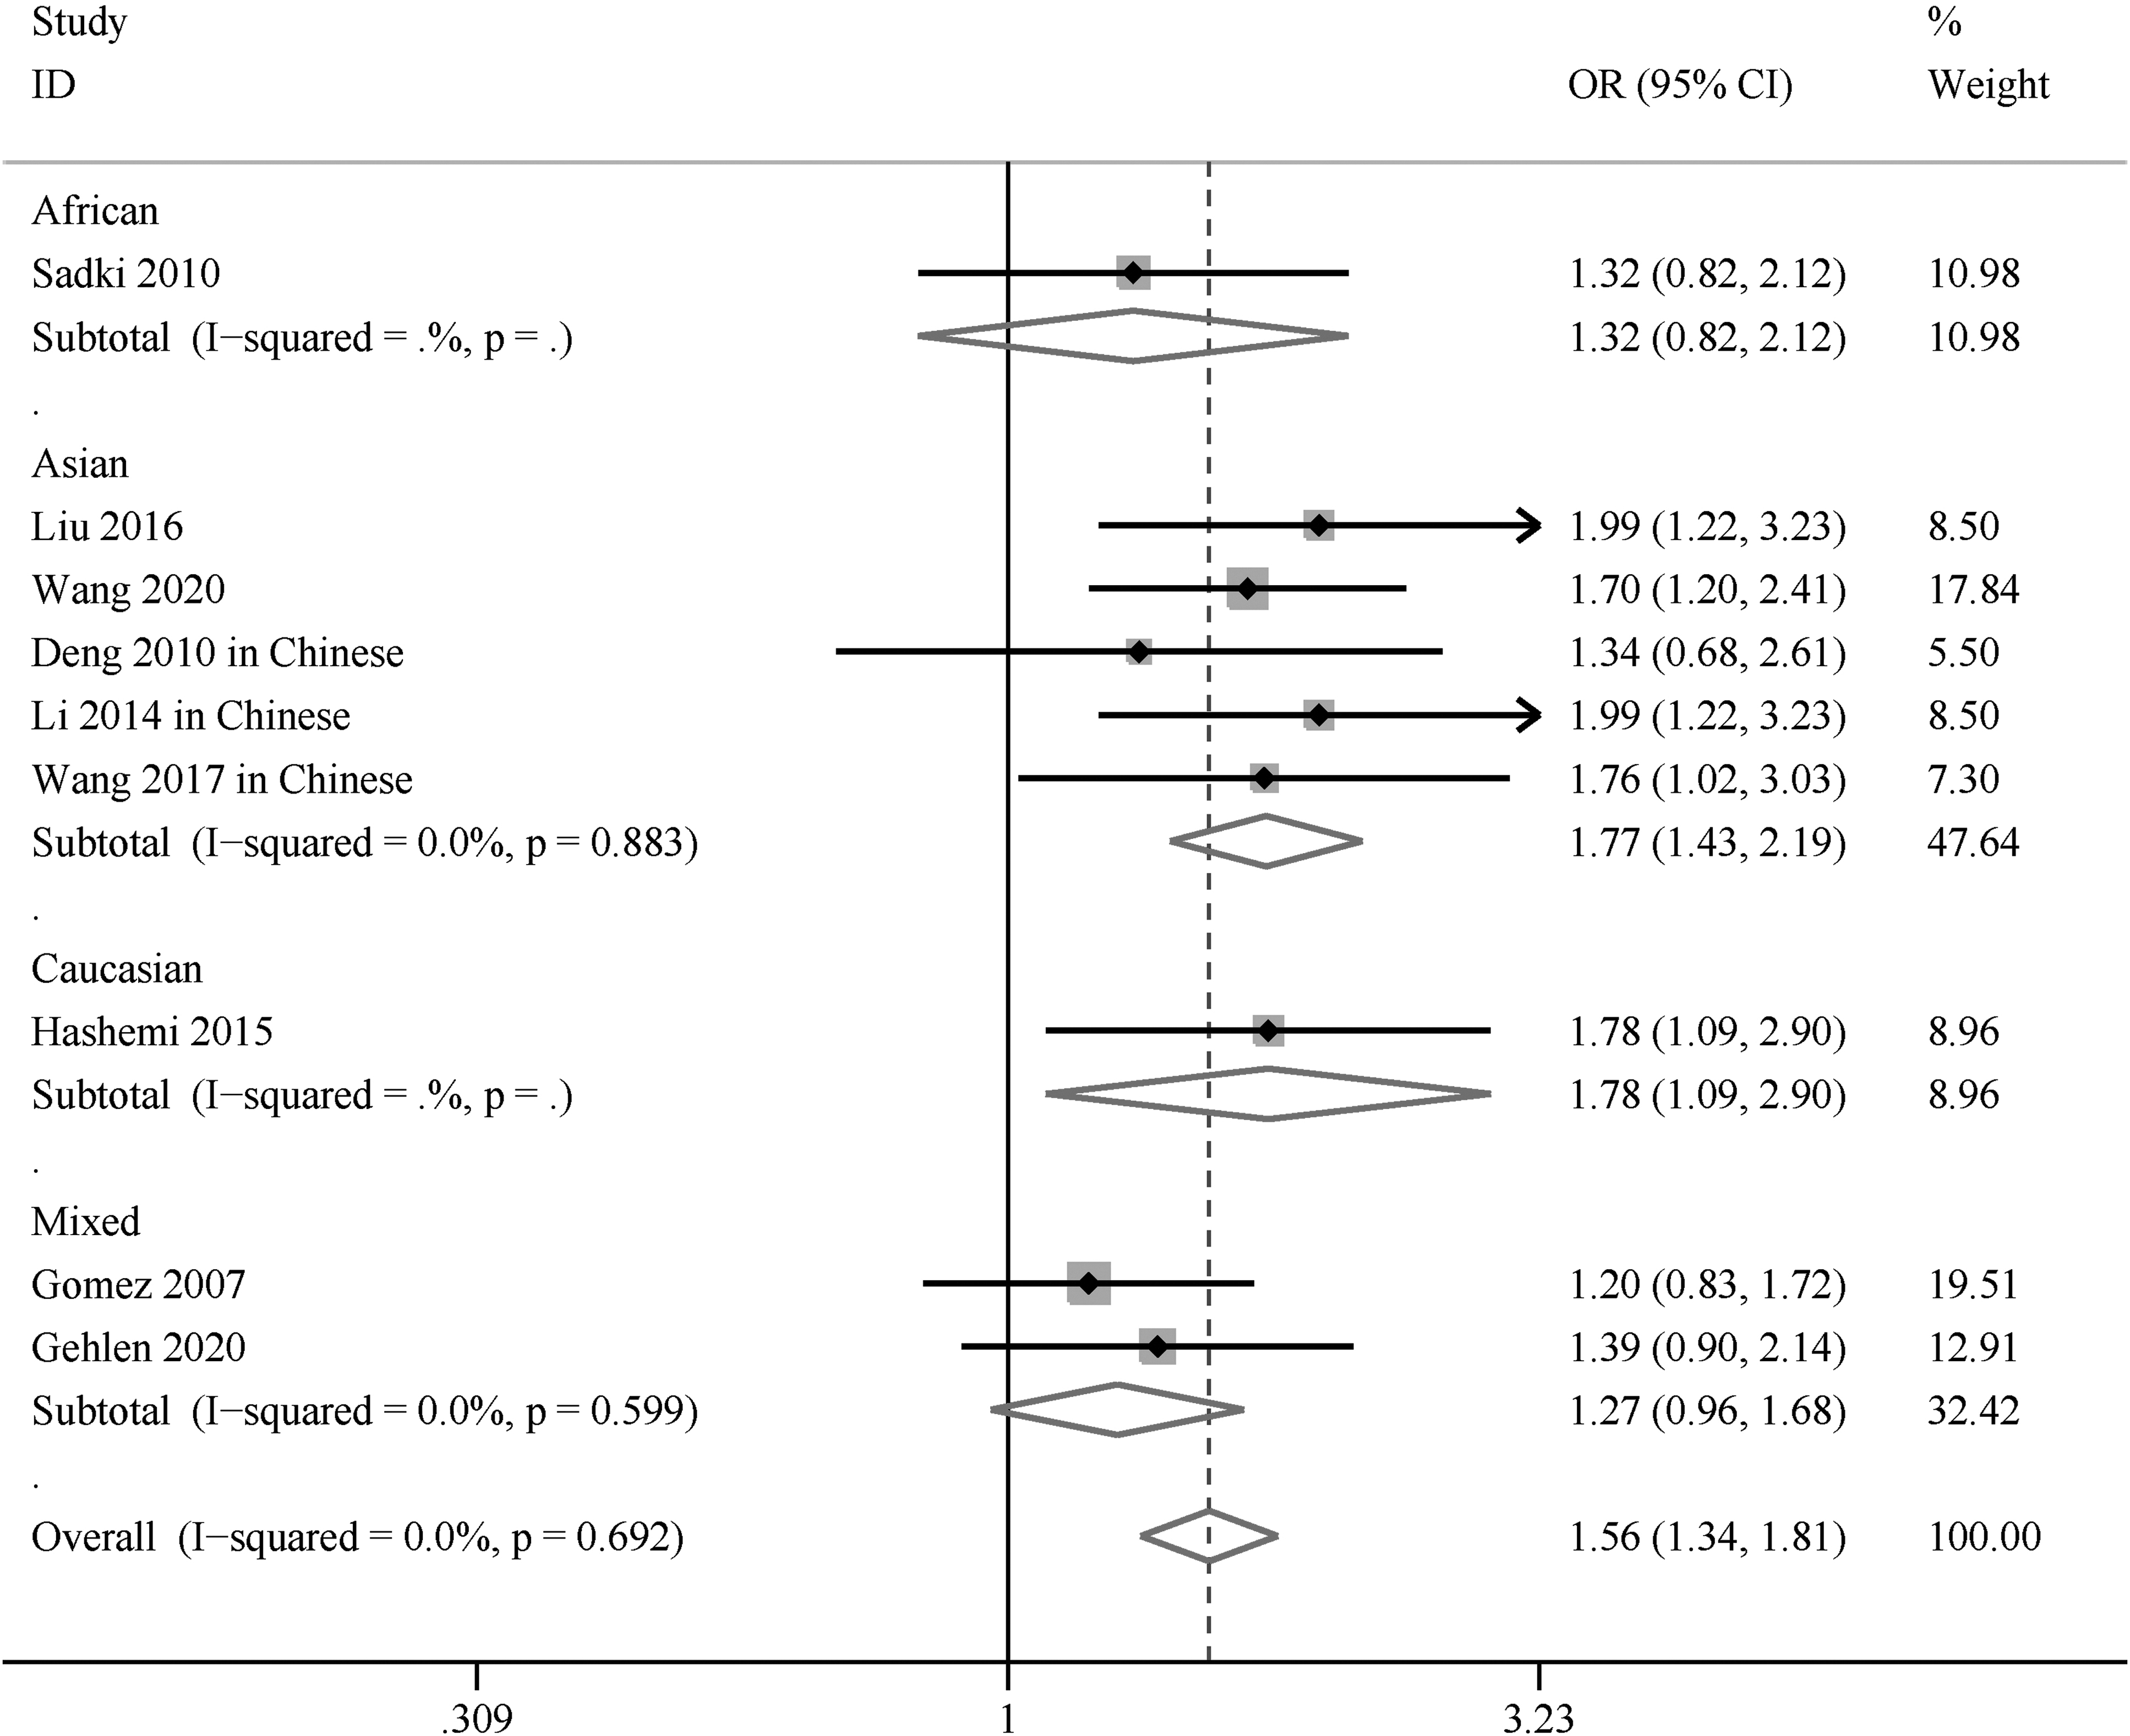
Forest plot of the MIF-173 gene polymorphism linked to TB susceptibility (genotype CC+GC vs. genotype GG). The pooled analysis indicated that the MIF-173 gene locus CC genotype was a TB risk factor in the overall population.
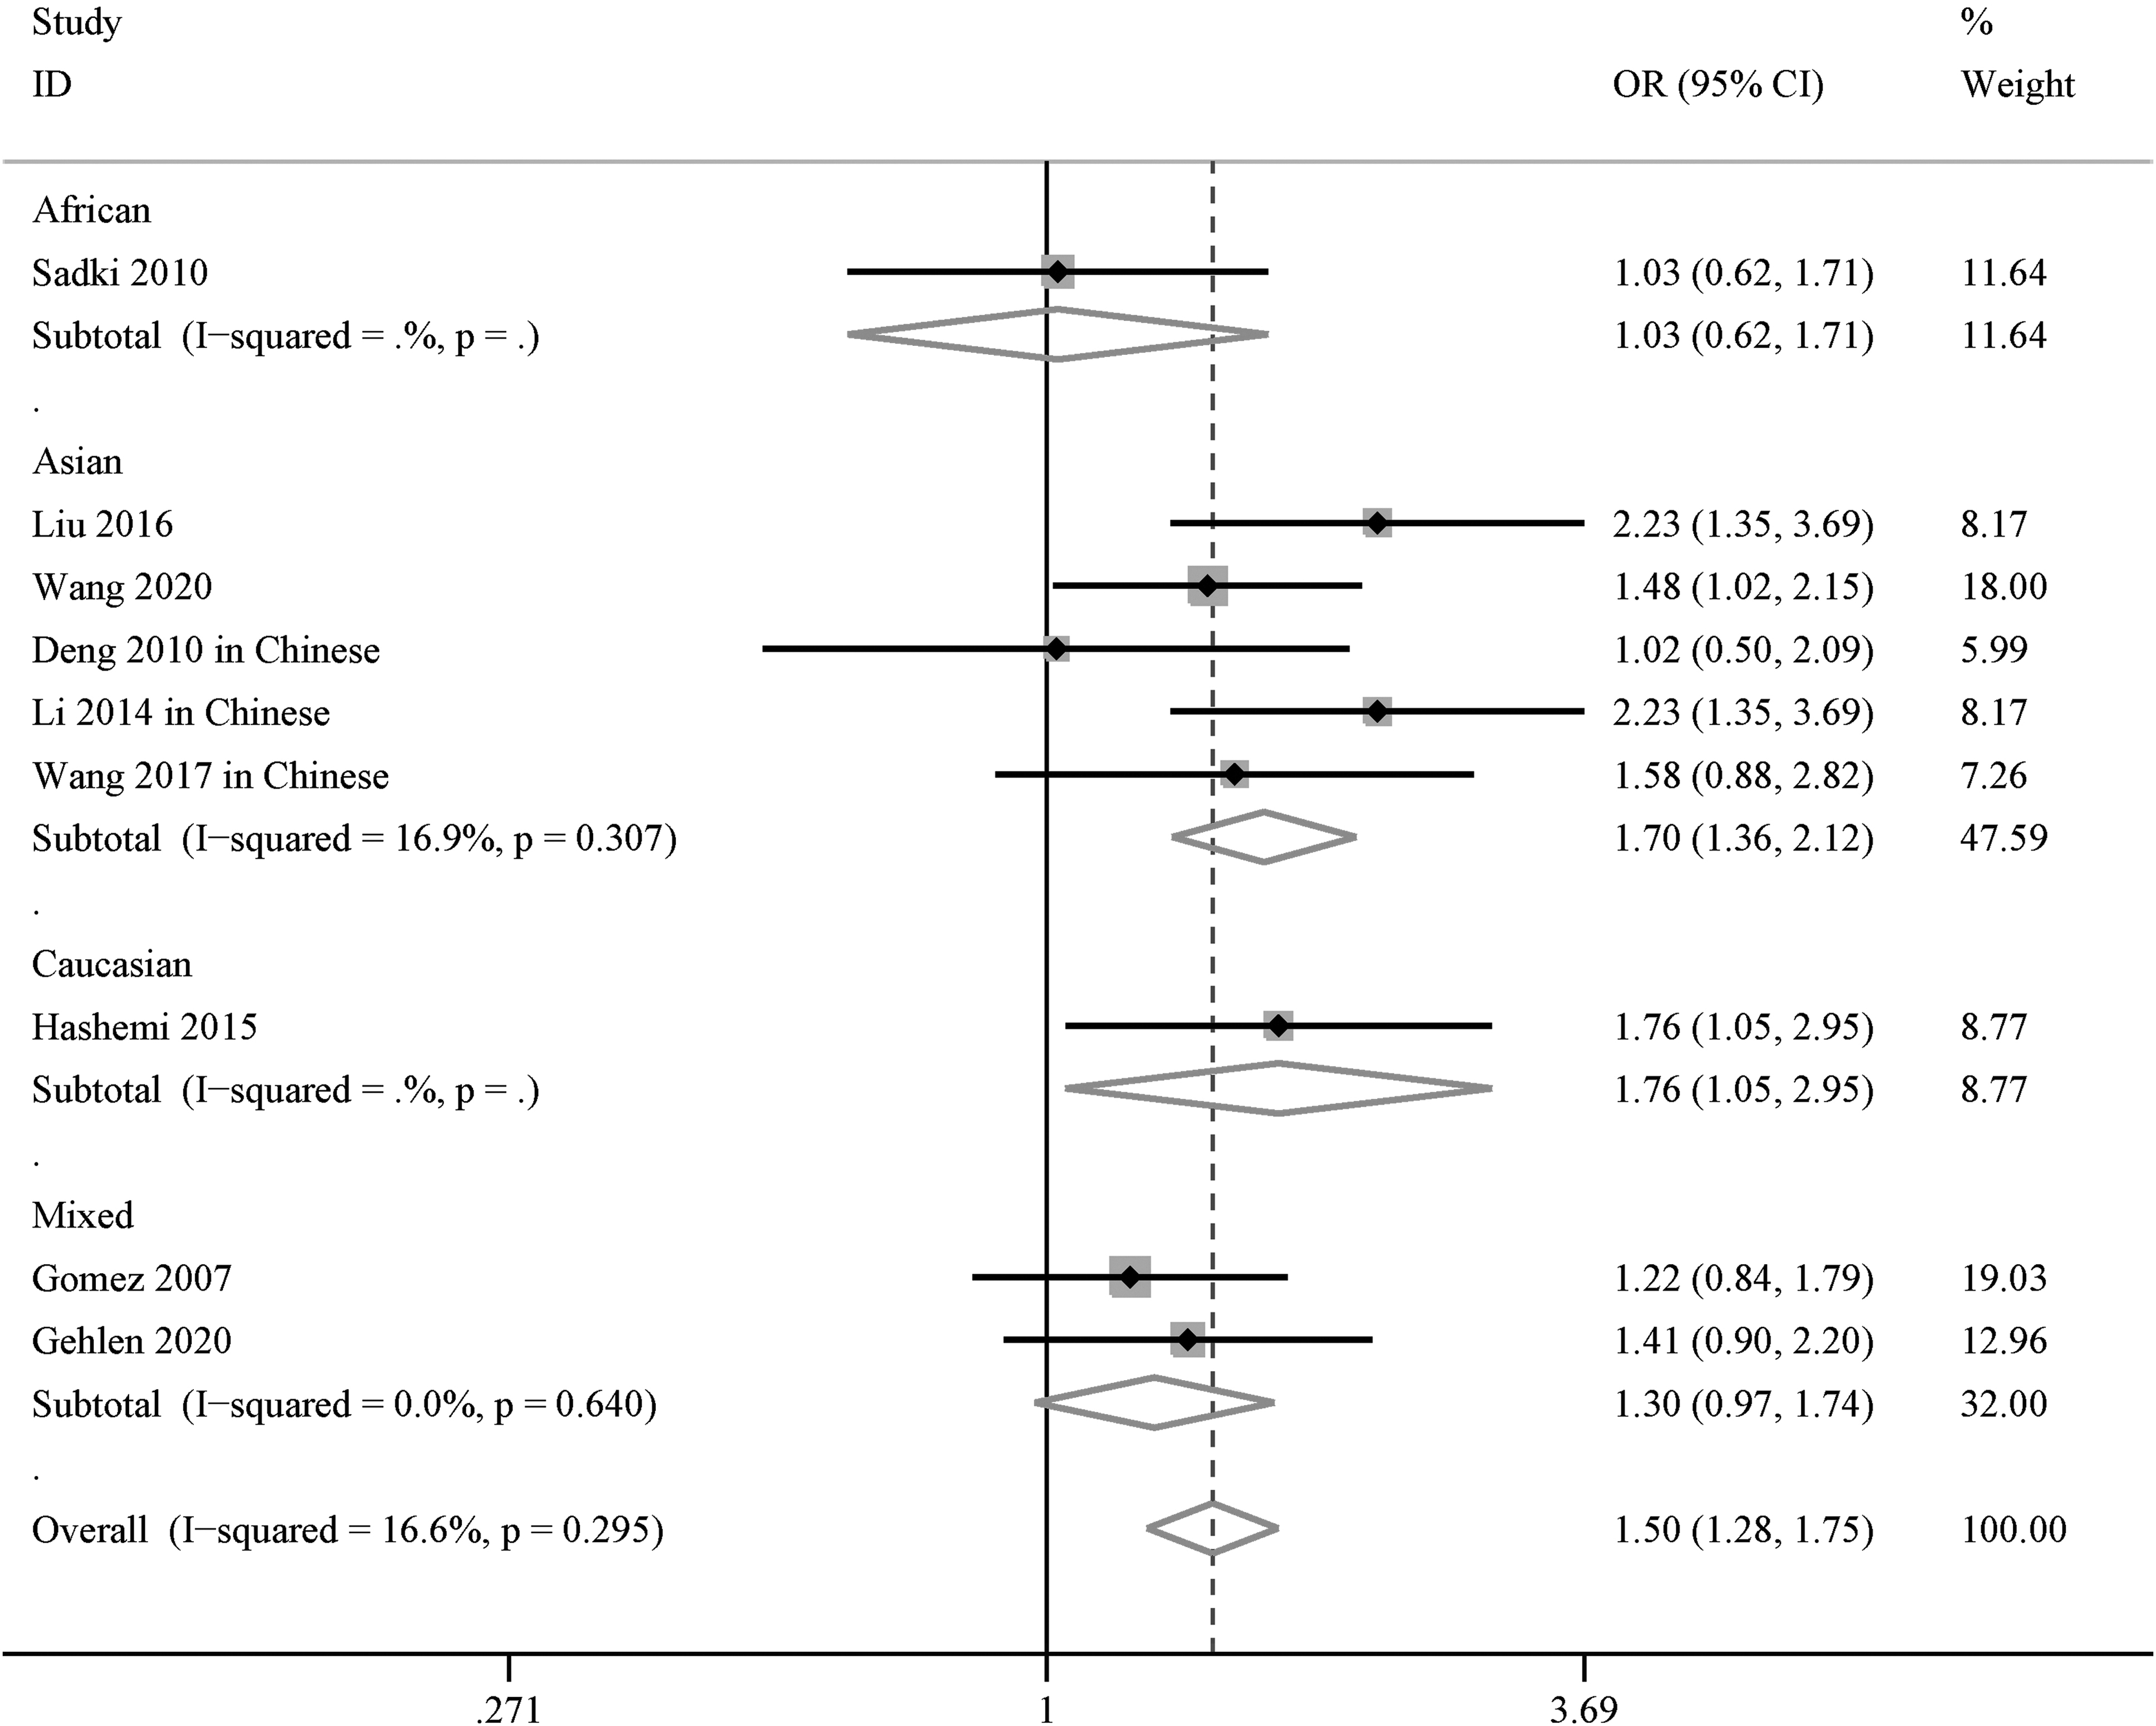
Forest plot of the MIF-173 gene polymorphism linked to TB susceptibility (genotype GC vs. genotype GG). The pooled analysis indicated that the MIF-173 gene locus GC genotype was associated with TB susceptibility in the overall population.
Meta-Analysis of the Link Between Macrophage Migration Inhibitory Factor-173GC/CATT-794 Gene Locus Polymorphisms and the Susceptibility of Tuberculosis
CI, confidence interval; MIF, macrophage migration inhibitory factor; OR, odds ratio; PTB, pulmonary tuberculosis; STB, spinal tuberculosis.
Subgroup analysis was performed based on different TB types and ethnicities. The results indicated that the MIF-173G/C gene polymorphism was significantly related to PTB risk (allele C vs. allele G: OR = 1.36, 95% CI: 1.18-1.56, p < 0.01, Fig. 1; genotype CC vs. genotype GG: OR = 1.40, 95% CI: 0.77-2.52, p = 0.04, Fig. 2; genotype CC+GC vs. genotype GG: OR = 1.51, 95% CI: 1.26-1.79, p < 0.01; genotype GC vs. genotype GG: OR = 1.49, 95% CI: 1.24-1.79, p < 0.01). Similarly, we found an obvious association between the MIF-173G/C gene polymorphism and STB (allele C vs. allele G: OR = 1.70, 95% CI: 1.34-2.14, p < 0.01; genotype CC vs. genotype GG: OR = 2.83, 95% CI: 1.65-4.86, p = 0.94; genotype CC+GC vs. genotype GG: OR = 1.72, 95% CI: 1.28-2.30, p < 0.01; genotype GC vs. genotype GG: OR = 1.51, 95% CI: 1.10-2.07, p = 0.01).
In addition, the MIF-173G/C gene polymorphism was related to TB susceptibility in Asian subjects (allele C vs. allele G: OR = 1.56, 95% CI: 1.32-1.84, p < 0.01; genotype CC+GC vs. genotype GG: OR = 1.77, 95% CI: 1.43-2.19, p < 0.01, Fig. 3; genotype GC vs. genotype GG: OR = 1.70, 95% CI: 1.36-2.12, p < 0.01, Fig. 4) (Table 1). We also found that the MIF-173G/C gene polymorphism correlated with TB susceptibility in Caucasian and African subjects (Table 1).
The correlation between MIF CATT-794 gene polymorphism and PTB susceptibility
Seven studies explored the correlation between the MIF CATT-794 gene polymorphism and PTB susceptibility (Li et al., 2012a, 2012b; Li, 2014; Kuai et al., 2016; Liu et al., 2018; Reid et al., 2019; Machado et al., 2021). Our pooled analysis indicated that the MIF CATT-794 gene polymorphism was not related to PTB susceptibility in the overall subjects (genotype 5/X+6/X vs. genotype 7/X+8/X: OR = 0.57, 95% CI: 0.32-1.02, p = 0.06 [Appendix Fig. A1]; genotype 5 + 6 vs. genotype 7 + 8: OR = 0.78, 95% CI: 0.57-1.06, p = 0.11 [Appendix Fig. A2 and Table 1]).
However, we found that the MIF CATT-794 gene polymorphism was related to PTB susceptibility in Asian subjects (genotype 5/X+6/X vs. genotype 7/X+8/X: OR = 0.39, 95% CI: 0.24-0.64, p < 0.01; genotype 5 + 6 vs. genotype 7 + 8: OR = 0.57, 95% CI: 0.47-0.69, p < 0.01) (Table 1).
Association between TB susceptibility and serum MIF levels
Nine case-control studies comprising 2100 participants (1115 cases and 985 controls) reported the association between TB and serum MIF concentrations (Li et al., 2012b; Zhao and Wang, 2012; Shi, 2013; Li, 2014; Kuai et al., 2016; Liu et al., 2018; Wang et al., 2020, 2021; Xu et al., 2021). The pooled analysis showed that serum MIF levels in TB patients were significantly higher than those in healthy controls (SMD = 2.35, 95% CI = 1.56-3.14, p < 0.01) (Fig. 5). Seven studies discussed serum MIF levels in PTB patients.

Forest plot of the association between serum MIF levels and TB. The pooled analysis indicated that serum MIF levels were significantly increased in PTB and STB patients.
Our pooled analysis showed that serum MIF levels in PTB patients increased significantly (SMD = 2.51, 95% CI = 1.33-3.68, p < 0.01) (Fig. 5). In addition, the pooled analysis of two studies showed that serum MIF levels in STB patients were higher than those in healthy controls (SMD = 1.79, 95% CI = 1.56-2.01, p < 0.01) (Fig. 5). Conversely, only a few studies found correlations between MIF polymorphisms and serum MIF levels. Deng et al. found that serum MIF levels in the MIF-173 G/G and MIF-173 C/C groups were 687.62 ± 65.69 and 711.73 ± 70.20 μg/mL, respectively, indicating that serum MIF levels in the latter increased (Deng et al., 2010).
Publication bias
There was no potential publication bias in the analysis of the association between the MIF-173G/C/MIF CATT-794 genotype and TB susceptibility, as noted by Begg's test (p > 0.05). However, we observed noticeable heterogeneity among studies exploring the association between TB and serum MIF concentrations (I2 = 98%).
Discussion
This pooled analysis indicated that the MIF-173G/C gene polymorphism was associated with PTB and STB susceptibility and that the MIF-173G/C C allele/CC genotype might be a TB risk factor. In addition, we found that MIF serum levels significantly increased in PTB and STB patients.
In 1993, MIFs were purified and cloned, with a molecular weight of 12.5 kDa (Bernhagen et al., 1993). Various immune cells (e.g., macrophages and lymphocytes) produce MIFs. MIFs function physiologically to suppress immune cell responses and effectively inhibit inflammatory response-induced immune cell apoptosis. It has been found that MIFs can act as an immunomodulatory factor by regulating tumor necrosis factor-α, interleukin-2, and interferon-γ (IFN-γ) production.
Meanwhile, MIFs can promote interactions between cyclooxygenase (COX-2) and other inflammatory cytokines, then aggravate inflammation. Hence, we postulated that MIFs were vital in various infectious and inflammatory diseases. Previous studies suggested that MIFs were closely associated with sepsis, autoimmune diseases, and metabolic diseases (Grieb et al., 2010). In addition, MIFs have been found to act in TB infections.
The human MIF gene is located on chromosome 22 (22q11.2). SNPs at the nucleotide position −173 and the microsatellite polymorphism −794 are the two most common MIF gene polymorphism markers (Ma et al., 2018). Previous genome-wide association studies explored the association between various MIF gene SNPs and disease susceptibility. Three SNPs and one microsatellite polymorphism at position −794 CATT5-8 (rs5844572) of the human MIF gene have been found. Three SNPs of the MIF gene were found at positions −173 (rs755622), +254 (rs2096522), and +656 (rs2070766).
MIF +254 (rs2096522) and MIF +656 (rs2070766) are located in the intron. Genetic epidemiology studies have shown that only MIF-173 (rs755622) and MIF-794 CATT5-8 gene polymorphisms can impact various immune and infectious diseases (e.g., rheumatoid arthritis, asthma, and TB) (Grieb et al., 2010).
Previous pooled analyses explored the relationship between MIF gene polymorphisms and TB risk. In 2017, a meta-analysis included five case-control studies. It indicated that the MIF-173 G/C variant was associated with TB risk (Naderi et al., 2017). Ma et al. (2018) also performed a meta-analysis and found that the MIF-794 alleles CATT7 and CATT8 were associated with TB susceptibility. However, these pooled analyses only included a small number of studies. We rechecked the related studies and included more high-quality research to provide more accurate results. In addition, we explored the relationship between serum MIF levels and TB susceptibility.
We found that the MIF-173G/C gene polymorphism correlated with PTB and STB susceptibility in Asian and Caucasian patients, and the MIF-173G/CC allele/CC genotype might be TB risk factors. The MIF CATT-794 gene polymorphism was associated with PTB susceptibility in Asian subjects. In addition, serum MIF levels were significantly increased in PTB and STB patients. We added more studies to our pooled analysis to add credibility to our results.
TB continues to be a notable fatal infectious disease among adults worldwide. Furin et al. (2019) reported that 10 million people become newly infected with TB annually. Previous research has verified that only a small number of these subjects would ultimately develop active TB (e.g., PTB), particularly HIV-infected subjects and those receiving immunosuppressive therapy. It indicated that the pathophysiology of TB is associated with immune dysfunction.
A recent study demonstrated that local immune responses at the site of infection were important factors in controlling TB (Torrelles and Schlesinger, 2017). PTB is the most common clinical presentation of a TB infection. TB also affects organs other than lung tissue (e.g., lymph nodes and spine). We found that the MIF-173G/C gene polymorphism could affect PTB and STB susceptibility.
The MIF-173G/C gene polymorphism is a critical TB regulatory factor. Although studies on MIF-173G/C gene polymorphism regulation in TB susceptibility have greatly progressed, its detailed mechanism remains unclear. Donn et al. reported that the MIF-173C allele was associated with higher MIF protein production levels (Donn et al., 2002). The MIF-794 CATT repeat was associated with MIF gene transcription levels (Llamas-Covarrubias et al., 2013). In addition, Li et al. (2012b) found that the MIF-794 CATT5-8 microsatellite polymorphism was associated with MIF gene promoter activity and serum MIF levels.
Likewise, individuals with the MIF-173 C allele or CC genotype had higher serum MIF levels, suggesting that the MIF-173G/C and MIF-794 CATT genetic variations were associated with TB susceptibility. The MIF-173G/C C allele/CC genotype might result in TB susceptibility by elevating MIF levels, a key contributor to chronic inflammatory injury.
This study had a few limitations. First and foremost, similar pooled analyses examining the impact of MIF gene polymorphisms on TB susceptibility have been performed previously. However, we included more studies in our pooled analysis to gain more credible results. Second, our research focused on the MIF-173 and MIF-794 genetic alterations, but previous studies indicated that other gene polymorphisms (e.g., the vitamin D receptor and IFN-γ gene) also correlate with TB susceptibility (Mandal et al., 2019; Yadav et al., 2021). Thus, further pooled analyses should be performed for these gene SNPs.
Conclusion
The MIF-173G/C gene polymorphism correlated with PTB and STB susceptibility in Asian and Caucasian subjects, and the MIF-173G/C C allele/CC genotype might be a TB risk factor. However, the MIF CATT-794 gene polymorphism was associated with PTB susceptibility only in Asian subjects. Our pooled analysis indicated that serum MIF levels significantly increased in PTB and STB patients.
Data Availability
The data used to support the findings of this study are available from the first author and corresponding author upon request. This is a meta-analysis using previous relevant published studies. There are no human participants and/or animals involved in this study.
Footnotes
Authors' Contributions
S.-k.Y, S.-y.Y., X.-b.Z., and N.L. analyzed the data and wrote the article. S.-k.Y. and S.-y.Y. performed the literature search. S.-k.Y. edited the article.
Author Disclosure Statement
No competing financial interests exist.
Funding Information
This study was supported by the Hunan Provincial Health Commission Project (202203022853) and Hunan Provincial Clinical medical technology innovation guide project (2020SK53601).
Characteristics of the Studies Evaluating the Effects of Macrophage Migration Inhibitory Factor CATT-794 Gene Polymorphisms on Tuberculosis Risk
| Author (year) | Gene sites | Genotypes | Alleles | Sample size | |||||||
|---|---|---|---|---|---|---|---|---|---|---|---|
| Patients | Control | Patients | Control | ||||||||
| MIF CATT-794 | 5/X+6/X | 7/X+8/X | 5/X+6/X | 7/X+8/X | 5 + 6 | 7 + 8 | 5 + 6 | 7 + 8 | Patients | Control | |
| Li et al. (2012a) | 93 | 122 | 134 | 111 | 266 | 164 | 363 | 127 | 215 | 245 | |
| Li et al. (2012b) | 124 | 27 | 137 | 12 | 195 | 107 | 222 | 76 | 151 | 149 | |
| Gómez et al. (2007) | NA | NA | NA | NA | 368 | 78 | 223 | 46 | 223 | 134 | |
| Liu et al. (2018) | 179 | 21 | 98 | 2 | 315 | 85 | 175 | 25 | 200 | 100 | |
| Machado et al. (2021) | 101 | 25 | 94 | 25 | 221 | 31 | 205 | 33 | 126 | 119 | |
| Reid et al. (2019) | 81 | 17 | 64 | 30 | 178 | 18 | 156 | 32 | 98 | 94 | |
| Kuai et al. (2016) | 21 | 26 | 36 | 14 | NA | NA | NA | NA | 47 | 50 | |
| Li (2014) | 179 | 21 | 98 | 2 | 315 | 85 | 175 | 25 | 200 | 100 | |