




Abstract
Background:
The abnormal expression of genes in serum may be associated with early diagnosis of patients with malignant tumors. This study was designed to screen for significantly differentially expressed genes (DEGs) that may be associated with gastric cancer using bioinformatic methods.
Methods:
RNA-seq data from gastric cancers were downloaded from the TCGA and GEO databases, and 1903 secretory genes were downloaded from the HPA database. The diagnostic secretory RNAs of gastric cancer were screened using least absolute shrinkage and selection operator regression analysis. Univariate Cox regression analysis was used to evaluate the prognostic significance of the results. Biological functions were performed using gene ontology (GO) and Kyoto Encyclopedia of Genes and Genomes (KEGG) analyses. Then, 640 cases of gastric cancer and paracancerous tissues were collected, and immunohistochemistry (IHC) was used to detect the expression of COL4A1.
Results:
In total, 25 upregulated differentially expressed genes (DEGs) were identified, which were secreted mainly in the blood and cell matrices. Six secretory genes (OLFM4, CEMIP, APOC1, CST1, COL4A1, and CD55) with diagnostic significance were identified, and the enrichment scores of these six genes were significantly associated with tumor stage. In addition, we found that increased COL4A1 expression might be associated with a poor prognosis in patients with gastric cancer. Based on GO and KEGG analyses, we found COL4A1-related DEGs were mainly enriched in connective tissue development, collagen fibrous tissue-related processes, extracellular structure, extracellular matrix (ECM) tissue, and related to the ECM receptor-related pathway, focal adhesion, and PI3K-Akt signaling pathway. Moreover, the results of immunohistochemical analyses showed that the COL4A1 protein level in gastric cancers was also higher than in the matched paracancerous tissues.
Conclusions:
In this study, we found six upregulated secretory genes, including OLFM4, CEMIP, APOC1, CST1, COL4A1, and CD55 which we hypothesized to be significant DEGs for the diagnosis of gastric cancer. Our data also suggest that COL4A1 may play an important role in the diagnosis and prognosis of gastric cancer.
Introduction
Gastric cancer is the most common malignant tumor of the digestive system (Sung et al., 2021; Wang et al., 2021). According to the latest statistics, there were >1 million new cases and ∼769,000 deaths worldwide in 2020 (Wang et al., 2021). Although the treatment level of gastric cancer has gradually improved, the prognosis of gastric cancer is still poor, mainly because gastric cancer is usually diagnosed at an advanced stage (Tan, 2019; Machlowska et al., 2020; Petryszyn et al., 2020).
Gastric cancer is mostly asymptomatic before the advanced stage and can only effectively be detected by endoscopy (Tan, 2019). Tumor biomarkers aim to judge the occurrence, development, and drug sensitivity of diseases and can serve as indicators to objectively measure and evaluate normal biological processes (BPs) and pathogenic processes (Mäbert et al., 2014). Hence, finding specific biomarkers for gastric cancer is significant for the early diagnosis, precision treatment, and prognostic evaluation of gastric cancers.
In this study, we aimed to identify significant differentially expressed genes (DEGs) as potential diagnostic and prognostic biomarkers for gastric cancer. Many biomarkers for gastric cancers are used in clinical practice, including carcinoembryonic antigen (CEA), carcinoembryonic antigen 19-9 (CA19-9), carcinoembryonic antigen 72-4 (CA72-4), carcinoembryonic antigen 125 (CA125), and Alpha-Fetoprotein (AFP) (Feng et al., 2017; Matsuoka and Yashiro, 2018). Different from AFP for hepatocellular carcinoma and CA125 for ovarian carcinoma, the sensitivity and specificity of these serum biomarkers for gastric cancers are limited.
Seeking significant genes with high sensitivity, specificity, and noninvasiveness in gastric cancer is the direction of the study of gastric cancer biomarkers. The rapid development of genome sequencing makes us know more about malignant diseases, helps us to identify and classify the many genetic and epigenetic changes associated with tumorigenesis, and promotes the creation of a new method for cancer treatment and individualized treatment (Sacks et al., 2018; Luo et al., 2021).
By combining RNA sequencing data with bioinformatics, Li et al. (2019) found that ITGA2 may be a potential prognostic and predictive biomarker of low-grade gliomas (Lin et al., 2021). Liu et al. (2021) found that TBC1D16 is a potential predictor of chemotherapy sensitivity and prognosis in patients with acute myeloid leukemia. This means that genome sequencing will help us to identify potential tumor biomarkers more accurately and quickly.
The Human Protein Atlas database (HPA) provides information for identifying different types of biomarkers. A class of proteins that are of particular concern in HPA is the secretory, which provides a valuable resource for the diagnosis, prognosis, and treatment of diverse diseases, especially cancers (Brown et al., 2013). Secreted proteins can be detected in biological fluids (blood, urine, and saliva), enabling early diagnosis and early screening of populations. For example, DSG2 indicates its potential to be tested in liquid biopsy and used as a biomarker for laryngeal squamous cell carcinomas (Cury et al., 2020).
In addition, Glypican 1 (GPC1) expression in the blood of patients with pancreatic cancer was used to distinguish between benign and malignant diseases by Sonia et al. (Melo et al., 2015). Therefore, we consider whether it is possible to predict secreted proteins based on RNA-seq data and predict whether they can be used for the early diagnosis and prognosis evaluation of gastric cancer.
Therefore, with the combined analysis of data from TCGA-STAD cohorts, four cohorts (GSE13861, GSE29272, GSE62254, and GSE84437) from the Gene Expression Omnibus (GEO) database, and secretory data sets from HPA data sets, we performed this study to identify potential diagnostic and prognostic significant secreted DEGs of gastric cancers to establish directions for exploring novel biomarkers for gastric cancer patients. In addition, we validated the identified significant secreted DEGs in tissue microarrays (TMAs) from the department of gastrointestinal surgery at WCH hospital and analyzed COL4A1 expression levels.
Methods
Date collection
This study collected transcriptome data from the TCGA and NCBI GEO databases. RNA-seq data and clinicopathological characteristics from TCGA databases were downloaded from TCGA (https://gdc-portal.nci.nih.gov) by the “TCGAbiolinks” R package (Colaprico et al., 2016; Chen et al., 2022). The microarray data (GSE13861, GSE29272, GSE62254, and GSE84437) (Cho et al., 2011; Wang et al., 2013; Cichon et al., 2015; Yoon et al., 2020) were obtained from the NCBI GEO database.
TCGA-STAD, GSE13861, and GSE29272 were used to screen the significant secreted DEGs. Combined with clinicopathological data, the GSE13861, GSE29272, and TCGA-STAD cohorts were used to validate the prognostic meaning of screening the significant secreted DEGs. The secretory gene sets from the HPA database were used to identify the potential significant tumor DEGs of gastric cancers (Supplementary Table S1).
Besides, the TMA from the Department of West China Hospital, Sichuan University, was used to validate the clinicopathological and prognostic meaning of the screened significant secreted DEGs. A total of 680 tumor tissues and paracancerous tissues from 340 gastric cancer patients underwent surgical treatment in WCH TMA cohorts. Collected tissues and clinicopathological data were approved by the biomedical ethical committee of the West China Hospital, Sichuan University, China (No. 2014 [82] and No. 2014 [215]).
Differential expression genes analysis
For gene expression data of TCGA-STAD, GSE13861, and GSE29272, differential expression analysis was performed using the “edgeR” package (McCarthy et al., 2012), and RNAs with false discovery rate (FDR) values <0.05 and |log2foldchange| ≥ 1 were considered DEGs between tumor and normal tissues.
Identification and validation of the diagnosis gene
Least absolute shrinkage and selection operator (LASSO) analysis by the R package “glmnet” (Blanco et al., 2018) was used to screen the diagnosis meaning of the screened secreted RNAs after DEGs analysis. The single sample gene set enrichment analysis (ssGSEA) method was used to evaluate the enrichment score of screened gene sets. The diagnostic value was evaluated by the area under the curve (AUC) value of receiver operating characteristic curves.
Gene ontology and Kyoto Encyclopedia of Genes and Genomes enrichment analysis of DEGs
Functional enrichment analysis was evaluated by gene ontology (GO) BPs and Kyoto Encyclopedia of Genes and Genomes (KEGG) enrichment analyses to identify the “clusterProfiler” (Yu et al., 2012) package in R software. A Padj <0.05 served as the cutoff point to assess the functional pathways and was corrected by the Benjamini and Hochberg method.
Immunohistochemical staining
Immunohistochemistry (IHC) was performed on 5-μm thick TMA sections with antibodies specific to Anti-Collagen IV (dilution, 1:400; cat. no. ab6586; Abcam). Tissue sections were first deparaffinized in TO, hydrated in graded ethanol, and incubated with citrate antigen retrieval solution for 50 min at 95°C, down to room temperature. In addition, 1 × PBS was used as a washing reagent. Tissue sections were incubated with endogenous peroxidase blocking agent at room temperature and normal goat serum blocking solution, followed by incubation of tissue with primary antibody overnight at 4°C and then with horseradish peroxidase-conjugated rabbit.
The secondary antibody was placed at room temperature for 15 min. Positive staining was visualized using a 3,3′-diaminobenzidine substrate solution and counterstained with hematoxylin for 5 min at room temperature. All sections were observed, and images were captured using a light microscope (magnification, × 200 and × 400).
COL4A1 expression was evaluated by a semiquantitative method combining staining intensity and percentage of positive cells. QuPath (v0.2.0) is an open-source software for digital pathology image analysis to evaluate the results of IHC (Bankhead et al., 2017). We used Qupath to assess the percentage of COL4A1-positive cells on the stained slides. The percentage of positive cells (PP) was scored as follows: 0, < 25%; 1, 25% to 50%; 2, 51% to 75%; and 3, > 75%.
The staining intensity (SI) was assessed by two pathologists in a double-blind manner and graded as follows: 0, no staining; 1, yellow; 2, brownish yellow; and 3, brown. Immunohistochemical staining (IRS) results were calculated according to the immune score. In short, the IRS overall score ranges from 0 to 12, which is generated by SI × PP. Finally, the comprehensive score was divided into negative expression (0), weak positive expression (+, 1-4), moderate positive expression (++, 5-8), and strong positive expression (+++, 9-12).
Statistical analysis
All statistical analyses were performed using R software (version 4.0.2). Visualization of the analysis results was performed by the “ggplot2”(H, 2009) and “ComplexHeatmap” packages of R software. A two-tailed p < 0.05 was considered statistically significant. The normality test of the clinicopathological data used in this study was carried out before the statistical analysis of the parameter test. Quantitative data are expressed as the mean ± standard deviation (SD).
Continuous variables with a normal distribution were compared by Student's t test. Two-tailed chi-square tests or Fisher's exact tests were used for categorical variables. The Mann-Whitney U test was performed to compare non-normally distributed variables and ordinal variables. The survival outcomes of patients were calculated by the Kaplan-Meier method with the log-rank test for comparison. The multivariate Cox proportional hazards model was used to identify independent prognostic factors. Spearman's correlation coefficient was calculated to assess the association between two continuous variables.
Results
Identification of DEGs
The analysis process of this study is presented in Figure 1. Differential expression analysis was performed first. According to |Log2Foldchange| > 1 and FDR <0.05, there were 7149 DEGs (202 upregulated DEGs, 6947 downregulated DEGs) in GSE13861, 292 DEGs (127 upregulated DEGs, 165 downregulated DEGs) in GSE29272, and 9806 DEGs (7698 upregulated DEGs, 2108 downregulated DEGs) in TCGA-STAD (Supplementary Tables S2-S4).
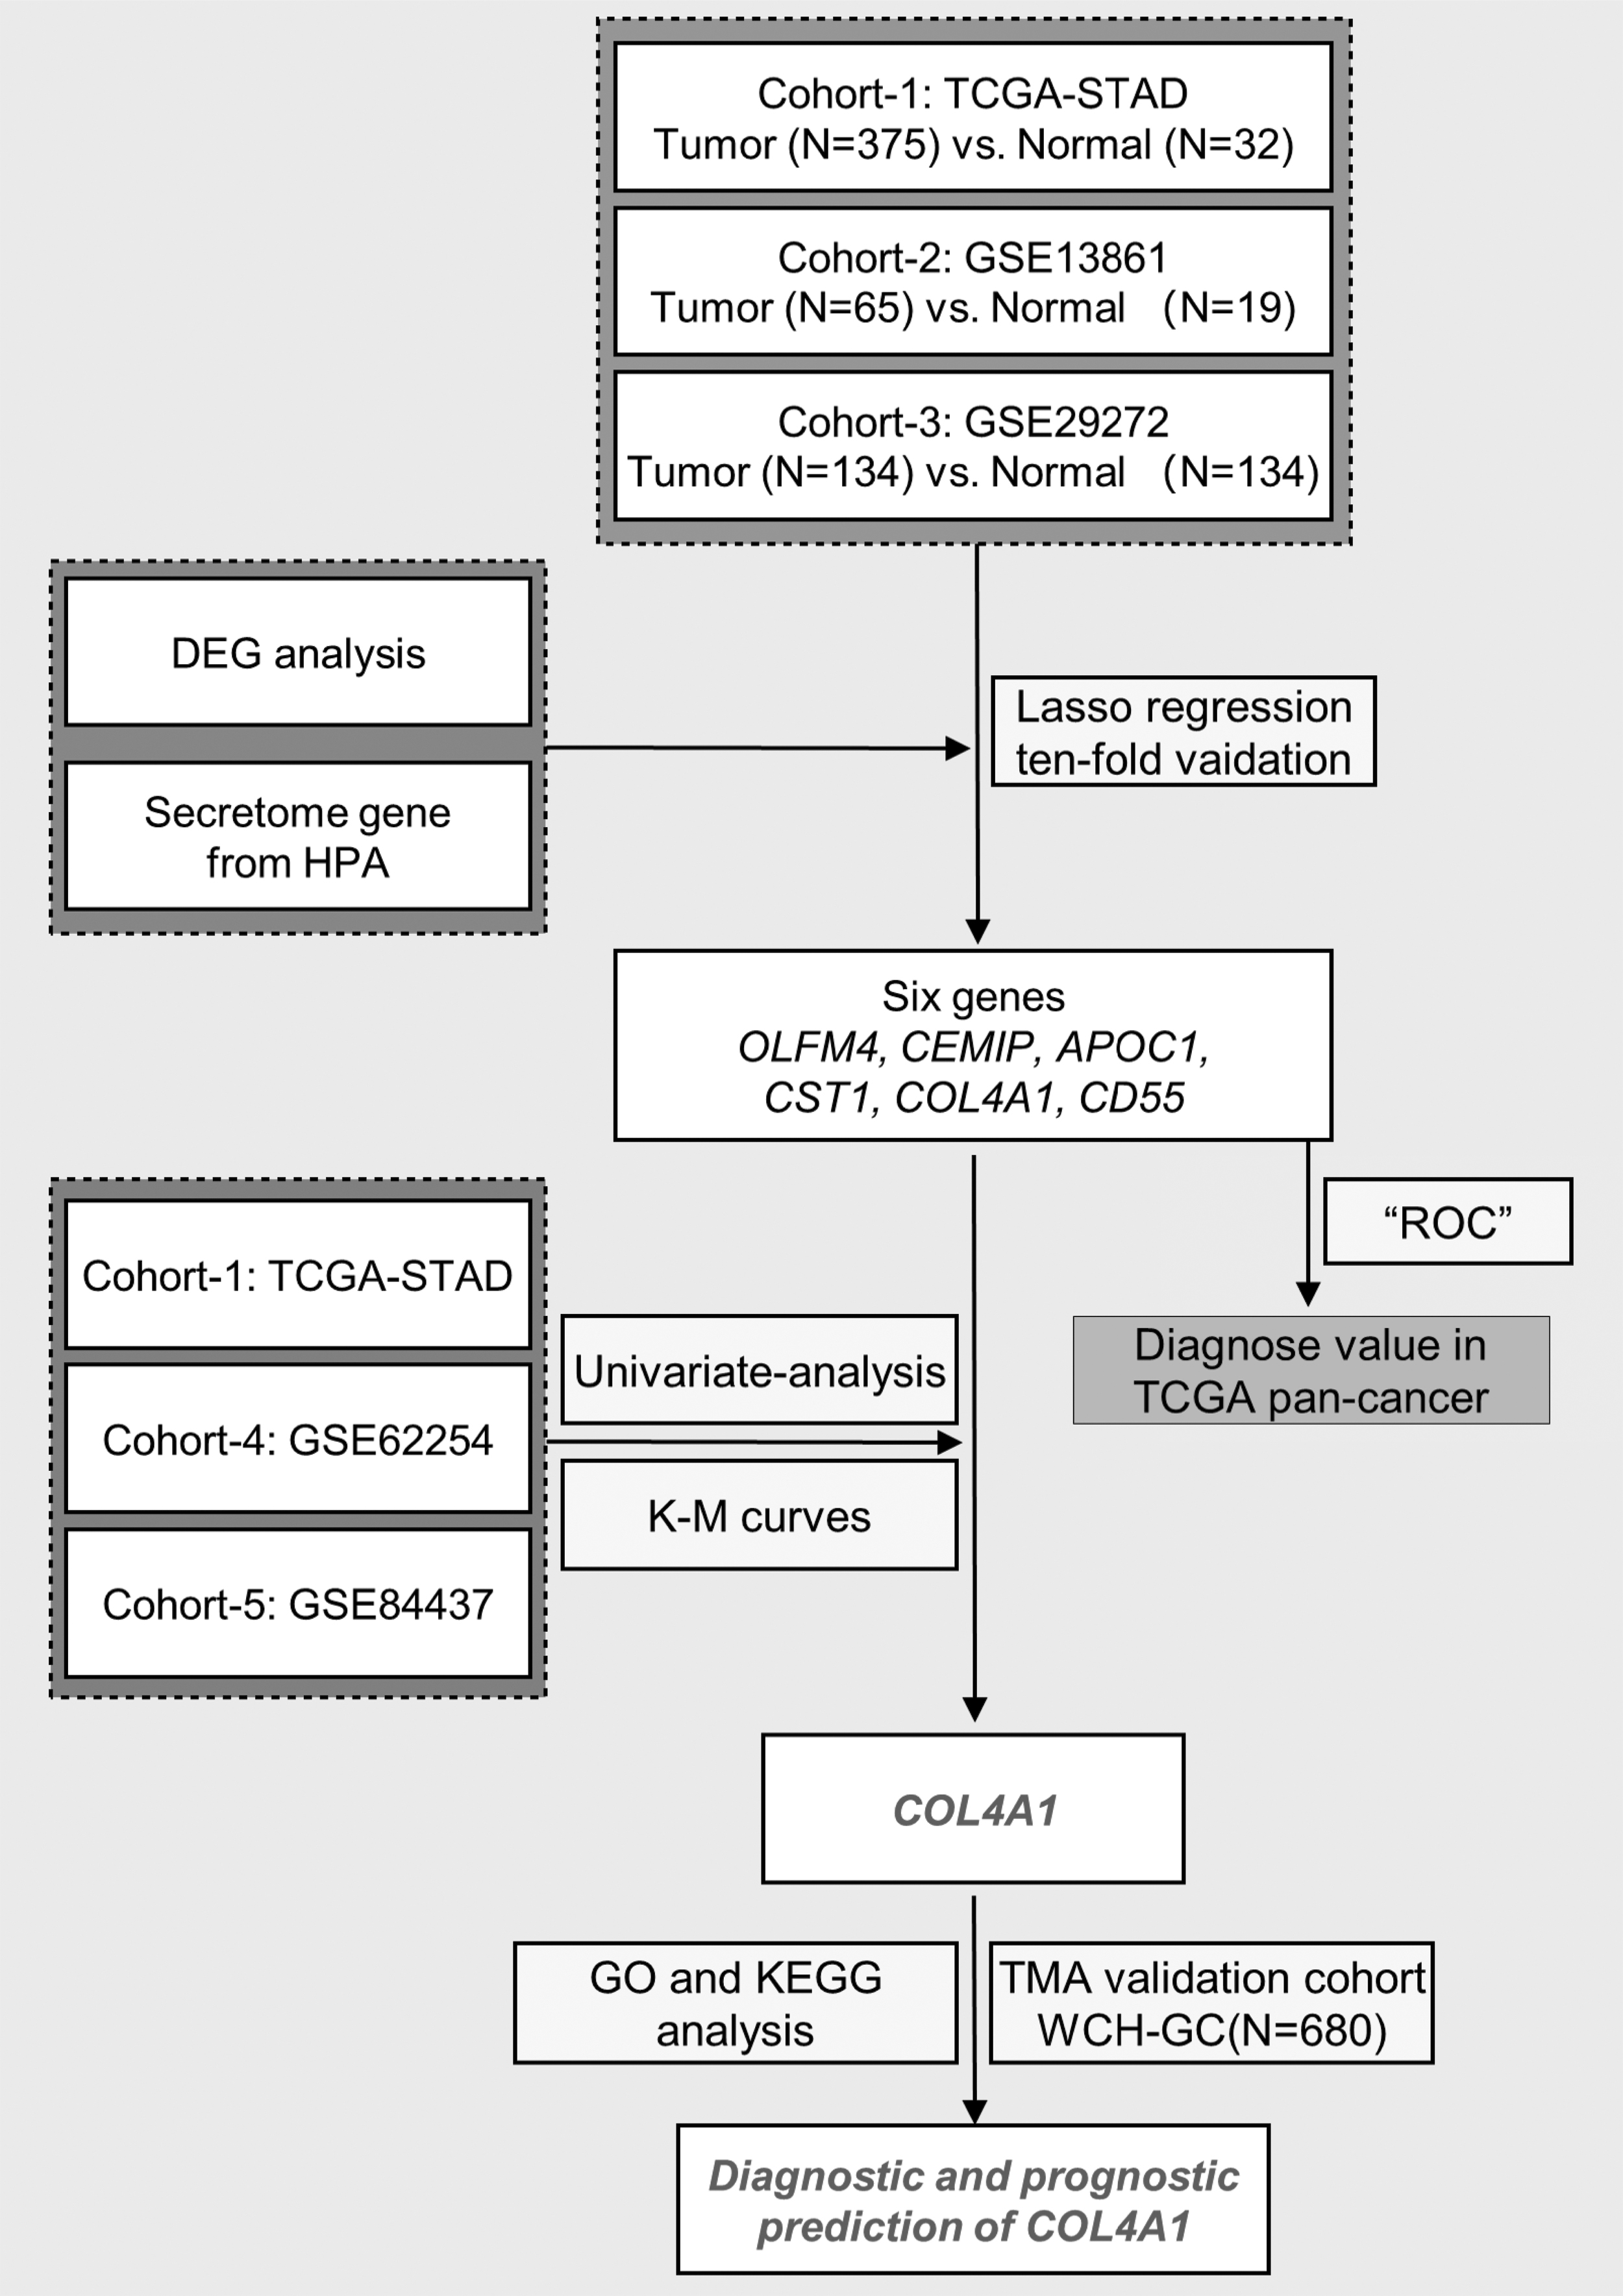
The flowchart of this study. ROC, receiver operating characteristic; GO, gene ontology; KEGG, Kyoto Encyclopedia of Genes and Genomes; K-M curves, Kaplan-Meier curves.
By the overlap with 1903 secretory genes in the HPA database, 25 upregulated DEGs (OLFML2B, KAL1, SFRP4, CEMIP, FAP, TIMP1, SPP1, APOC1, CXCL8, ISG15, CD55, PL2G2A, CST1, OLFM4, COL10A1, BGN, COL1A1, COL5A2, COL3A1, THBS2, COL1A2, COL4A1, MMP7, COL6A3, and THBS4) were screened (Fig. 2A). These 25 DEGs were predominantly secreted to the blood and extracellular matrix (ECM) (Fig. 2B). In addition, the expression difference of these 25 genes between tumor and nontumor tissue in pancancer data sets of the TCGA program was also analyzed (Fig. 2C).
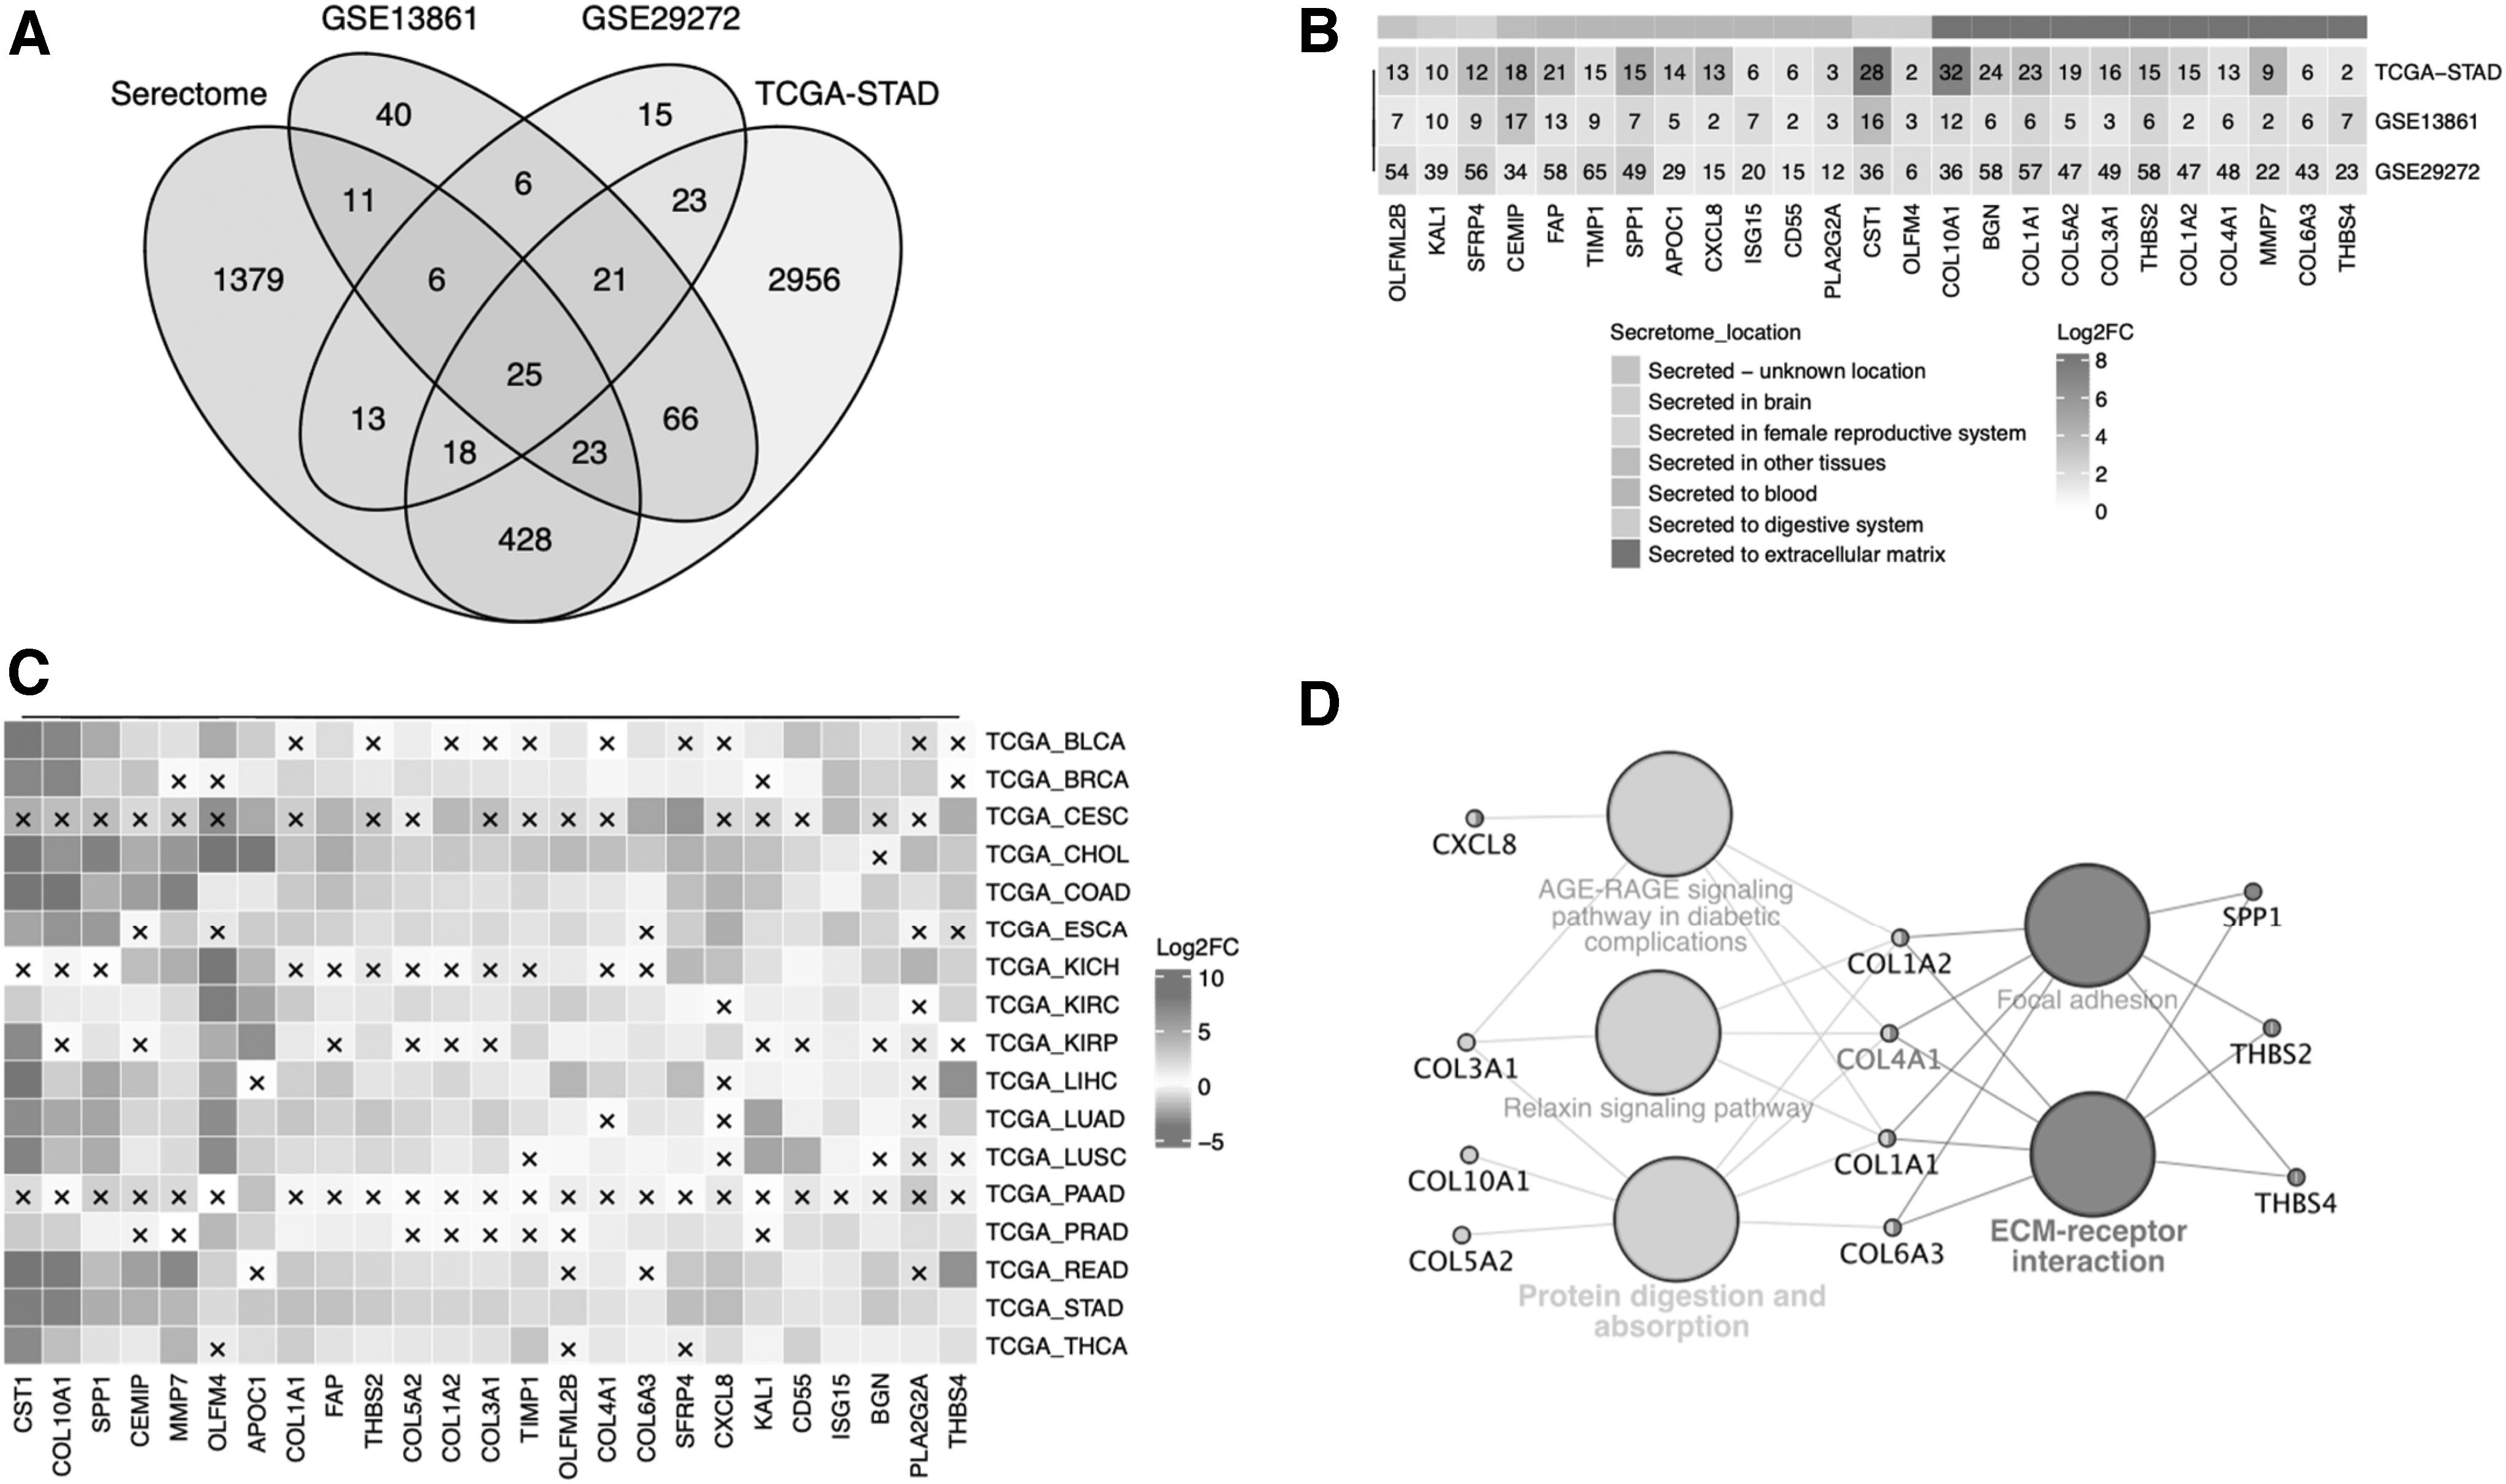
Identification of DEGs of gastric cancers.
The Cytoscape's plug-in cytohubba and MCODE were used to build critical modules based on the PPI network of those 25 DEGs. Eleven genes, CXCL8, COL3A1, COL10A1, COL5A2, COL1A2, COL4A1, COL1A1, COL6A3, SPP1, THBS2, and THBS4, were enriched according to the functional nodes of network attributes. These genes in this module are mainly involved in ECM-receptor interaction, protein digestion, absorption, etc. (Fig. 2D). Among them, COL1A2, COL4A1, COL1A1, and COL6A3 were hub genes of 11 genes. COL4A1 is at the central position and has the highest correlation with other genes.
Evaluation of diagnostic value of DEGs
Then, we used LASSO regression to screen the diagnostic value of those 25 DEGs with the aim of minimizing the potential diagnostic markers for gastric cancers. The optimal λ values were obtained from the minimum partial likelihood bias by LASSO regression with 10 cross-validations (Fig. 3A, B). Six genes (OLFM4, CEMIP, APOC1, CST1, COL4A1, and CD55) were identified by the LASSO regression.
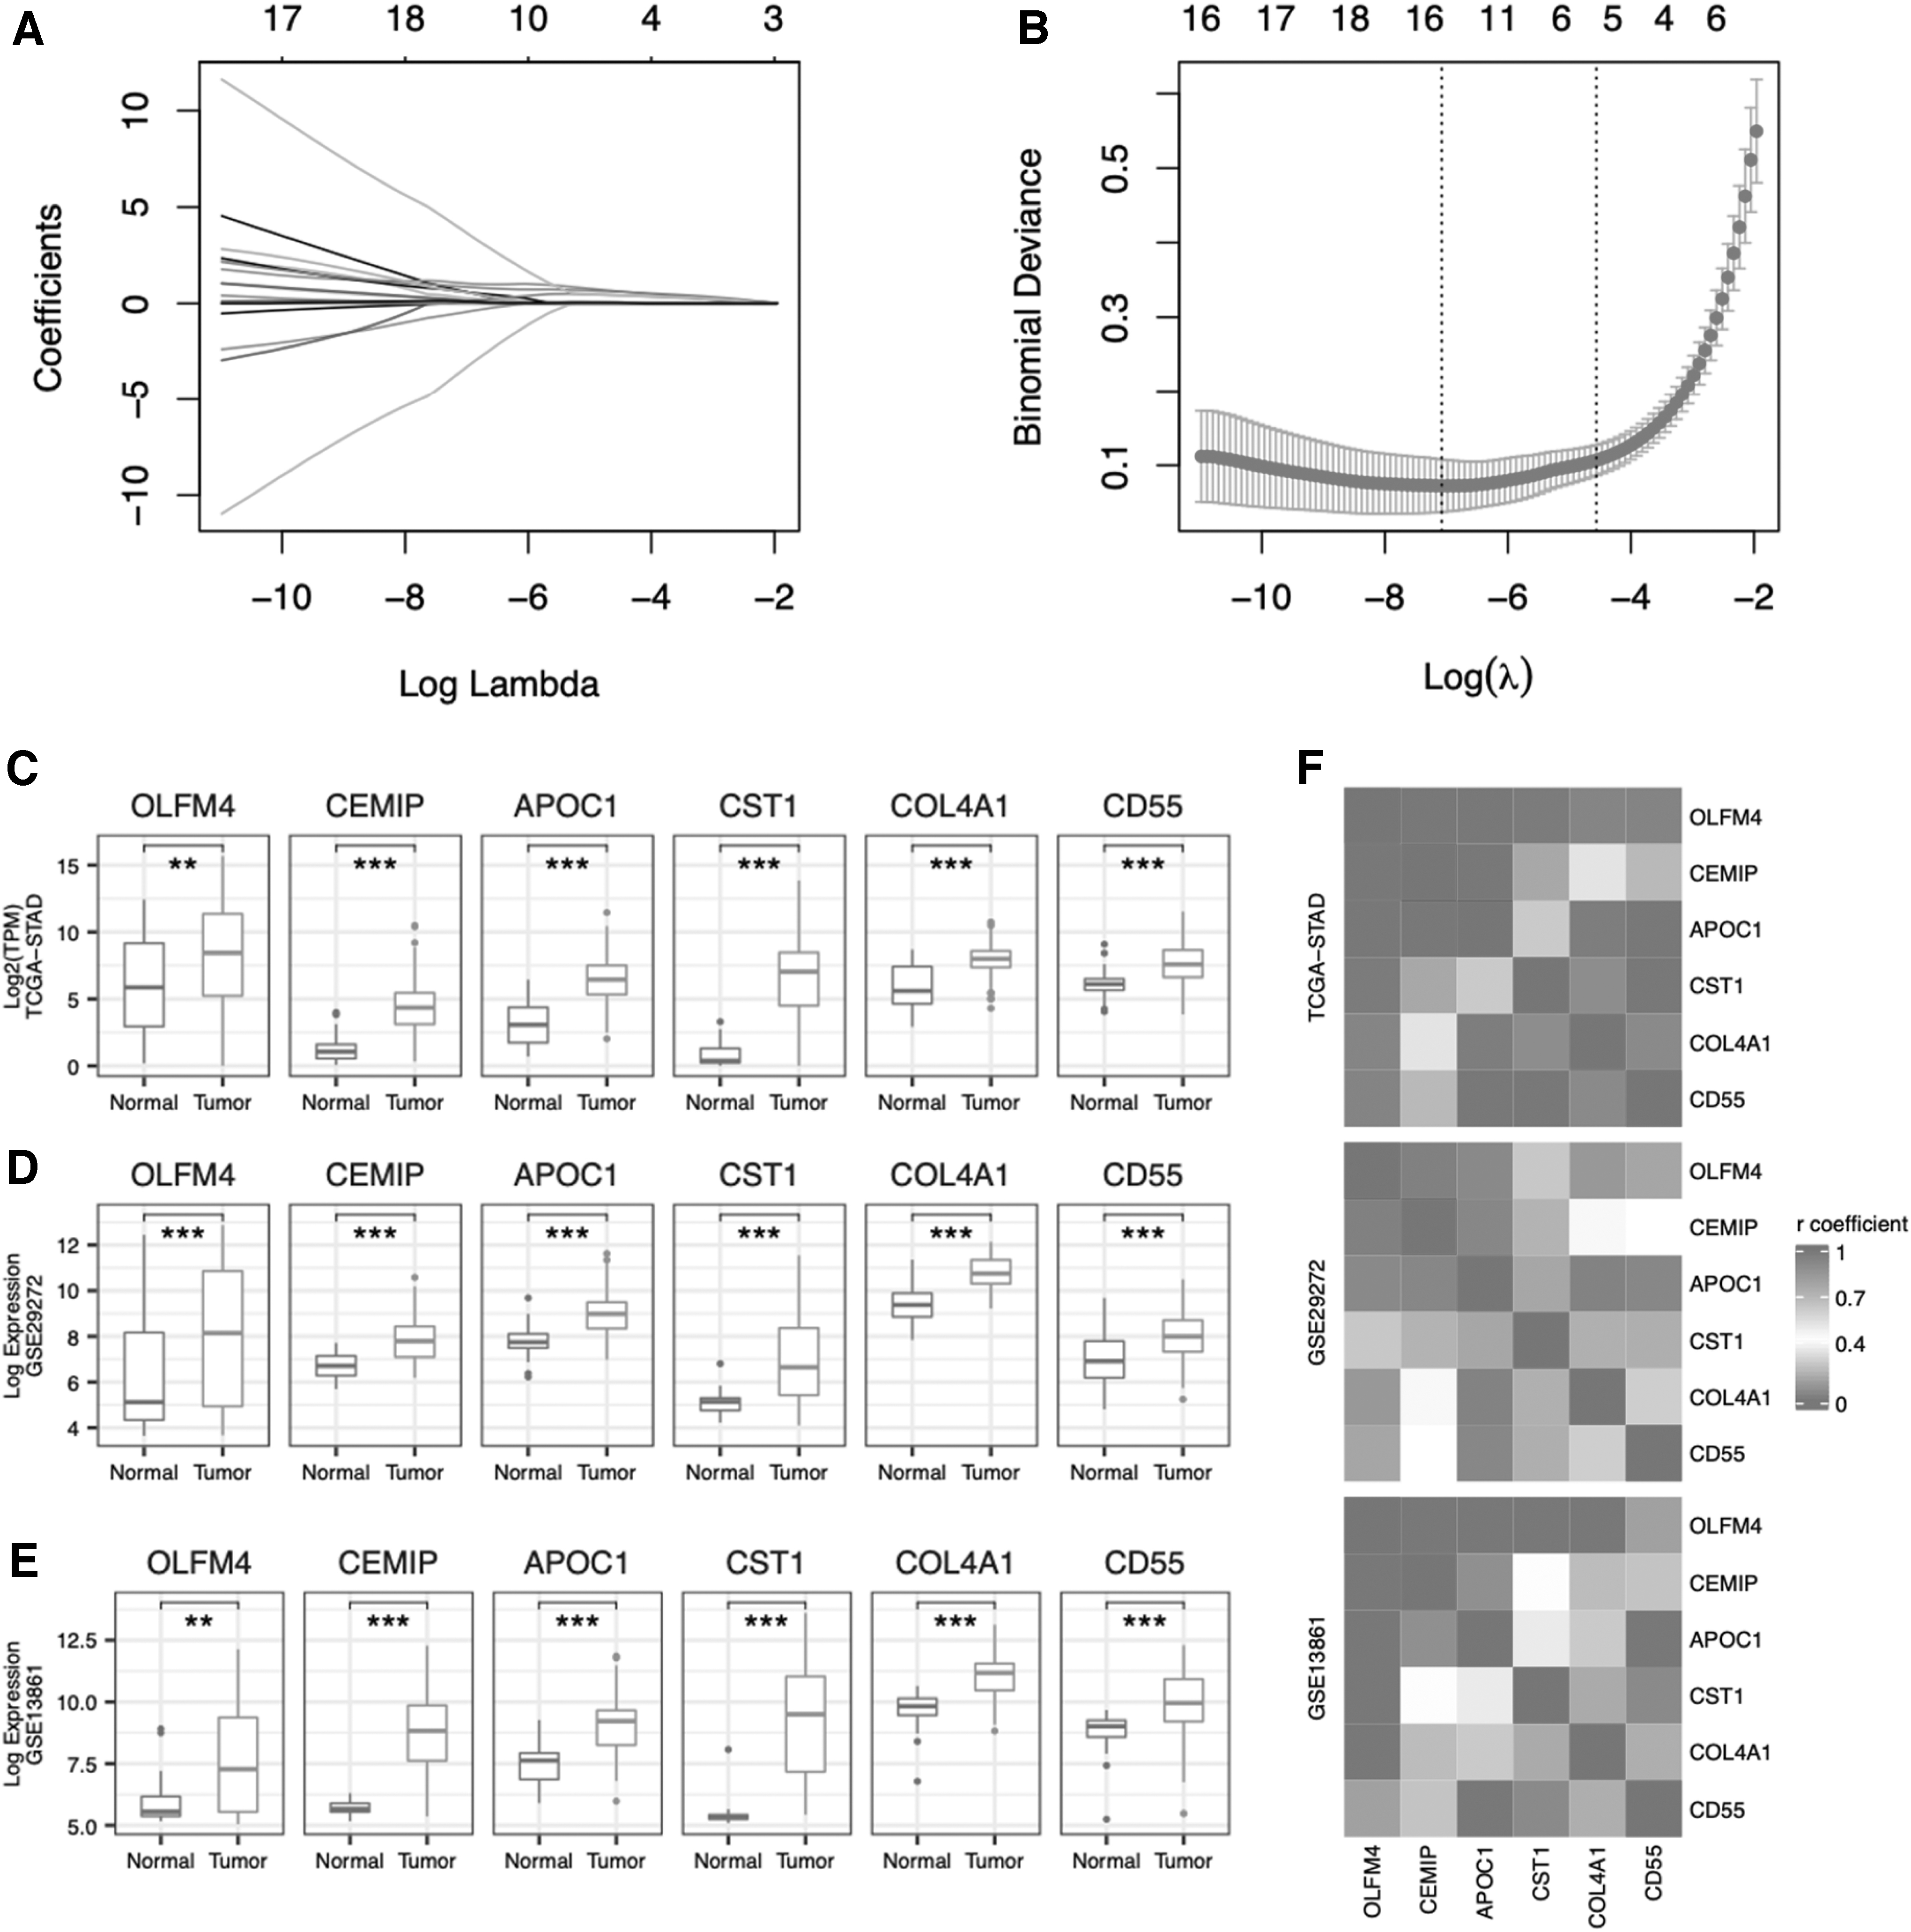
Screening and evaluation of DEGs genes with diagnostic value.
The expression values of these six genes in tumor and normal tissues among the TCGA-STAD, GSE29272, and GSE13861 cohorts are presented in Figure 3C-E. Importantly, we noticed that there were no significant correlations among these six genes in the TCGA-STAD, GSE29272, and GSE13861 cohorts (Fig. 3F). Therefore, these six genes may be used as potential independent diagnostic indexes for gastric cancer patients.
In addition, the enrichment scores of these six genes in tumor and normal tissues in TCGA-STAD, GSE29272, and GSE13861 were analyzed by the ssGSEA methods. The AUC values were 0.978, 0.928, and 0.985 for the diagnostic coefficient of the six genes between tumor and normal tissues in TCGA-STAD, GSE29272, and GSE13861, respectively (Fig. 4A-C). This further demonstrated the diagnostic value of six genes in gastric cancer. The enrichment scores were significantly related to tumor stage in the GSE29272 cohort (Fig. 4D-F).
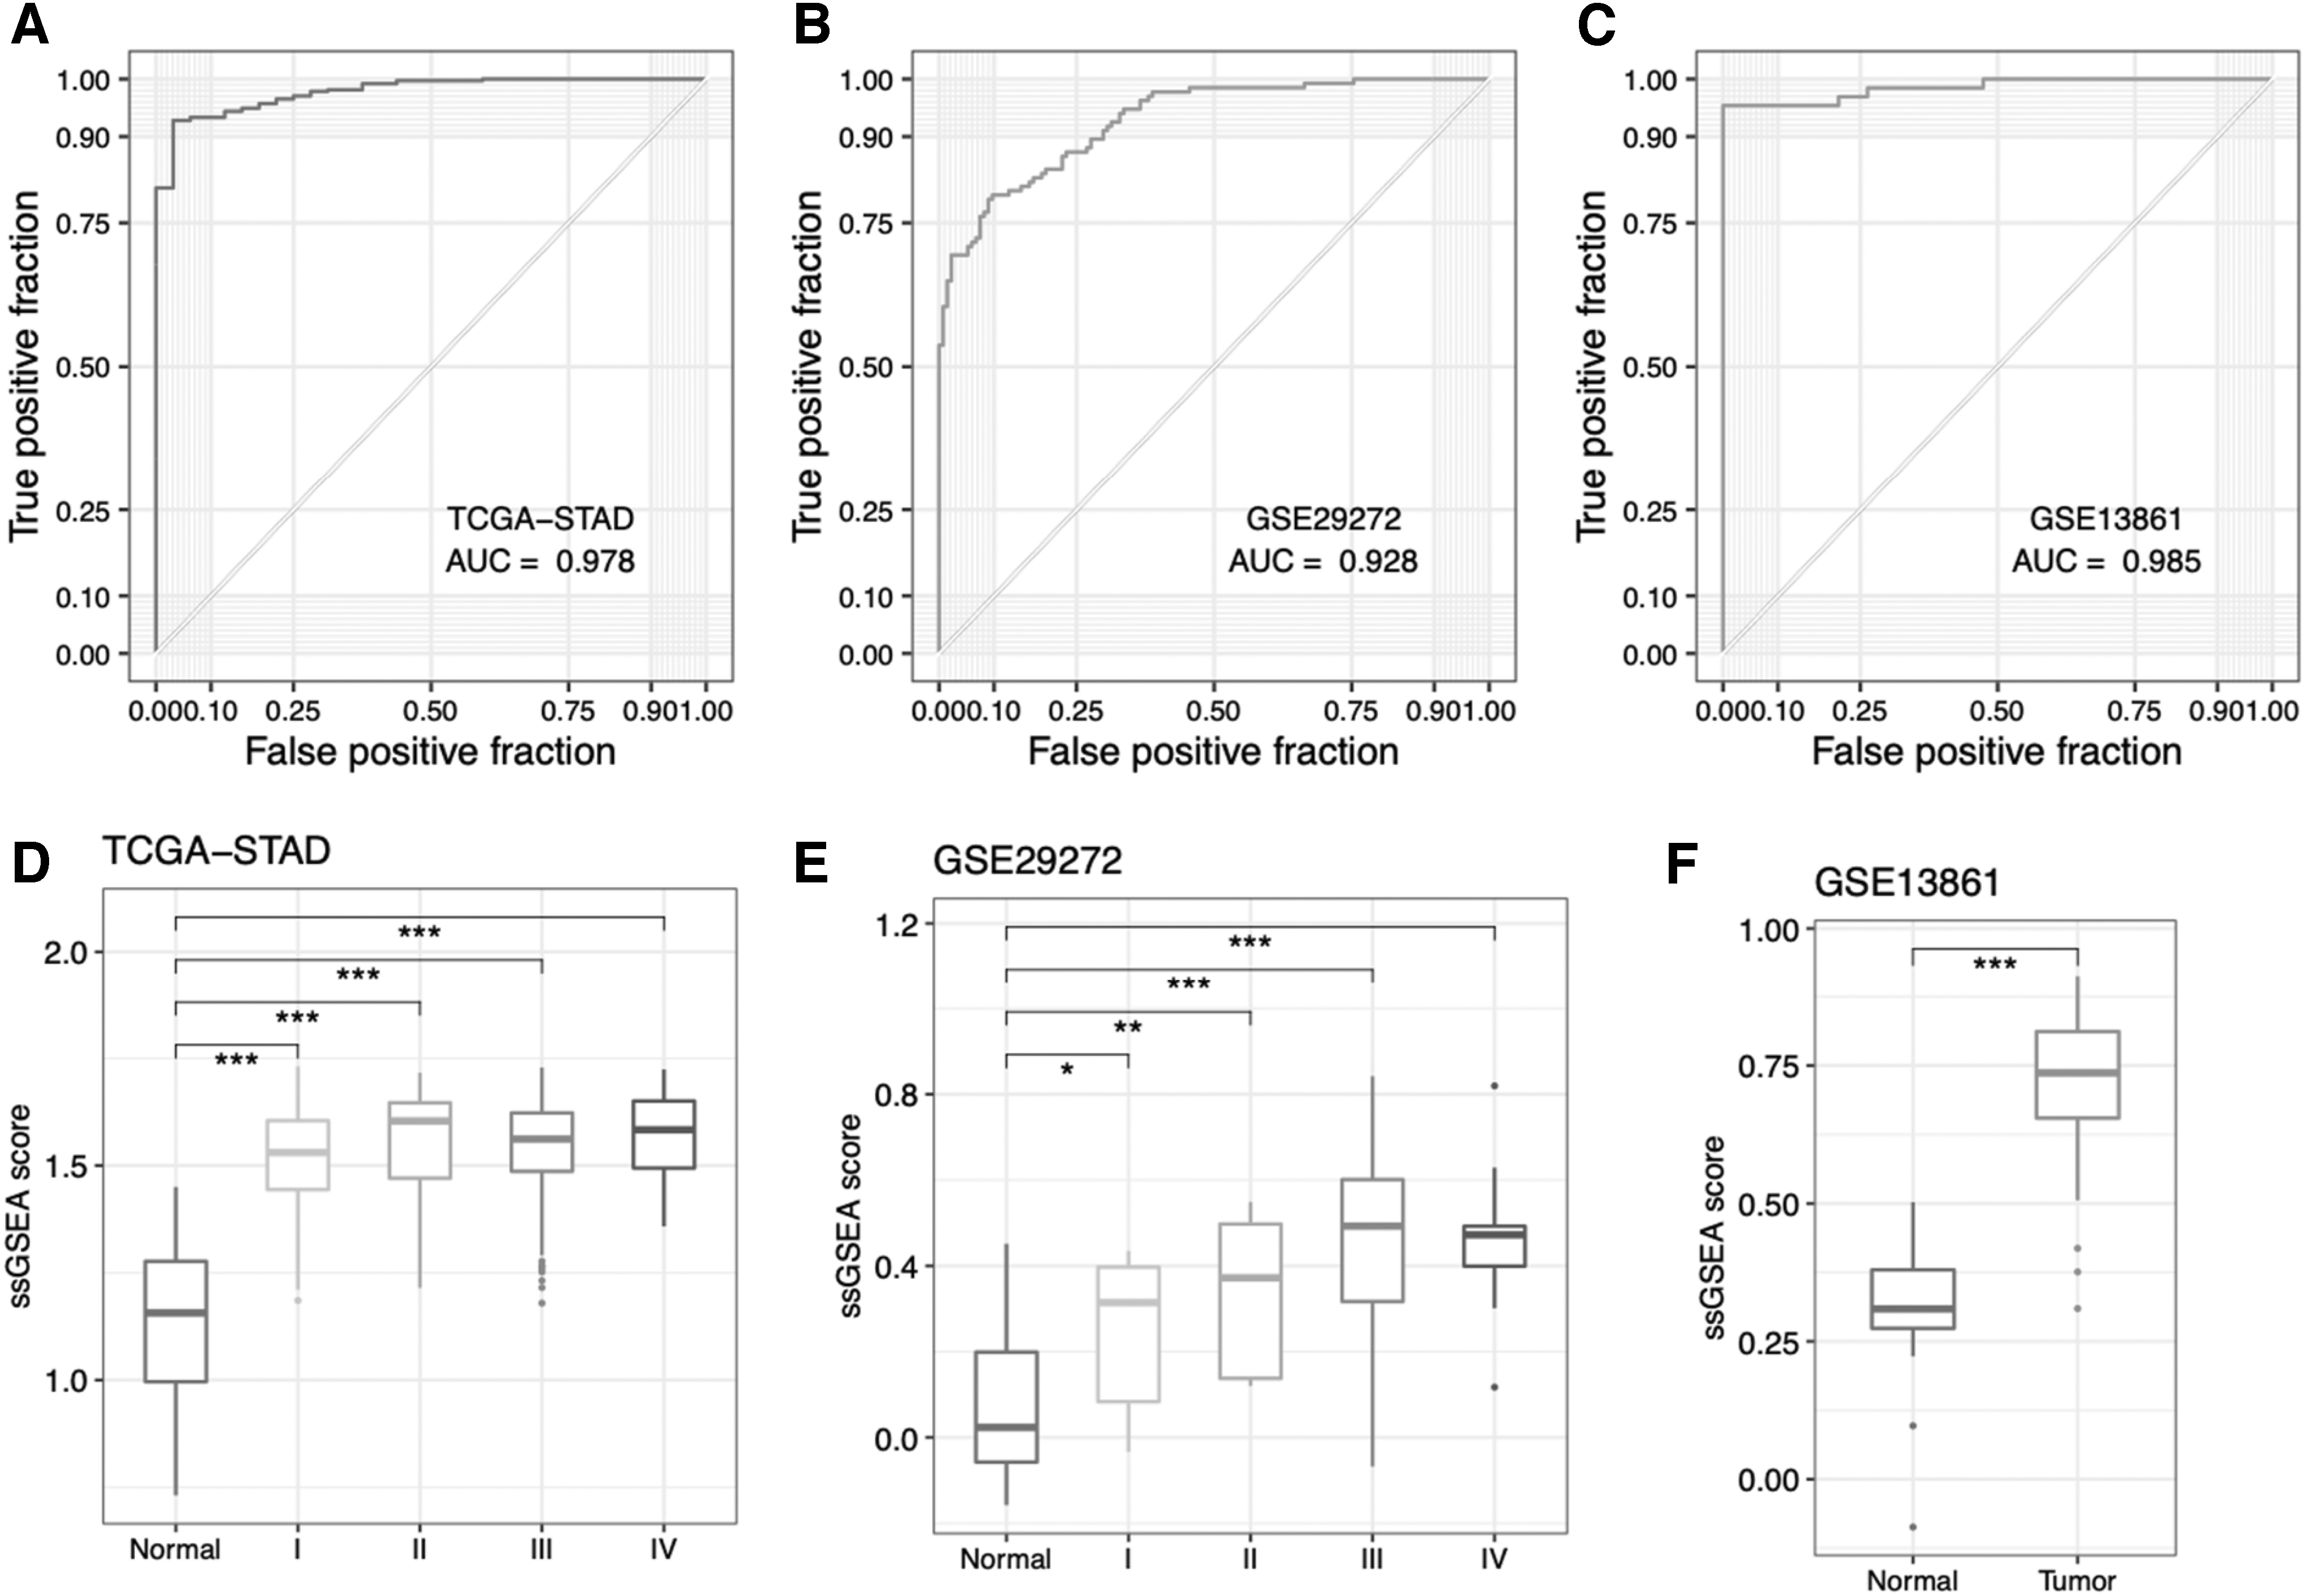
Diagnostic assessment by ROC curves and ssGSEA.
Prognostic meaning of screened DEGs
Another two GEO gastric cancer data sets (GSE62254 and GSE84437) with long-term survival outcomes and TCGA-STAD cohorts were used to analyze the prognostic meaning of those six screened genes (OLFM4, CEMIP, APOC1, CST1, COL4A1, and CD55). By univariate survival analysis, only the expression of COL4A1 was correlated with poor survival outcomes in the three cohorts (Fig. 5A-C). Further analysis of TCGA pancancer data showed that the high expression of COL4A1 was related to poor survival outcomes only in the gastric cancer cohorts (Fig. 5D). Kaplan-Meier survival analysis evaluated the COL4A1 expression group (cutoff by median expression value) and found that high expression of COL4A1 results in poor survival outcomes (Fig. 5E-F).
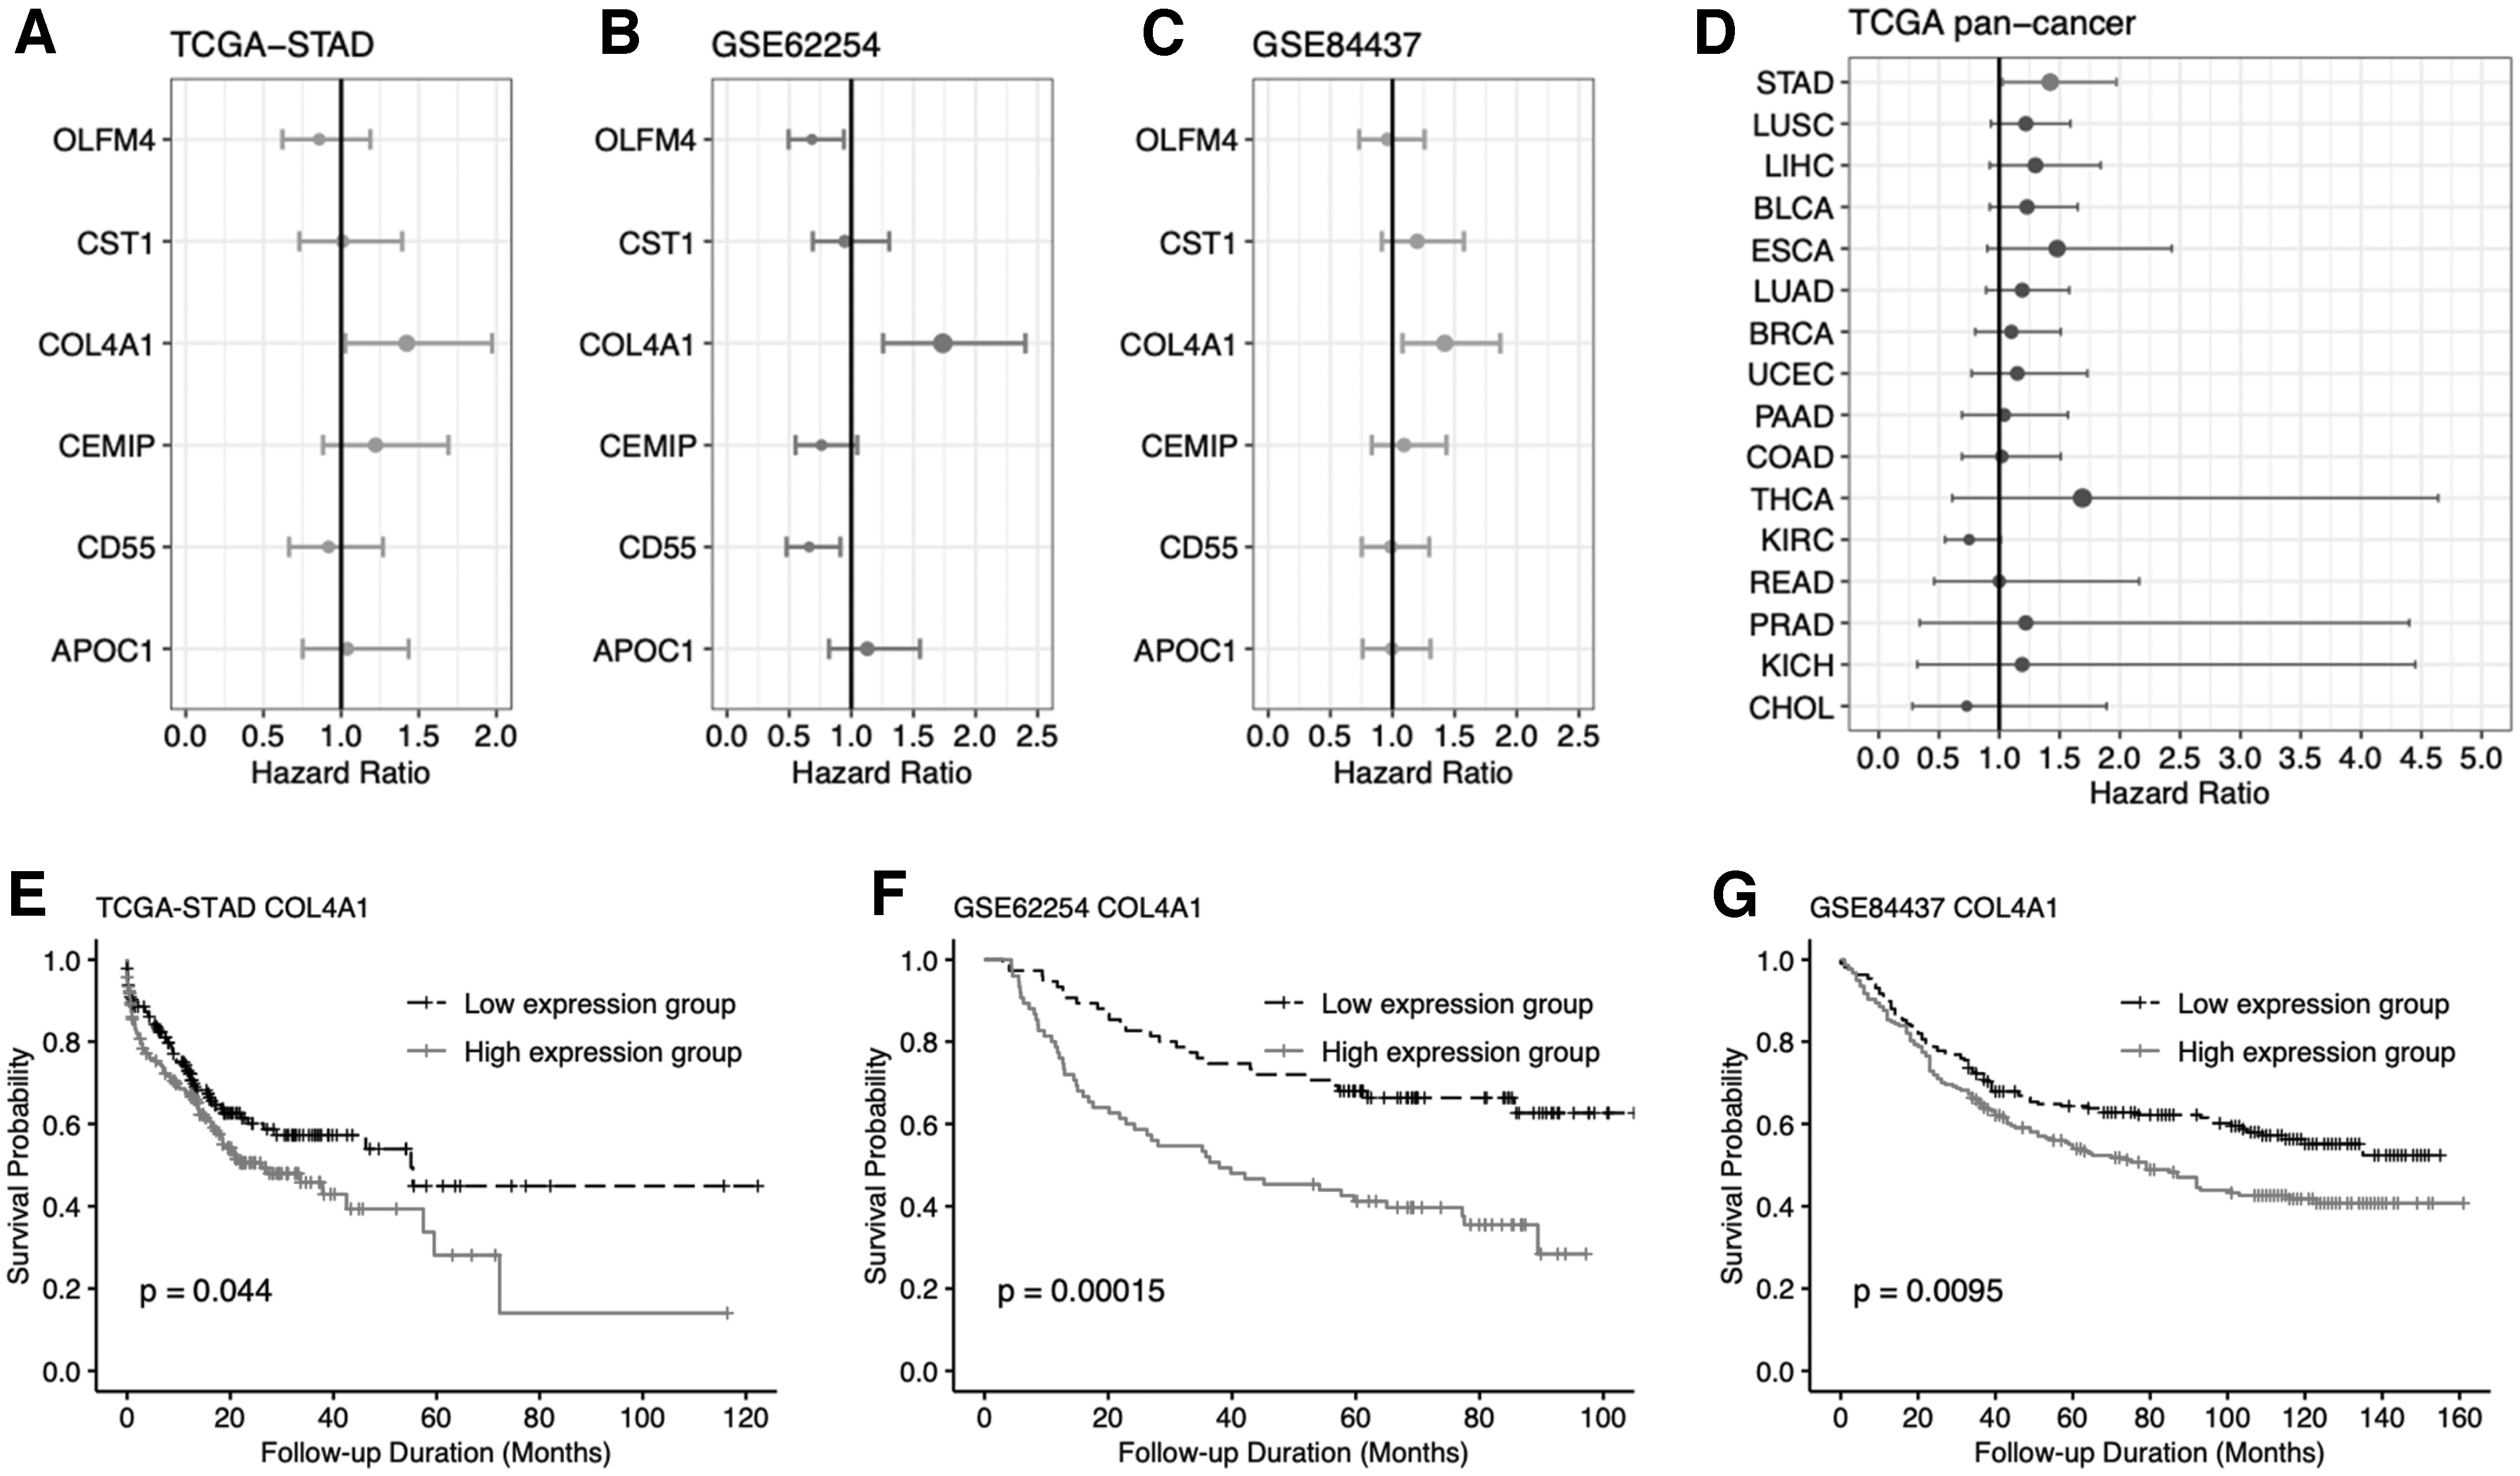
Prognostic meaning of screened DEGs.
Biological function analysis of COL4A1
In the previous analysis, only COL4A1 may have diagnostic and prognostic prediction values. Therefore, we used RNA-seq data from TCGA-STAD cohorts to analyze the biological function of COL4A1. First, we analyzed the expression of COL4A1. In Spearman correlation analysis, with the r value >0.4 and p-value <0.05, we identified COL4A1 correlated upregulated DEGs (Fig. 6A). The GO analysis showed that COL4A1-related DEGs were mainly enriched in connective tissue development, collagen fiber organization-related processes, extracellular structure organization, and ECM organization (Fig. 6B), which play a significant role in connecting and maintaining cell morphology.

Biological function analysis of COL4A1.
The KEGG analysis involved cell proliferation and migration, such as ECM receptor-related pathways, focal adhesion, and PI3K-Akt signaling pathway (Fig. 6C), which are closely related to the occurrence and development of cancer.
TMA validated the clinical significance of COL4A1
We used TMAs of West China Hospital of Sichuan University to verify the protein expression of COL4A1 in gastric cancer tissue array, which included gastric cancer tissues and paracancerous tissues of 340 gastric cancer patients. IHC was used to detect the expression of COL4A1 in gastric cancer and matched paracancerous tissues. The results from IHC showed that COL4A1 was mainly located in the cytoplasm of gastric cancer cells (Fig. 7A-D).
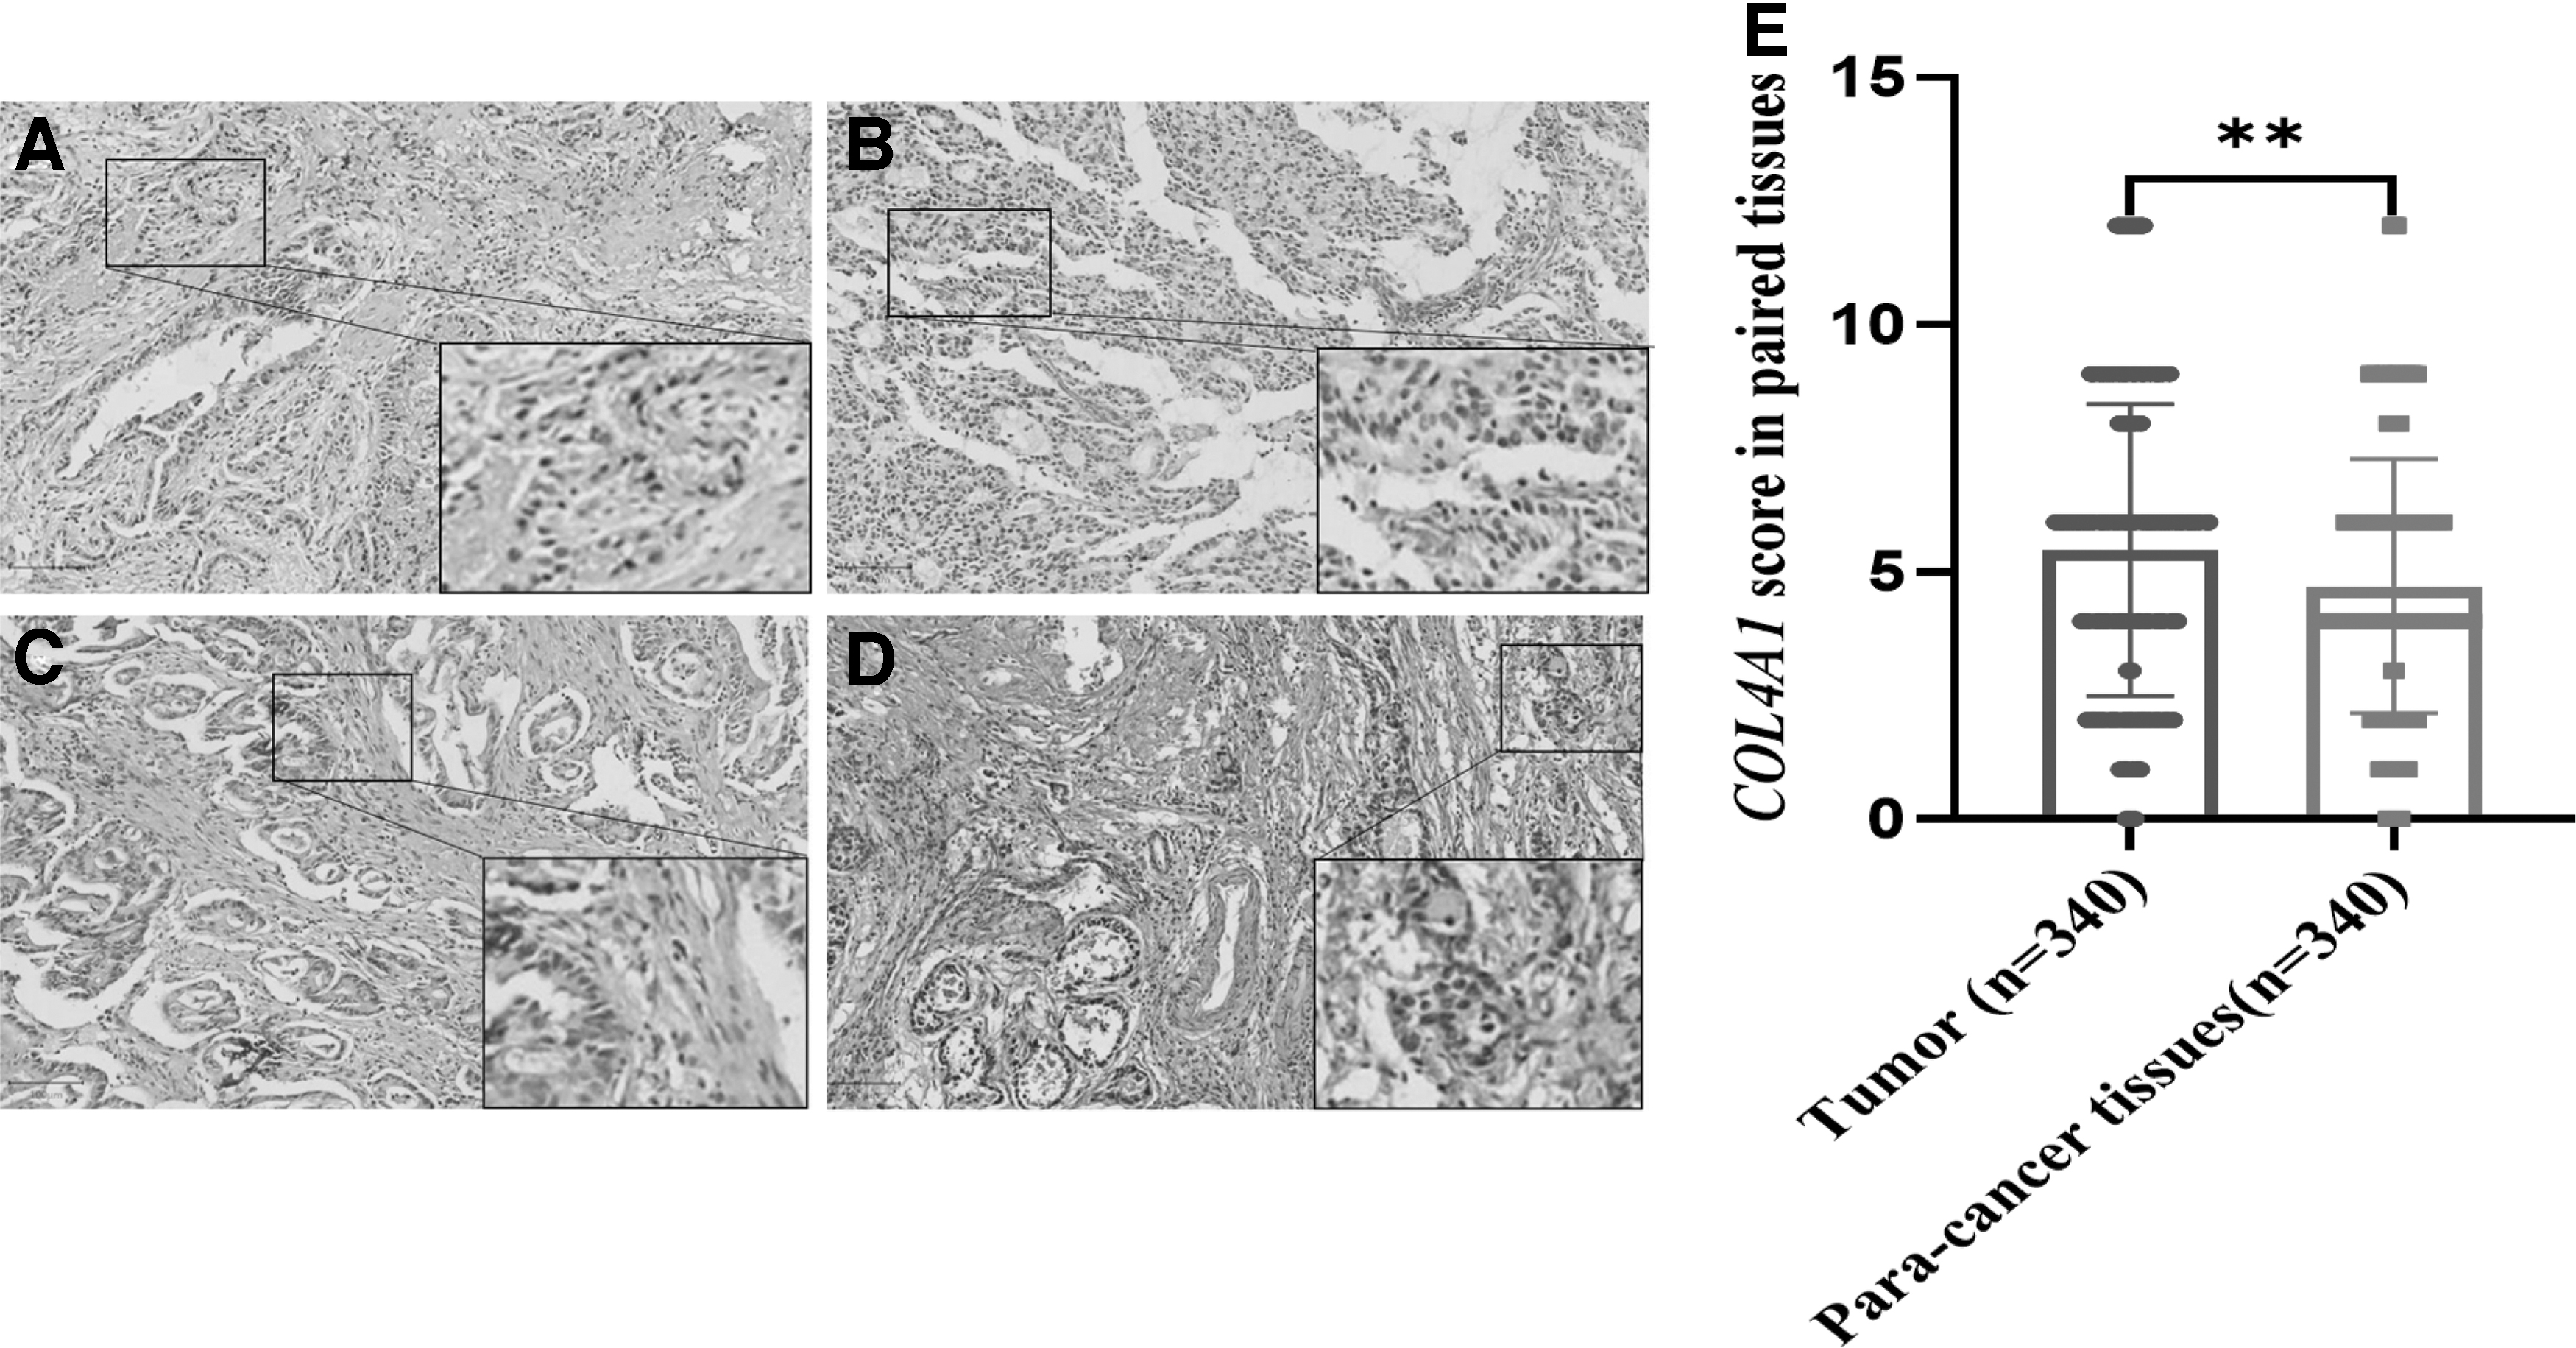
COL4A1 protein expression in tumor tissues and paracancerous tissues.
Compared with that in the matched paracancerous tissues, the expression level of COL4A1 protein in gastric cancer was higher (Fig. 7E), which was consistent with our previous TCGA and GEO data analysis results. This further indicates that COL4A1 may be regarded as a potential gene for gastric cancer patients and provides a basis for future studies.
Discussion
With the rapid development of bioinformatics, new treatments have been introduced, and the survival rate of gastric cancer patients has improved. However, the high heterogeneity of gastric cancer patients improves the difficulty of tumor marker identification. However, considering the poor prognosis of advanced stage gastric cancers, it is important to discover new biomarkers to help with the early diagnosis of patients with gastric cancer. In recent years, genome sequencing has helped us to rapidly and comprehensively characterize tumor information at the molecular level, which provides a reliable way to identify new tumor biomarkers and achieve personalized therapy.
Therefore, we used genome sequencing to identify significant DEGs in gastric cancer and provide a research direction for discovering new biomarkers in gastric cancer patients. Therefore, with the high-throughput sequencing and bioinformatics analysis data, we found 25 upregulated DEGs based on TCGA and GEO data. We further identified six potential diagnostic DEGs (OLFM4, CEMIP, APOC1, CST1, COL4A1, and CD55) for gastric cancer by LASSO regression. Meanwhile, with the clinicopathological data, we found that COL4A1 may be used in diagnosing and prognostically evaluating gastric cancers.
The identification of tumor markers is a hot research topic in gastric cancers. Several recent studies have focused on gastric cancer markers based on TCGA and GEO databases. For example, Zheng et al. (2019) constructed a PPI network using STRING and Cytoscape and speculated that the SERPINH1, NPY, PTGDR, GPER, ADHFE1, and AKR1C1 genes might be potential biomarkers of gastric cancer.
Sun et al. (2021) constructed a PPI network based on the TCGA database and identified eight biomarkers (CCR8, HIST1H3B, HIST1H2AH, HIST1H2AJ, NPY, HIST2H2BF, GNG7, and CCL25) associated with the prognosis of gastric cancer. However, compared with their study, the main feature of our study is to identify the genes related to secreted proteins combined with the secreted gene set, which is helpful for the noninvasive diagnosis of serum levels.
In our analysis, a total of six gene sets (OLFM4, CEMIP, APOC1, CST1, COL4A1, and CD55) were ultimately screened to help predict gastric cancers. Some of these genes have also been well reported in previous studies. Li et al. (2019) reported that OLFM4 was mainly expressed in gastrointestinal tissues and believed that OLFM4 could be used as a candidate biomarker for gastrointestinal cancer. Yi et al. (2019) found that the serum APOC1 concentration in patients with gastric cancer was significantly higher than that in the control group, and increased APOC1 expression was associated with a reduced survival rate in patients with gastric cancer.
Chen et al. (2021) showed that CST1 expression was significantly increased in gastric cancer tissues compared with normal tissues, and gastric cancer patients with high CST1 expression had a poor prognosis. Liu et al. (2005) stated that the expression of CD55 in signet ring gastric cancer cells was significantly higher than that in normal cells, which could be used as a biomarker for the treatment of gastric cancer patients. Our study predicts that OLFM4, APOC1, CD55, and CST1 are significant DEGs in diagnosing gastric cancer patients.
However, we found through univariate analysis that in multiple data sets, only COL4A1 was strongly associated with the prognosis of gastric cancer patients. This is inconsistent with what has been reported in the literature, as gastric cancer is a highly heterogeneous disease, and different samples will have different outcomes. In addition, different analysis methods have other consequences.
Collagen Type IV Alpha 1 (COL4A1) is a member of the collagen family and a vital basement membrane component that interacts with proteoglycans, laminin, and other ECM components (Pollner et al., 1997). Previous studies have shown that COL4A1 plays an indispensable regulatory role in the complex pathological mechanisms of various malignant tumors. For example, COL4A1 is also a potential therapeutic target gene in hepatocellular carcinoma, glioma, and bladder cancer (Jin et al., 2017; Miyake et al., 2017; Wang et al., 2020a, 2020b). However, few studies have focused on the association of COL4A1 with gastric cancer.
Our study not only identified the expression difference between tumor and normal tissues of gastric cancer patients but also found that the expression of COL4A1 was significantly correlated with the overall survival rate of gastric cancer patients, and patients with high COL4A1 expression had a worse prognosis than those with low COL4A1 expression. Furthermore, based on TMAs from 340 patients, we demonstrated that the expression of COL4A1 protein in gastric cancer tissues was significantly higher than that in paracancerous tissues. Therefore, we believe that COL4A1 may be a potential diagnostic and prognostic indicator for gastric cancer patients.
Our study also has some limitations. First, our study is based on RNA-seq data using bioinformatics methods, and further validation in the clinic is expected. Second, different sequencing platforms from the five cohorts used in our study may impact the results. Third, COL4A1 is a promising gene for gastric cancers in our analysis, and the clinical application of COL4A1 needs to be validated in large sample clinical data in both tissue and serum samples. Despite these limitations, our study provided several potential secretory molecules through bioinformatics screening, which may help the noninvasive diagnosis of gastric cancers.
Conclusion
Combining transcriptome expression data with gene sets of secretory bank proteins, it can be used to screen significant tumor DEGs. In our study, we screened several (OLFM4, CEMIP, APOC1, CST1, COL4A1, and CD55) potential DEGs for the diagnosis of gastric cancer, among which COL4A1 may play an important role in the diagnosis and prognostic evaluation of gastric cancer.
Footnotes
Acknowledgment
The authors thank Prof. Heng Xu for his help during the study.
Authors' Contribution
M.W. drafted the initial article; M.W. and X.J. analyzed the data; M.W., S.X., and Y.D. interpreted the results; Y.D., T.C., Y.C., and W.Z. contributed to the literature search and bioinformatic analysis; and L.Z. and J.H. conceived the idea of the study and edited the article. All authors read and approved the final article.
Author Disclosure Statement
The authors have declared that no competing interest exists.
Funding Information
This study was supported by grants from Sichuan Science and Technology Program (Grant No. 2020JDRC0053) and Fundamental Research Funds for the Central Universities (Grant No. 2682022ZTPY032).

References
Supplementary Material
Please find the following supplemental material available below.
For Open Access articles published under a Creative Commons License, all supplemental material carries the same license as the article it is associated with.
For non-Open Access articles published, all supplemental material carries a non-exclusive license, and permission requests for re-use of supplemental material or any part of supplemental material shall be sent directly to the copyright owner as specified in the copyright notice associated with the article.
