




Abstract
Background:
Breast cancer is a heterogeneous disease. Small tumors with extensive lymph node involvement (STEL) in breast cancer often reflect a biologically aggressive phenotype and poor prognosis. The aim of this study was to identify key genes associated with STEL and investigate their prognostic values in breast cancer.
Methods:
RNA sequence data from breast cancer specimens were acquired from The Cancer Genome Atlas (TCGA) database for differential analysis. Weighted gene correlation network analyses (WGCNA) were performed to identify coexpressed gene modules associated with tumor size and lymph node metastases. Gene set enrichment analysis (GSEA) was employed to investigate the biological functions of the identified genes. A combination of LASSO and Cox regression analyses was conducted to establish a risk predictive signature, and time-dependent receiver operating characteristic (tdROC) and Kaplan—Meier analyses were used to evaluate its prediction precision. Quantitative RT-PCR was employed to validate the expression levels of the key genes from the signature set.
Results:
A total of 2777 genes from three coexpressed gene modules were identified by WGCNA, and 880 differentially expressed genes were identified by transcriptome analyses. The 63 overlapping genes identified by both methods were considered STEL-associated genes, and a 9-gene risk-predictive signature was established based on them, with AUCs at 3, 5, and 7 years reaching 0.810, 0.811, and 0.753, respectively.
Conclusion:
This study demonstrated the transcriptomic profile of STEL breast cancer and successfully established a risk predictive signature with satisfactory accuracy. These findings may provide insights in to the genetic etiology of breast cancer.
Introduction
Breast cancer is one of most common malignancies and the most serious threat to women's health worldwide (Siegel et al., 2021). Although the mortality of breast cancer is decreasing due to improvements in diagnostic and therapeutic methods, its morbidity continues to increase each year; thus, breast cancer remains a leading cause of cancer-associated death in women (Allemani et al., 2018; Cardoso et al., 2018). Breast cancer is widely recognized as a heterogeneous disease, and the prognosis varies greatly among patients (Brenton et al., 2005); therefore, metastasis and outcomes of breast cancer are difficult to predict.
To date, many efforts have been devoted to the identification of prognostic factors for breast cancer. Several indicators have been well established to be associated with breast cancer-specific mortality (BCSM), including local tumor size, degree of axillary lymph node (LN) involvement, histological grade, lymphovascular invasion (LVI), and hormone receptor and HER2 status (Perou et al., 2000; Schoppmann et al., 2004; Goldhirsch et al., 2005). Of these, local tumor size and regional LN status are two of the most important prognostic determinants and constitute the American Joint Committee on Cancer (AJCC) staging system (Singletary et al., 2002), along with the presence of distant metastases.
In most cases, increasing tumor size is closely associated with a high risk of regional LN involvement (Gajdos et al., 1999); however, the relationships between these two determinants are not always linear. Accumulating evidence has revealed that the acquisition of metastatic potential and distant spread may occur during the early stage of cancer development (Husemann et al., 2008; Wo et al., 2011). In the context of extensive LN involvement, a small tumor size is paradoxically a surrogate for aggressive biological disease and poor prognosis (Wo et al., 2011; Ryu et al., 2016). Conversely, large tumors (e.g., ≥5 cm) that fail to metastasize to regional LNs may reflect a biologically indolent phenotype and thus can be associated with a relatively lower risk of distant spread and BCSM (Yu et al., 2012).
It could reasonably be inferred that the gene expression profiles of the two distinct types of breast cancer may differ considerably. The differentially expressed genes (DEGs) may play pivotal roles in the acquisition of biologically aggressive phenotypes and ultimately contribute to tumor development and metastasis in breast cancer. However, few studies have focused on transcriptome analysis between small tumor with extensive LN involvement (STEL), and large tumor with negative LN count (LTNL) breast cancers. Therefore, we carried out this study and performed a series of bioinformatics analyses to identify STEL-associated genes and investigate their prognostic values in breast cancer.
Materials and Methods
Data acquisition, processing, and differential expression analysis
The RNA-seq data and corresponding clinical information of STEL and LTNL breast cancer samples from The Cancer Genome Atlas (TCGA) database were downloaded from the GDC (Genomic Data Commons) Data Portal (URL: https://portal.gdc.cancer.gov/). A total of 24 STEL and 47 LTNL breast cancer samples from TCGA database were included in this study, and the clinicopathological characteristics of the patients are shown in Table 1. All the patients involved in this study were primarily diagnosed by surgery or biopsy, with no neoadjuvant treatment. STEL and LTNL were defined by the patients' T and N stage.
Characteristics of Patients from The Cancer Genome Atlas Database
ER, estrogen receptor; HER2, human epidermal growth factor receptor 2; IDC, infiltrating ductal carcinoma; ILC, infiltrating lobular carcinoma; LNM, lymph node metastasis; PR, progesterone receptor; SD, standard deviation; STEL, small tumor with extensive lymph node involvement.
Specifically, patients with pathological T0 ∼ 1, N2 ∼ 3, and M0 were considered to have STELs, while patients with pT3N0M0 or pT4N0M0 were considered to have LTNLs. Inflammatory breast cancer samples were excluded. The raw count values of RNA-seq data were converted to transcripts per million (TPM) values for normalization, and the missing values were imputed by the K-nearest neighbor (KNN) imputation procedure. Differential expression analysis was conducted by the R package DESeq2 (Love et al., 2014). We used absolute log2-fold change (FC) and the false discovery rate (FDR) as evaluation indicators for DEGs, and |log2FC| > 1 and FDR <0.05 were set as cutoff criteria for DEGs.
Weighted gene correlation network analysis
To explore the roles of STEL-associated genes in breast cancer, we performed a multistep bioinformatic analysis, and the design of this study is briefly shown as a flowchart in Figure 1. First, a gene coexpression network was constructed by conducting weighted gene correlation network analysis (WGCNA) on 24 STEL and 47 LTNL breast cancer samples. The whole set of coding and noncoding genes with at least one transcript was involved in this analysis. A scale-free network was built by using the R package WGCNA (Langfelder and Horvath, 2008) for coexpression gene module identification. A hierarchical clustering analysis was performed to show the adjacency between different module eigengenes (MEs).

Flowchart of the study design and analysis.
Moreover, the correlations between LN metastasis, tumor size, and MEs were calculated with a Pearson correlation analysis, and MEs with absolute coefficient r > 0.3 and p-value <0.05 were considered key modules associated with STEL. Finally, the overlapping genes from both key modules and DEGs were considered STEL-associated genes.
Gene set enrichment analysis
Gene set enrichment analysis (GSEA) was used to further investigate the biofunctions and signaling pathways associated with STEL. The R package clusterProfiler (Wu et al., 2021) was used to conduct this analysis. Gene Ontology (GO) and Kyoto Encyclopedia of Genes and Genomes (KEGG) gene set information was acquired from the Molecular Signatures Database (MSigDB). All genes involved in GSEA were reordered by their log2FC according to the differential expression analysis. Thresholds of absolute normalized enrichment score (NES) >1 and FDR <0.05 were used to identify significantly enriched GO terms and KEGG pathways.
Training and testing of the risk predictive model
To further investigate the prognostic values of the identified STEL-associated genes in breast cancer, we performed a combination of least absolute shrinkage and selection operator (LASSO) and Cox regression analyses. The vital status and survival time information of the patients were acquired from TCGA database, and samples with incomplete clinical information were removed from the cohort. Subsequently, the whole set of breast cancer patients (n = 681) was randomly divided into two subsets for risk model training (n = 341) and validation (n = 340).
To narrow the range of the target genes, LASSO regression was conducted by using the R package glmnet, and the penalty parameter lambda (λ) was automatically determined by machine learning. Thereafter, multivariate Cox regression analysis was performed for risk predictive signature identification. A formula was established for risk score calculation: Risk score =
Clinical sample collection and quantitative real-time PCR
Clinical samples of 35 patients, including 16 STELs and 19 LTNLs, were collected from patients who were primarily diagnosed between 2019 and 2021 at the Affiliated Hospital of Jiangnan University. Specimens were kept in the gas phase of liquid nitrogen immediately after surgery or biopsy. Total RNA was extracted from the specimens by using the E.Z.N.A. Total RNA Kit I (Omega) following the manufacturer's protocol. Reverse transcription PCR was performed to synthesize complementary DNA by using the Prime Script RT Reagent Kit (Takara Bio, Japan). Real-time PCR was performed on a CFX96 Touch Real-Time PCR Detection System (Bio-Rad) to measure the relative expression levels of the target genes using the comparative Ct method. Glyceraldehyde-3-phosphate dehydrogenase (GAPDH) was used as a normalization control.
The sequences of the primers are shown in Supplementary Table S1. Each patient enrolled in this study signed an informed consent form, and this study was approved by the Ethics Committee of the hospital.
Statistics
Kaplan‒Meier analysis was used to evaluate the overall survival (OS) of different groups of patients. Univariate and multivariate Cox regression analyses were performed to identify prognostic factors among the clinicopathological features. The significance of differences between gene expression levels obtained from qRT-PCR was assessed by one-way analysis of variance. All statistical analyses were conducted in R software (R version 4.1.2), and a p-value (or adjusted p-value) <0.05 was considered to be statistically significant.
Results
Identification of STEL-associated genes
WGCNA and differential expression analysis were used to identify genes associated with STEL. The whole sets of 19213 protein-coding and 20730 noncoding genes were included in the analyses. To construct a scale-free gene network, the soft threshold was selected as 6 according to Figure 2A. The result of hierarchical clustering analysis is shown as a dendrogram (Fig. 2B). A total of 47 coexpression gene modules were identified, and the adjacency between different modules is shown in Figure 2C. Furthermore, Pearson correlation analysis was conducted to evaluate the associations between gene modules and clinical traits, including tumor size and lymph node metastasis (LNM). Three gene modules, MEdarkgrey (n = 568), MEdarkgreen (n = 600), and MEbrown (n = 1609), were ultimately identified, with a significant positive correlation with LNM and a negative correlation with tumor size (Fig. 2D). Thus, genes from these three modules were considered to be associated with STEL.
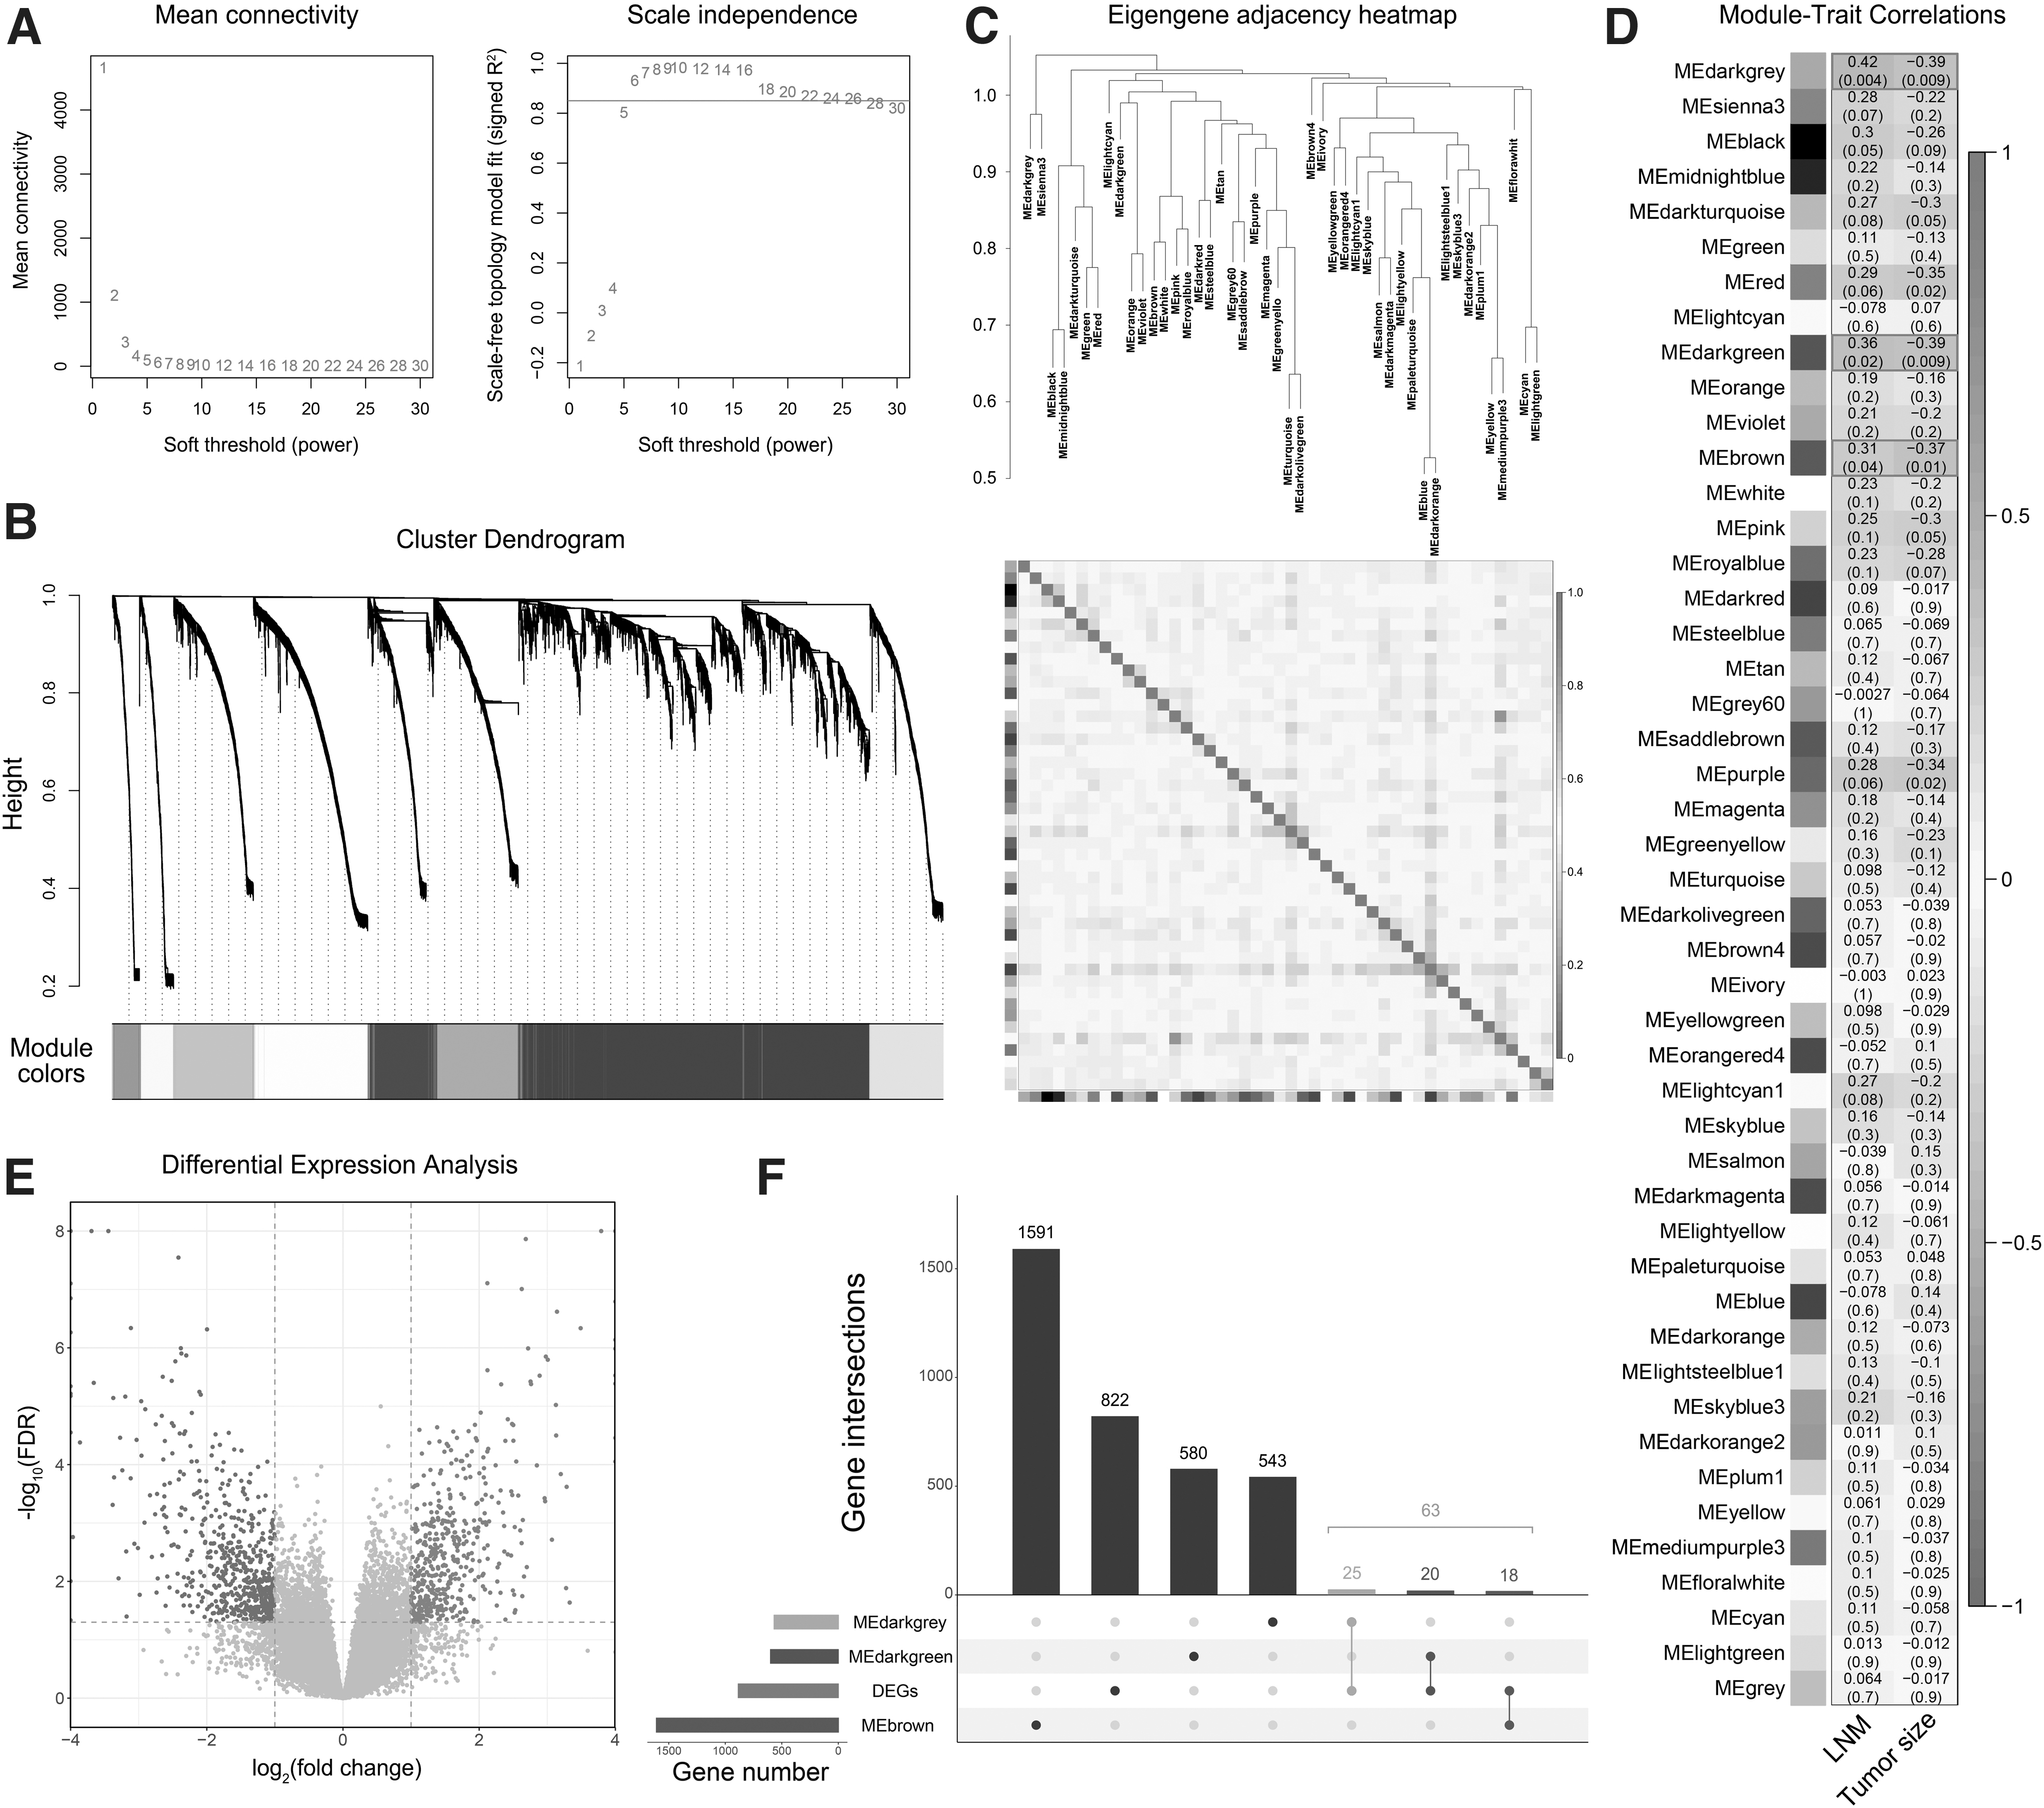
Identification of STEL-associated genes by WGCNA and differential expression analysis.
Differential expression analysis was subsequently carried out to identify DEGs between STEL and LTNL breast cancer samples. According to the criteria mentioned above, 885 DEGs were identified, including 367 upregulated and 518 downregulated genes (Fig. 2E). A total of 63 overlapping genes between the identified coexpression gene modules and DEGs were considered STEL-associated genes (Fig. 2F) and were further used for functional enrichment and prognostic analyses. In addition, the expression levels of the 63 identified genes in different clinicopathological groups are presented in a heatmap (Fig. 3).
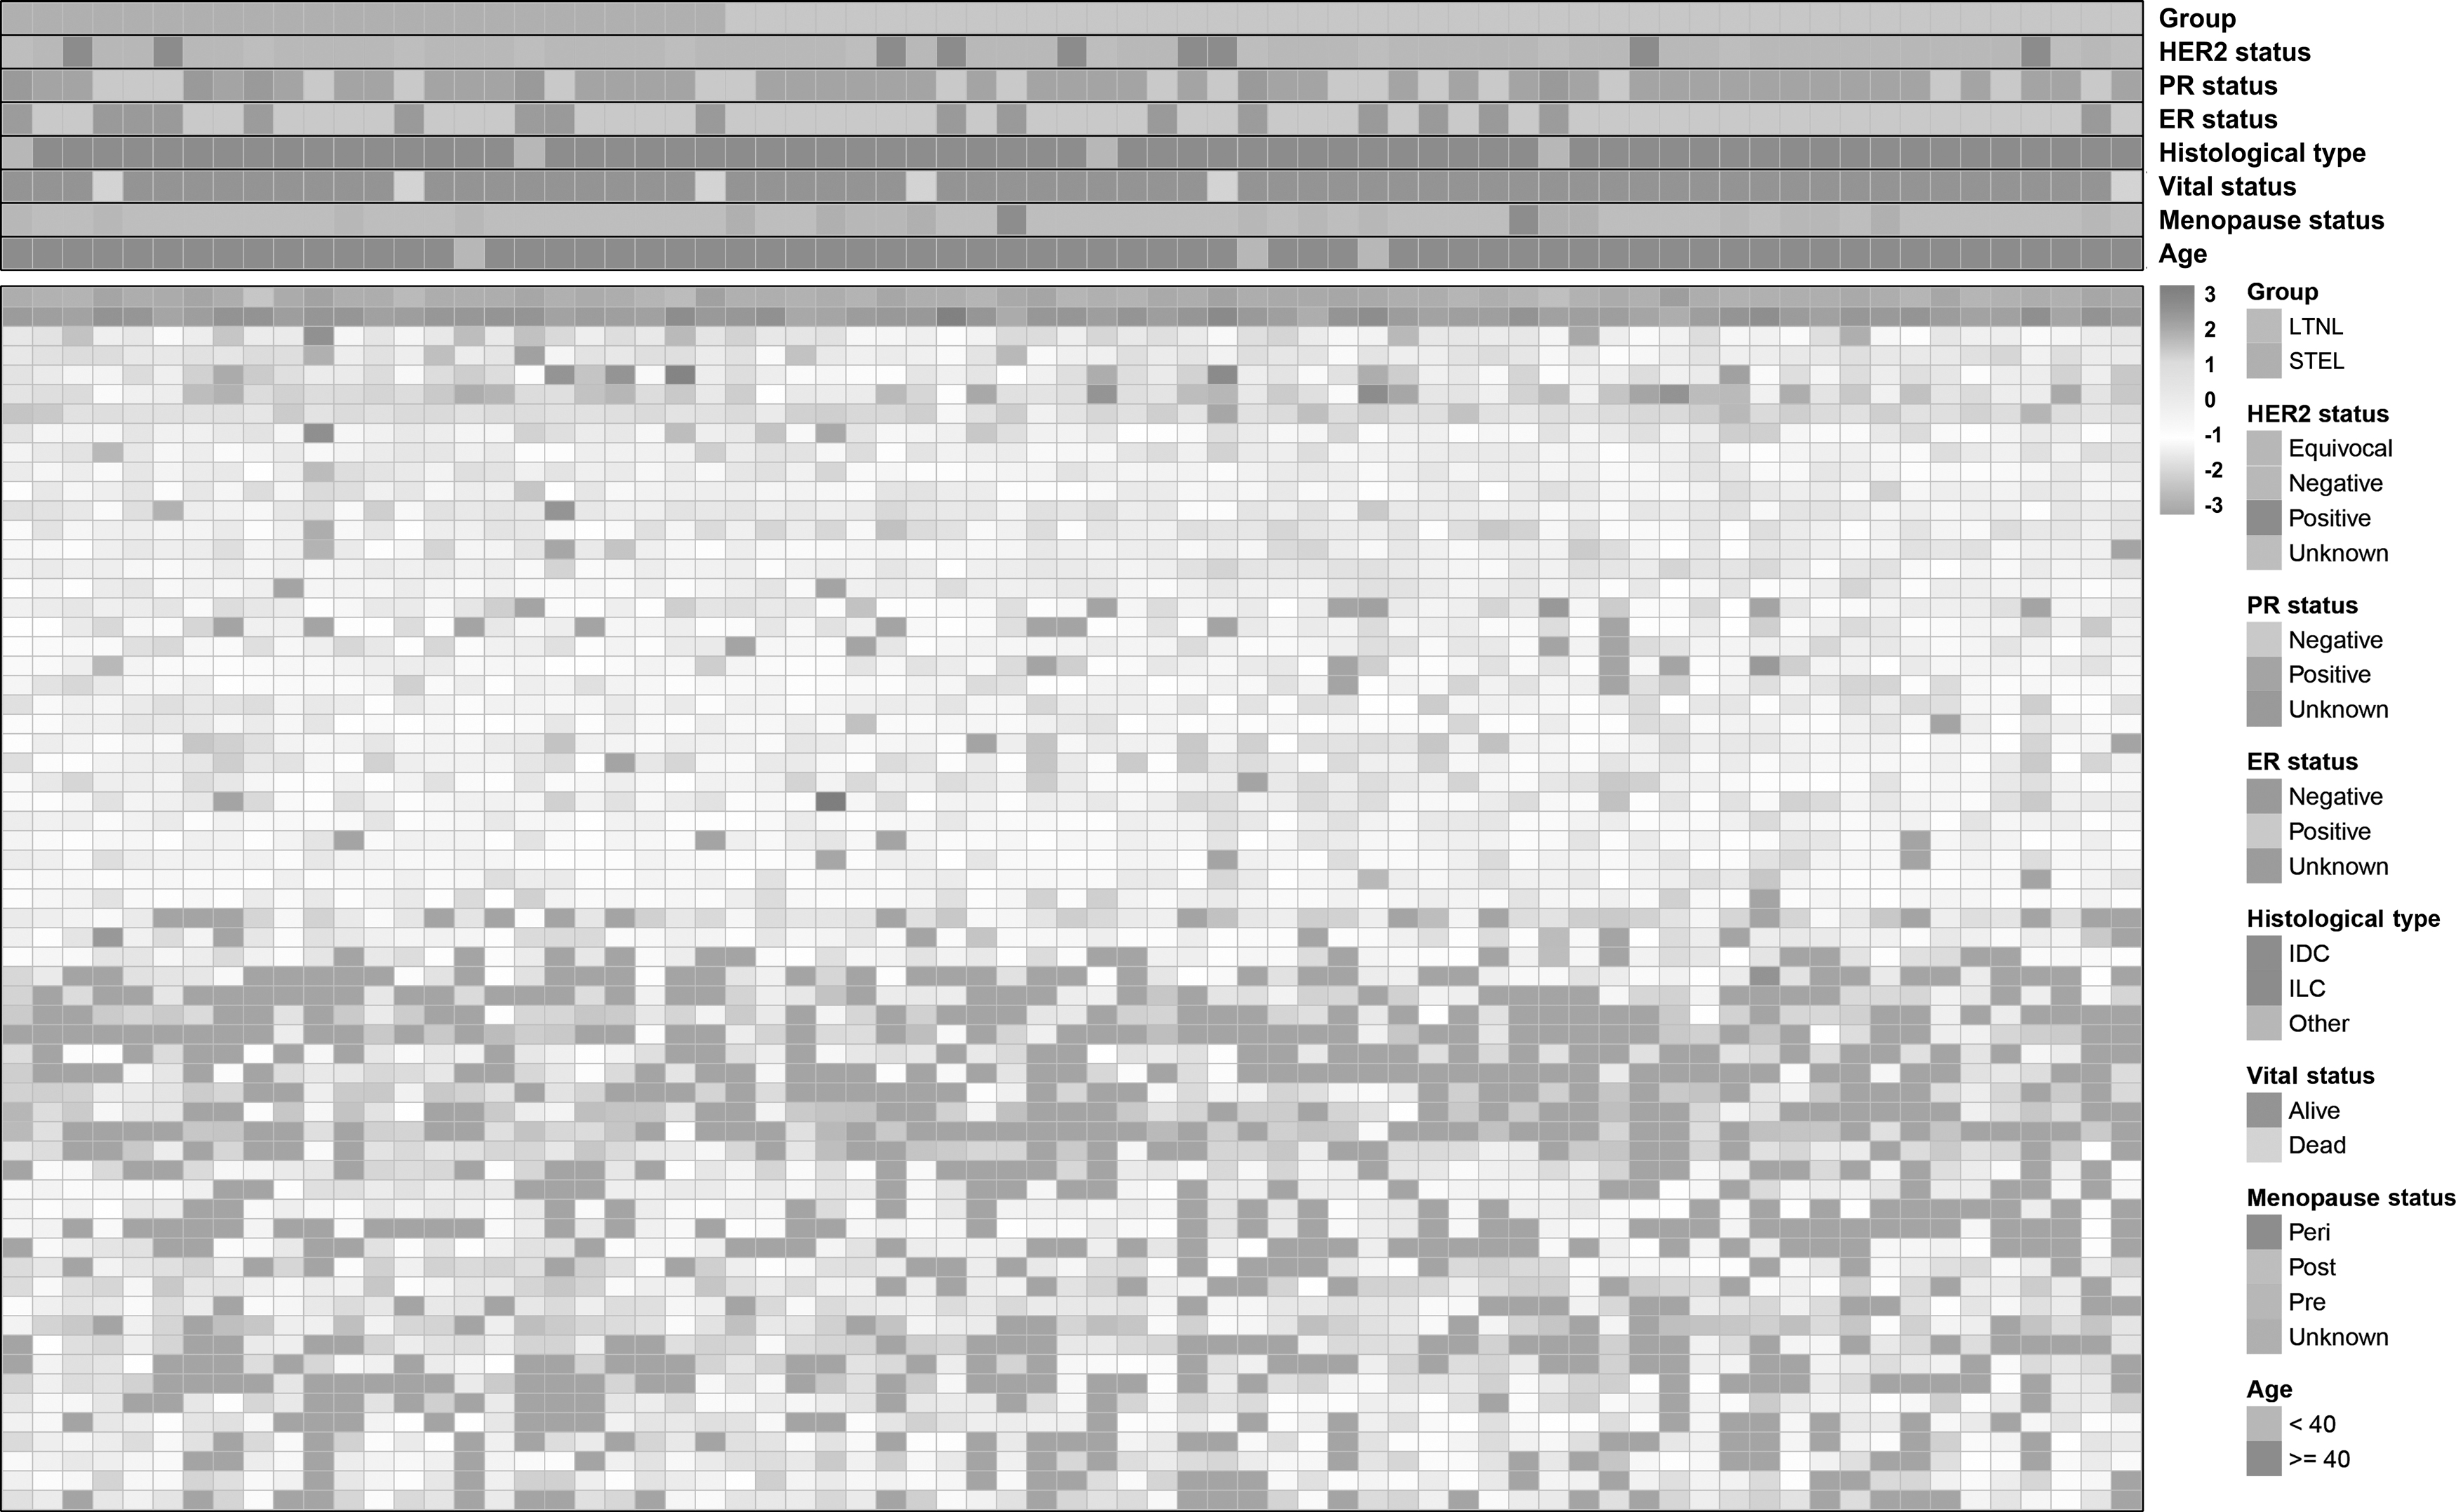
Heatmap of the STEL-associated gene expression in TCGA breast cancer samples. TCGA, The Cancer Genome Atlas.
Functional and pathway enrichment analyses
To characterize the functional roles of the STEL-associated genes, GSEA was conducted for enrichment analysis. According to the results, multiple terms and pathways associated with cell adhesion, immune response, and tumorigenesis were significantly enriched (Fig. 4A, B). The running enrichment score curves of representative GO terms and KEGG pathways are shown in Figure 4C and D, respectively. For GO terms under the biological process (BP) category, regulation of cell adhesion (NES = −1.669), mammary gland development (NES = −1.799), and activation of immune response (NES = −1.500) were included in the top significant terms, and the P53 signaling pathway of KEGG (NES = −1.660) was also significantly enriched. These terms and pathways were all negatively correlated with STEL-associated genes, indicating the pivotal roles of these genes in breast cancer tumorigenesis and metastasis.
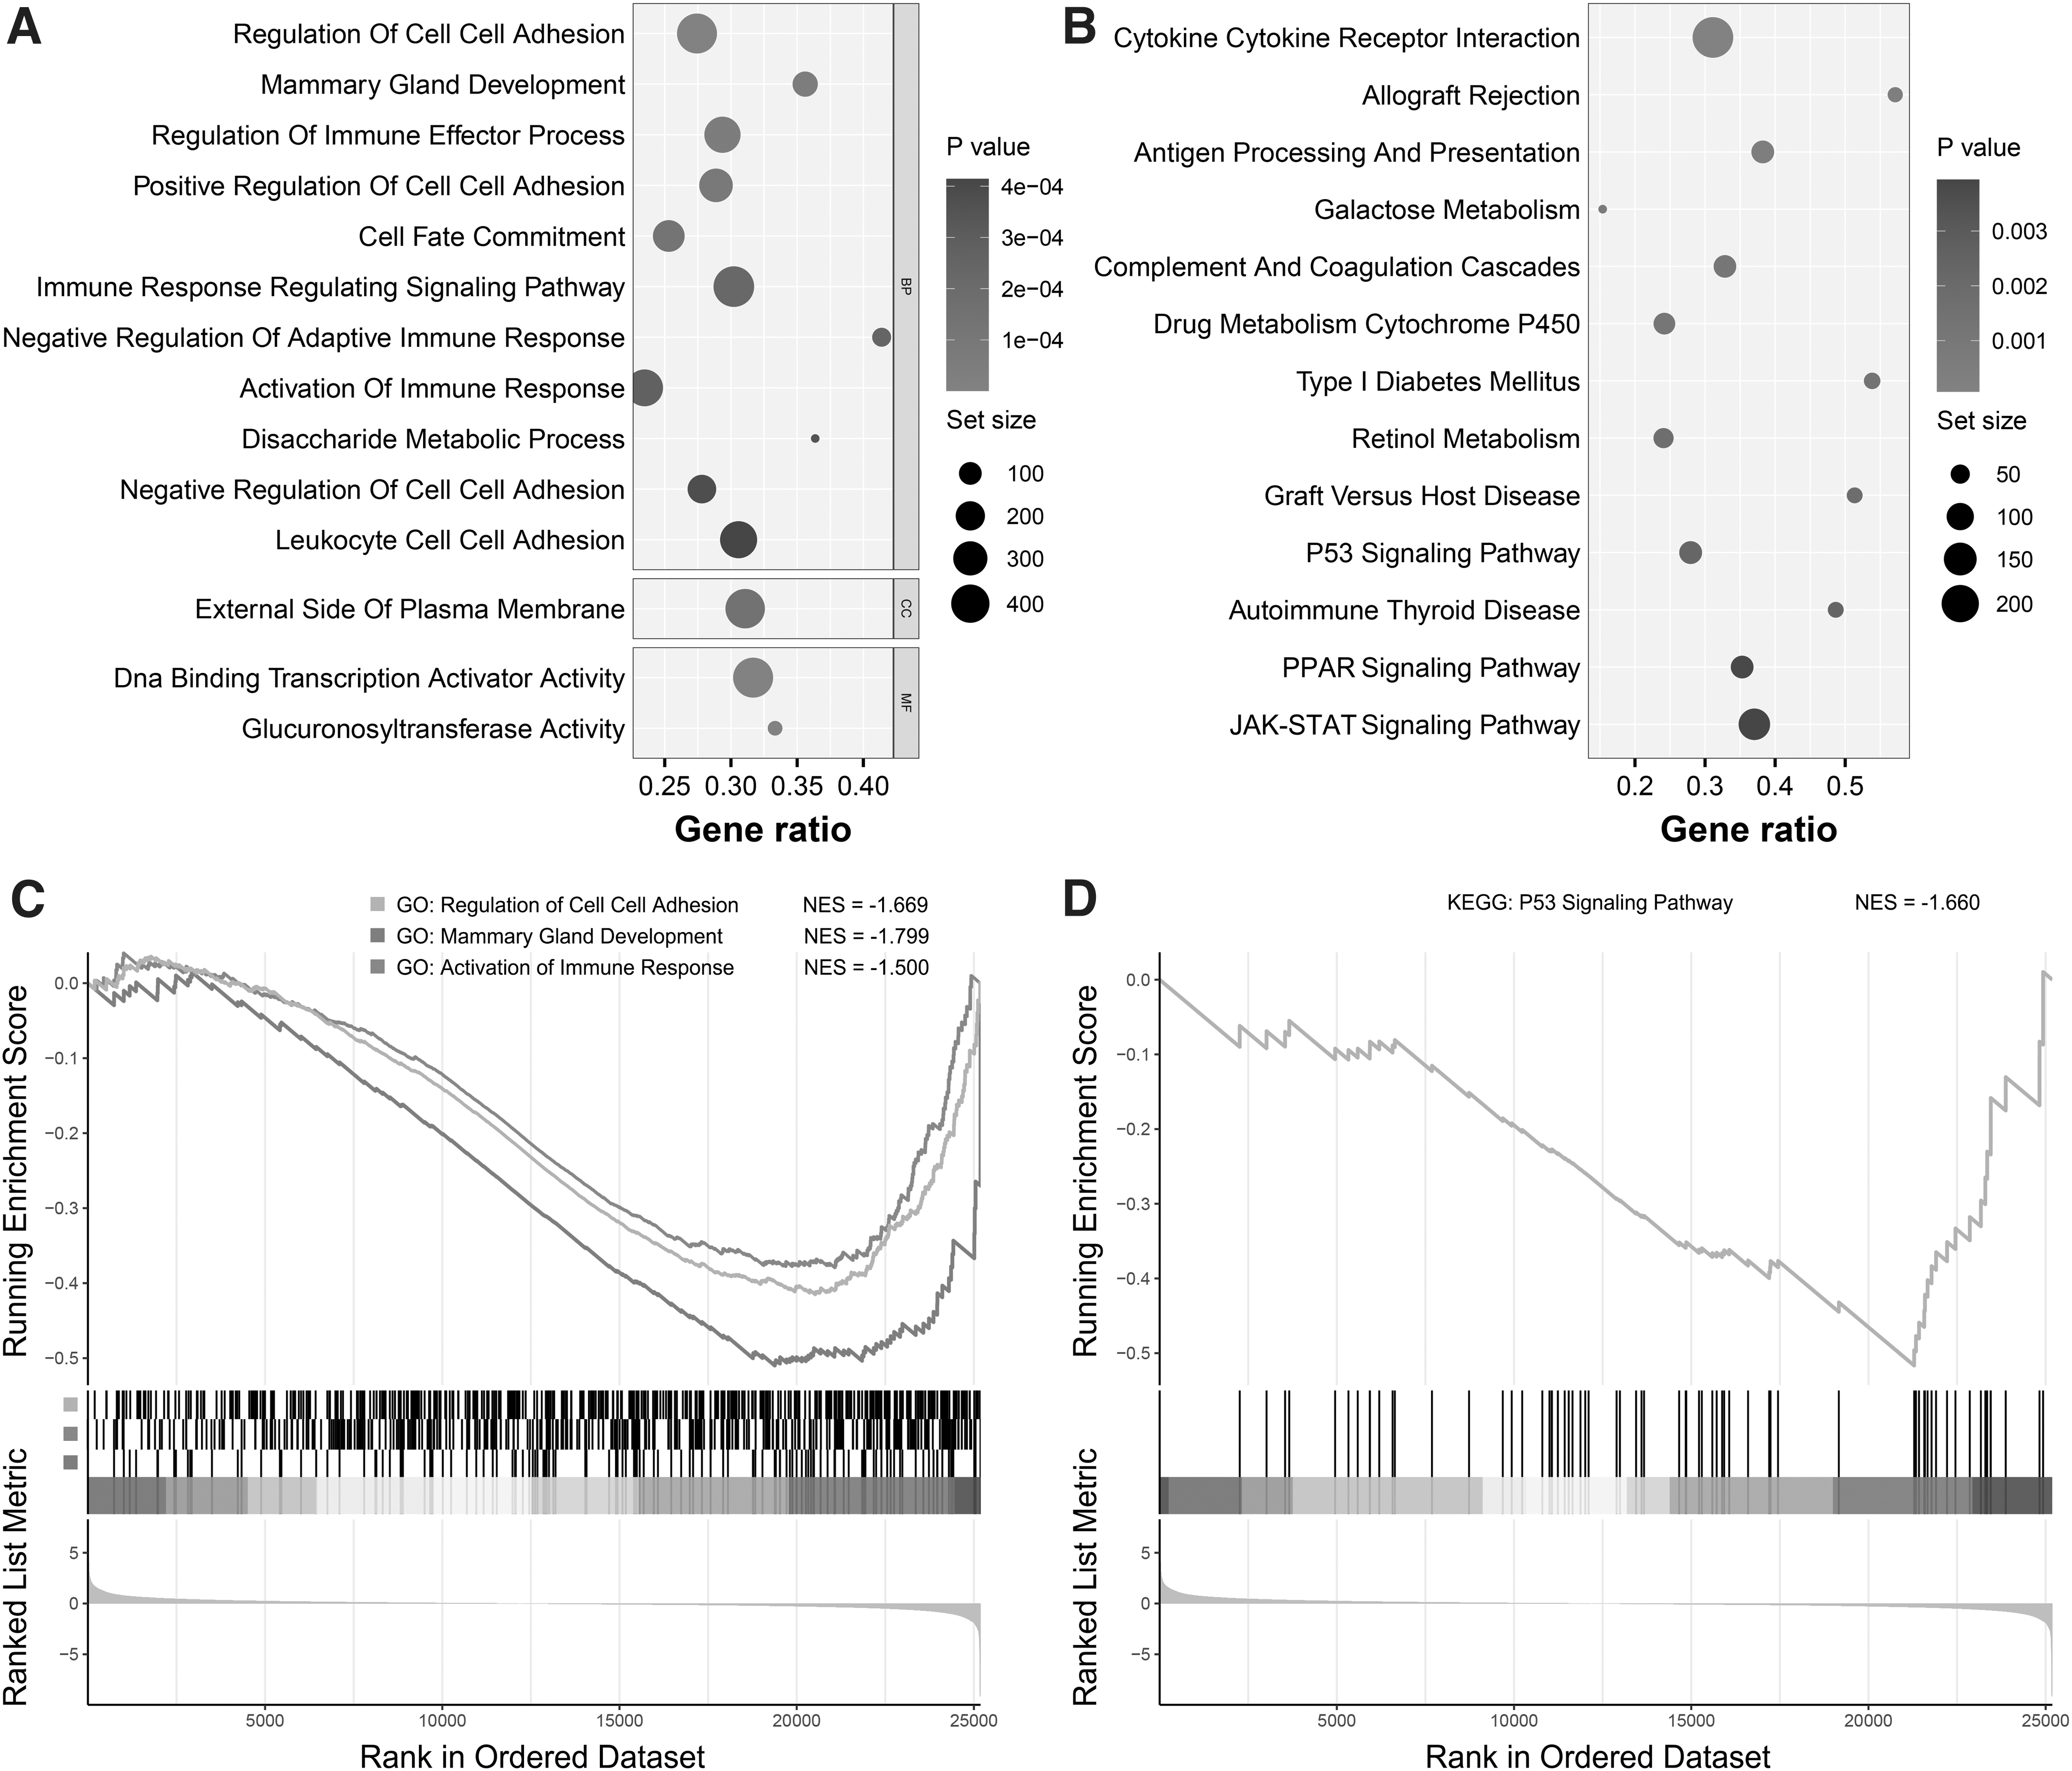
Gene set enrichment analysis for STEL-associated genes.
Screening of the risk predictive signature in STEL-associated genes
To explore the prognostic values of the STEL-associated genes in breast cancer, a combination of LASSO and Cox analyses was conducted. LASSO regression was performed to narrow the range of the 63 STEL-associated genes (Fig. 5A), and multivariate Cox regression was subsequently used to identify a gene signature that could predict the prognosis of breast cancer. Thus, a risk predictive model based on nine STEL-associated genes was successfully constructed, and the formula for risk score calculation was as follows: risk score = (−0.00167*KRT6A)+(0.14177*LINC00839)+(0.03247*MMADHC)+(1.09877*NR0B2)+(−6.75219*PHB2)+(0.00947*SOD1)+(0.60041*SUN3)+(0.03683*VPS35)+(0.02745*YKT6). The cutoff value between high and low risk was set to the median risk score of samples from the training set (RS cutoff = 4.05820, Table 2).

Training of the risk predictive signature based on STEL-associated genes.
Coefficients of the Five Identified Genes from the Risk Model
The cutoff value of risk score is 4.05820.
The distribution of risk score and survival status is shown in Figure 5B. Kaplan‒Meier analysis showed that the OS of high-risk patients was significantly worse (p < 0.001, Fig. 5C), and tdROC analysis verified the predictive accuracy of the risk model, with area under curves (AUCs) for 3-, 5-, and 7-year survival reaching 0.810, 0.811, and 0.753, respectively (Fig. 5D).
Validation of the prognostic signature
Kaplan‒Meier and tdROC analyses were also performed in the validation set to confirm the prognostic value of the identified prognostic signature. The distribution of the risk score and vital status of patients in the validation set is shown in Figure 6A. For Kaplan‒Meier analysis, the OS of the high-risk group was significantly worse than that of the low-risk group (p = 0.0034, Fig. 6B), and the precision of the signature in predicting the prognosis of breast cancer was satisfactory according to the ROC curves. The AUCs for 3-, 5-, and 7-year survival were 0.828, 0.674, and 0.684, respectively (Fig. 6C).
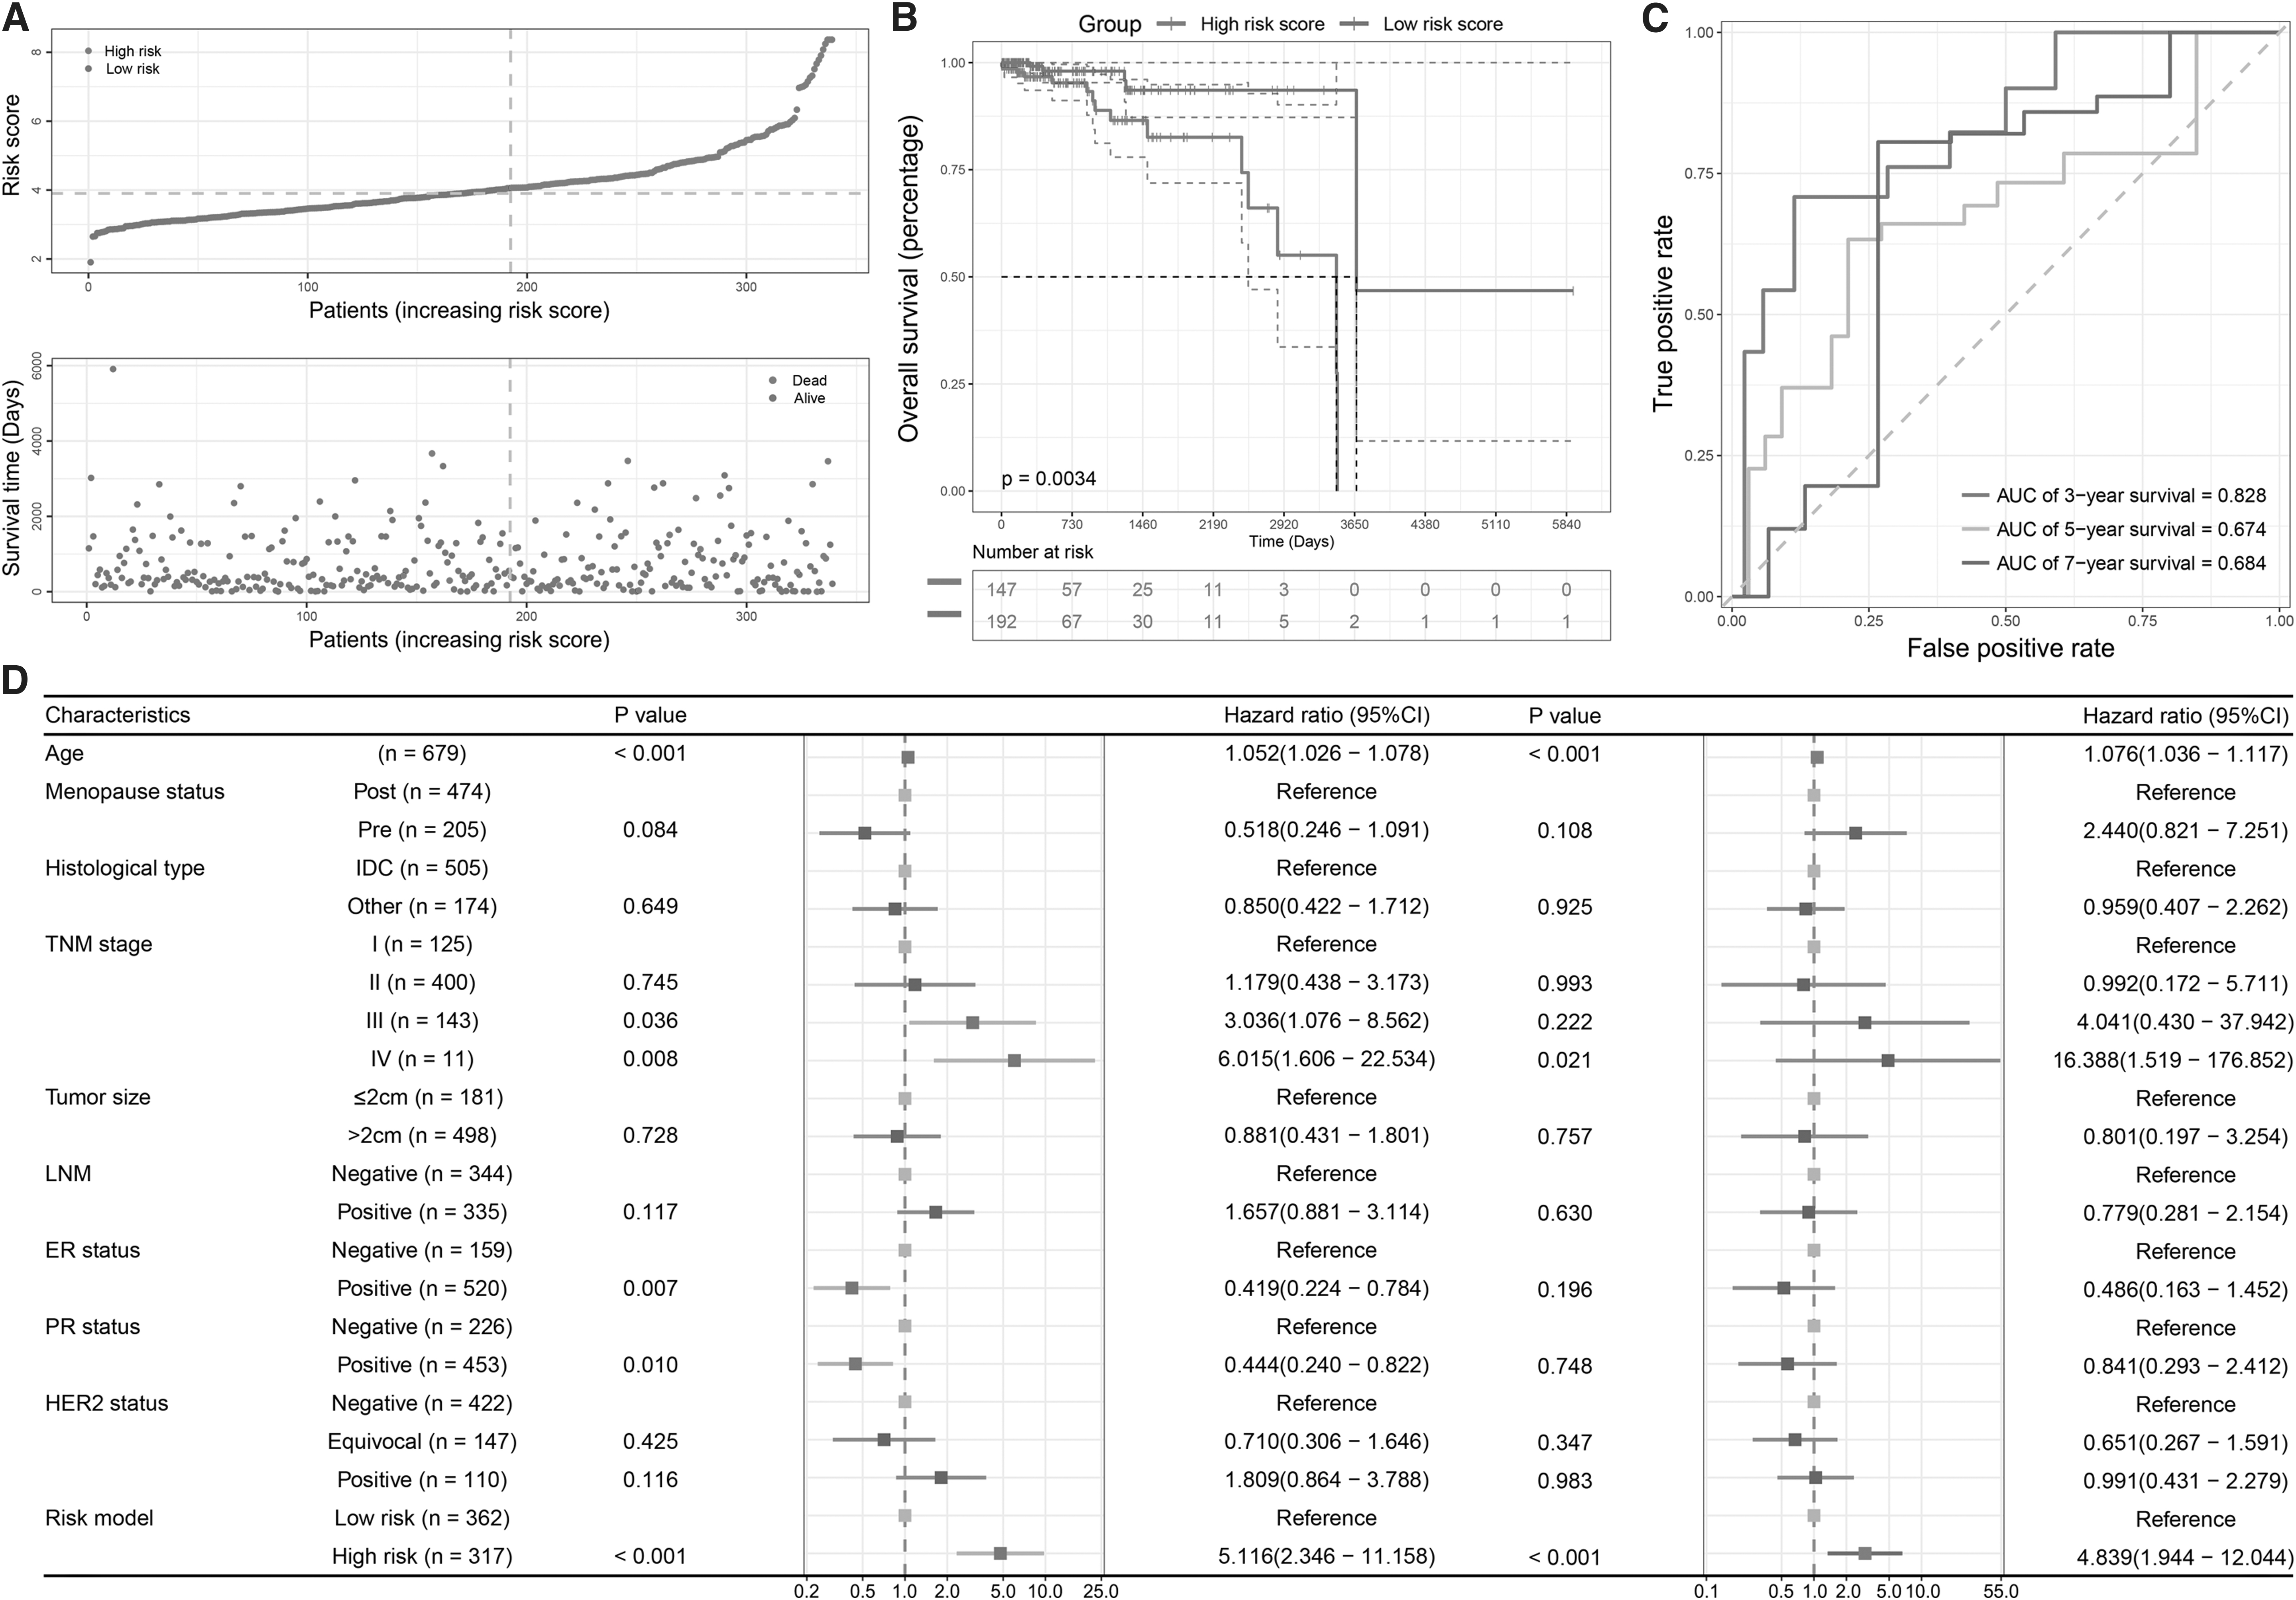
The validation of the risk predictive signature.
Moreover, to investigate whether the risk predictive signature was an independent prognostic factor of breast cancer, univariate and multivariate Cox regressions were performed, and multiple clinicopathological features were involved (Fig. 6D). The results of univariate (hazard ratio [HR] = 5.166, 95% confidence interval [CI]: 2.346-11.158; p < 0.001) and multivariate (HR = 4.839, 95% CI: 1.944-12.044; p < 0.001) analyses confirmed the prognostic value of the signature.
Furthermore, Kaplan‒Meier analysis was performed to evaluate the OS of the high- and low-expression groups of each gene from the risk predictive signature (Fig. 7A-F). The results showed that the OS of the KRT6A and PHB2 high-expression groups was more beneficial than that of the low-expression groups, while the high-expression groups of MMADHC, NR0B2, VPS35, and YKT6 had a worse prognosis than the low-expression groups. In addition, the expression profiles of the nine genes from the signature were validated by qRT‒PCR in clinical specimens. The relative expression levels of LINC00839, MMADHC, NR0B2, SOD1, SUN3, VPS35, and YKT6 were significantly higher in STEL breast cancer samples, and the expression levels of KRT6A and PHB2 were significantly lower (Fig. 7G). These results were consistent with the differential expression analysis.
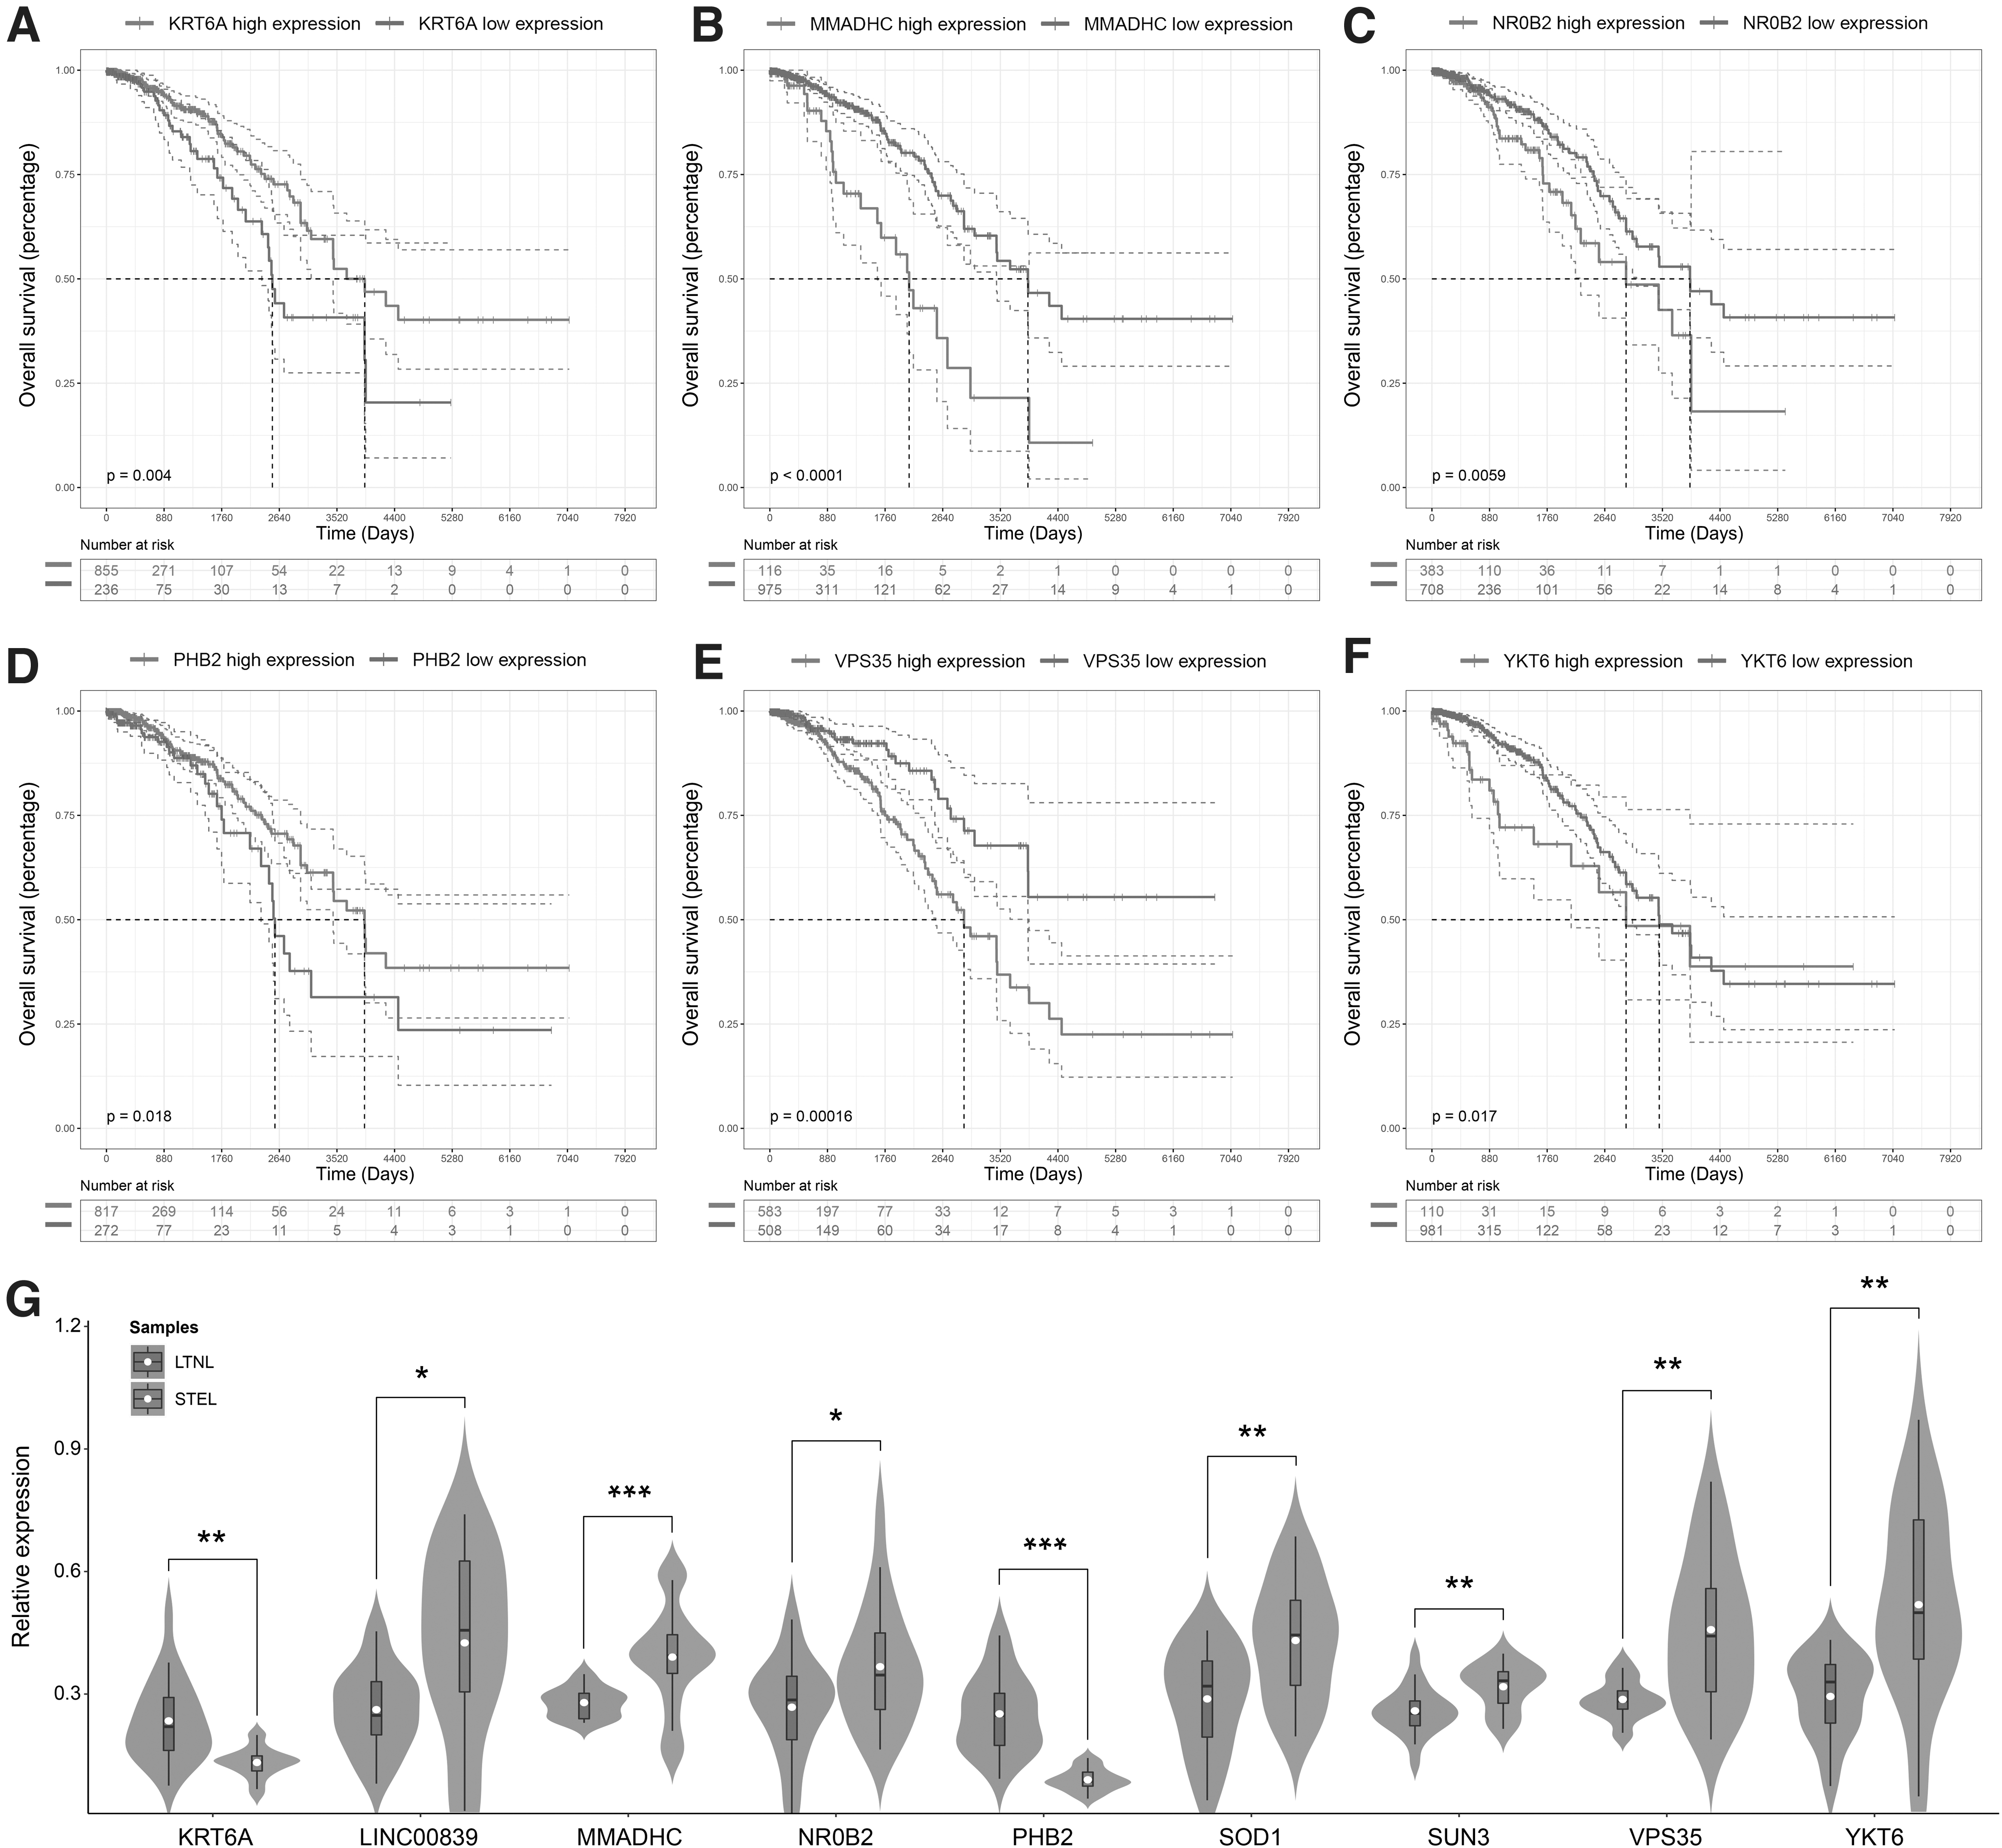
Survival analysis and qRT-PCR of the nine genes from the signature.
Discussion
Breast cancer is the most prevalent tumor type worldwide. Despite distinct progress in treatment, breast cancer remains a leading cause of female cancer-related death (Sung et al., 2021). Breast cancer is known as a heterogeneous disease comprising discrepant subtypes that vary evidently in accordance with molecular biology and clinical features (Pellacani et al., 2019). Currently, breast cancer is divided into four subtypes, luminal A, luminal B, Her-2 positive, and triple-negative, based on immunohistochemical results of specific molecules, including estrogen receptor, progesterone receptor, HER-2, and Ki-67 (Waks and Winer, 2019). Such biological heterogeneity among different subtypes has brought about distinct differences in clinical outcome, response to therapeutic approaches, and patient survival (Wilcock and Webster, 2021).
The cancer staging system was formulated based on tumor size (T), lymph node metastasis (N), and distant metastasis (M) by the AJCC and the Union for International Cancer Control (UICC). Tumor size and LN metastasis have been the most commonly used methods and the most valid prognostic indicators in assessing the prognosis of breast cancer (Giuliano et al., 2018). Due to the prognostic value, an increasing number of researchers have evaluated the correlation between tumor size and nodal metastasis. The correlation between tumor size and LN status varies significantly among different breast cancer subtypes (Min et al., 2021). The tumor areas of 106 patients with breast invasive ductal cancer measured with contrast-enhanced ultrasound could predict regional LNM and N stage (Wang et al., 2014).
A retrospective study of 819,647 patients with invasive breast tumors showed that the relationship between tumor size and LN status is not linear (Sopik and Narod, 2018). However, a larger tumor size might not always reflect an increased risk of axillary LN metastasis, specifically in triple-negative breast cancer subtypes (Yaman et al., 2012; Altundag, 2019). Patients with small tumors and extensive LN status or with large tumors and negative LN status have been commonly found in clinical practice. The traditional TNM stages might not always be suitable for all patients due to individual differences. Therefore, finding genes driving these unusual clinical features could provide a basis for individualized diagnosis and treatment.
In this study, to identify genes driving different pathological phenotypes of STEL and LTNL breast cancer, we performed a series of bioinformatics analyses of breast cancer datasets from TCGA. First, three gene modules positively correlated with LNM and negatively correlated with tumor size were identified by WGCNA. Then, in combination with DEG analysis, 63 overlapping genes between the identified coexpression gene modules and DEGs were determined to be STEL-associated genes. GSEA was used to portray the functional roles of the STEL-associated genes. The results showed that the STEL-associated genes were significantly enriched in the regulation of cell adhesion, mammary gland development, activation of the immune response, and P53 signaling pathway BP, which indicated that all the above signaling pathway dysregulation may cause abnormal pathological phenotypes, such as enhanced LNM.
To evaluate the value of STEL-associated genes in predicting the clinical outcome of breast cancer, a risk predictive model was constructed through LASSO regression and multivariate Cox regression and included the following nine genes: KRT6A, LINC00839, MMADHC, NR0B2, PHB2, SOD1, SUN3, VPS35, and YKT6.
Keratin 6A (KRT6A), a type II cytokeratin, was recently found to be hyperexpressed in various types of cancer. However, a study reported that Krt6a expression in mammary epithelial progenitors did not favor tumorigenesis initiated by ErbB2 (Yang et al., 2020) in mice. In our study, we found that KRT6A expression was lower in STEL patients, and high KRT6A expression predicted good clinical outcome in breast cancer. NR0B2 (nuclear receptor subfamily 0 group B member 2), an orphan nuclear receptor, is a favorable prognostic factor in patients with liver, kidney, lung, and urinary bladder cancers but is a negative factor in patients with colon, thyroid, uterine, and head and neck cancers (Zhu et al., 2021).
NR0B2 functions as a STEL phenotype-associated gene and is negatively related to patient prognosis in breast cancer. Prohibitin 2 (PHB2) has been studied as a tumor suppressor in breast cancer (Kim et al., 2015), consistent with our results. Superoxide dismutase 1 (SOD1) might assist in eliminating excessive ROS produced during the process of metabolic reprogramming of cancer cells, which is conducive to the malignant transformation of tumors (Papa et al., 2014). Upregulated SOD1 in STEL breast cancer patients might also be involved in the occurrence of LNM, a possibility that needs further experimental confirmation. Vacuolar protein sorting-associated protein 35 (VPS35) was identified as an autophagy-related encoding gene in breast cancer.
VPS35 upregulation indicated worse prognosis in both progression-free and OS and promoted the progression of breast cancer (Li et al., 2021). YKT6 (YKT6 V-SNARE Homolog) was reported to be a tumor promoter in nonsmall cell lung cancer (Lee et al., 2021), breast cancer (Ooe et al., 2007), pancreatic cancer (Sun et al., 2020), hepatocellular carcinoma (Xu et al., 2021) and oral squamous cell carcinoma (Yang et al., 2021). In accordance with previous reports, we also found that the expression levels of VPS35 and YKT6 were increased in STEL breast cancer patients and correlated with poor clinical outcome in breast cancer, indicating their involvement in the development of this tumorigenic phenotype. LINC00839, the only noncoding RNA identified, was reported to play protumor roles in different kinds of cancer (Yu et al., 2021; Zhou et al., 2021; Zhang et al., 2022).
LINC00839 was also upregulated in chemoresistant breast cancer cells and tissues and was associated with a poor prognosis (Chen et al., 2020). There has been no report regarding the roles of MMADHC and SUN3 in breast cancer, which need to be explored in the future. Combining the results of the present study, all nine genes were strongly associated with the STEL phenotype, and the risk model based on these genes provided high precision in predicting the prognosis of breast cancer. This evidence suggests that genes aberrantly expressed in the STEL phenotype play pivotal roles in breast cancer development and lead to poor outcomes in breast cancer. Further exploration is still needed on the aspects of function and mechanism at the experimental level.
To the best of our knowledge, our study is the first to evaluate the association between extensive LN involvement, breast cancer, and candidate genes. Moreover, a risk model based on these genes was constructed with high precision and accuracy to predict prognosis for breast cancer. These findings may provide a new theoretical basis for the individual diagnosis and treatment of breast cancer. However, our study had several limitations. First, since the proportions of STEL and LTNL breast cancer patients were small, the number of clinical samples analyzed by qRT‒PCR was limited. Multicenter clinical studies are still required to further validate the effects of these genes on STEL breast cancer. Second, the STEL-associated genes were primarily identified using bioinformatics methods in the present study. Wet-lab experiments should be performed to further investigate the functional roles of these genes in vitro and in vivo.
Footnotes
Ethical Approval
All procedures performed in studies involving human participants were in accordance with the Declaration of Helsinki 1964 and its later amendments or comparable ethical standards. This article does not contain any studies with animals performed by any of the authors.
Author Disclosure Statement
No competing financial interests exist.
Funding Information
This work was supported by grants from the National Natural Science Foundation of China (81902932).

References
Supplementary Material
Please find the following supplemental material available below.
For Open Access articles published under a Creative Commons License, all supplemental material carries the same license as the article it is associated with.
For non-Open Access articles published, all supplemental material carries a non-exclusive license, and permission requests for re-use of supplemental material or any part of supplemental material shall be sent directly to the copyright owner as specified in the copyright notice associated with the article.
