




Abstract
Background:
Sepsis is a complex clinical syndrome caused by a dysregulated host immune response to infection. This study aimed to identify a competing endogenous RNA (ceRNA) network that can greatly contribute to understanding the pathophysiological process of sepsis and determining sepsis biomarkers.
Methods:
The GSE100159, GSE65682, GSE167363, and GSE94717 datasets were obtained from the Gene Expression Omnibus (GEO) database. Weighted gene coexpression network analysis was performed to find modules possibly involved in sepsis. A long noncoding RNA-microRNA-messenger RNA (lncRNA-miRNA-mRNA) network was constructed based on the findings. Single-cell analysis was performed. Human umbilical vein endothelial cells were treated with lipopolysaccharide (LPS) to create an in vitro model of sepsis for network verification. Reverse transcription-polymerase chain reaction, fluorescence in situ hybridization, and luciferase reporter genes were used to verify the bioinformatic analysis.
Result:
By integrating data from three GEO datasets, we successfully constructed a ceRNA network containing 18 lncRNAs, 7 miRNAs, and 94 mRNAs based on the ceRNA hypothesis. The lncRNA ZFAS1 was found to be highly expressed in LPS-stimulated endothelial cells and may thus play a role in endothelial cell injury. Univariate and multivariate Cox analyses showed that only SLC26A6 was an independent predictor of prognosis in sepsis. Overall, our findings indicated that the ZFAS1/hsa-miR-449c-5p/SLC26A6 ceRNA regulatory axis may play a role in the progression of sepsis.
Conclusion:
The sepsis ceRNA network, especially the ZFAS1/hsa-miR-449c-5p/SLC26A6 regulatory axis, is expected to reveal potential biomarkers and therapeutic targets for sepsis management.
Introduction
Sepsis is a complex clinical syndrome caused by a dysregulated host immune response to infection (Singer et al., 2016). Sepsis has become a serious threat to human health because of its high incidence, mortality, and medical burden (Weng et al., 2018). Nearly half of sepsis cases are complicated by organ injury (Poston and Koyner, 2019). The mortality rates of sepsis complicated by organ injuries, such as acute kidney injury (AKI), can reach up to 50% (Perner et al., 2018). Even though sepsis has a high mortality rate and morbidity, few drugs have shown to be effective in curing it. It may be due to the complexity of septic pathophysiology.
Numerous studies have demonstrated that noncoding RNA plays a crucial role in regulating biological processes (BPs) (Chan and Tay, 2018). In addition to their microRNA (miRNA)-binding sites, long noncoding RNA (lncRNA) is also an miRNA sponge, relieving the inhibition of its target genes by miRNAs, thereby enhancing the expression of target genes. This is known as the “love triangle theory” of RNA regulation or the competing endogenous RNA hypothesis (Salmena et al., 2011). The ceRNA network provides new perspectives for understanding the mechanisms underlying and improving the diagnosis of several diseases (Chen et al., 2022; Ye et al., 2020; Sun et al., 2022). Although several recent studies have shown that ceRNAs play a significant role in sepsis (Yang et al., 2021a; Lu et al., 2020), more research is still needed.
In this study, we aimed to elucidate the ceRNA network involved in the progression of sepsis using bioinformatics in order to understand the pathophysiological process of sepsis and identify novel and effective therapeutic strategies.
Materials and Methods
Screening of differentially expressed genes
A search of the Gene Expression Omnibus (GEO) database (http://www.ncbi.nlm.nih.gov/geo/) was conducted to find gene expression datasets that are appropriate for analysis (Clough and Barrett, 2016). The GSE100159 (Rinchai et al., 2020) and GSE94717 (Ge et al., 2017) datasets were selected for downloading. The GSE94717 dataset contains data from six samples from patients with sepsis and three samples from healthy controls. The GSE100159 dataset contains data from 15 samples from patients with sepsis and 12 samples from healthy controls. The data were normalized again using the normalize Between Arrays function of the limma package. Following that, we used the limma package once again to identify differentially expressed genes (DEGs) between sepsis and healthy control groups in GSE100159. Similarly, differentially expressed miRNAs (DEmiRNAs) were identified between the sepsis and healthy control groups in GSE94717. The threshold of differential expression for messenger RNAs (mRNAs) and miRNAs was set as p value < 0.05 and |logFC| (fold change) > 1.5. LncRNAs associated with sepsis were downloaded from the LncRNADisease database (http://www.rnanut.net/lncrnadisease) (Bao et al., 2019). GSE65682 was downloaded as a validation set of hub genes (Peters-Sengers et al., 2022). The GSE65682 dataset contains data from 21 samples from patients with sepsis caused by abdominal infection and 32 samples from healthy controls.
Function and pathway enrichments of differentially expressed mRNAs
We conducted gene ontology (GO) analyses on the DEGs identified by differential expression analysis (Ashburner et al., 2000). There are several kinds of gene functions, including BPs, molecular functions (MFs), and cellular components (CCs). Kyoto Encyclopedia of Genes and Genomes (KEGG) pathway analysis was used to identify enriched pathways and screen for key signaling pathways involved in specific BPs (Kanehisa and Goto, 2000). We used the “clusterProfiler,” “ggplot2,” and “enrichplot” packages of R to perform the GO and KEGG analyses of DEGs.
Identification and verification of hub genes by weighted gene coexpression network analysis
First, using gene expression profiles, we calculated the median absolute deviation (MAD) of all selected genes and removed the top 50% of genes with the smallest MADs. The good Samples Genes method of the weighted gene coexpression network analysis (WGCNA) in the R software was used to remove outlier genes and samples (Langfelder and Horvath, 2008). In addition, a scale-free coexpression network was constructed by using WGCNA. In order to classify genes into gene modules based on their expression profiles, according to the dissimilarity measure based on topological overlap matrix, the average linkage hierarchical clustering was carried out on the gene dendrogram, and the minimum size (gene group) was 30.
The acquisition of necroptosis-, ferroptosis-, apoptosis-, and pyroptosis-related genes
Many literatures are integrated into the GeneCard database (https://www.genecards.org/), which contains a tremendous amount of information about gene functions. This database was used to download genes associated with necroptosis, ferroptosis, apoptosis, and pyroptosis for this study. The genes with correlation greater than 1.0 were selected for bioinformatics.
Single sample gene set enrichment analysis
As part of the single sample gene set enrichment analysis (ssGSEA), it is common to compute the enrichment fraction for a particular gene set in a sample, which represents the level of absolute enrichment of that gene set. Each sample’s enrichment fraction of necroptosis, ferroptosis, apoptosis, and pyroptosis was calculated through the use of ssGSEA method.
Construction of a ceRNA network and identification of ferroptosis-related lncRNAs
On the basis of interactions and regulatory relationships between lncRNAs, mRNAs, and miRNAs, a ceRNA network was created. The top 10 DEmiRNAs obtained from the GSE94717 dataset were selected for analysis. For the prediction of target genes of miRNAs, we used MirWalk (http://mirwalk.umm.uni-heidelberg.de) (Dweep et al., 2014). The lncRNAs that interact with the selected miRNAs were predicted using the DIANA-LncBase v3.0 database (https://diana.e-ce.uth.gr/) (Karagkouni et al., 2020). The potential interacting mRNAs were obtained by intersecting the predicted target genes of the miRNAs and the hub genes. Potential lncRNAs were identified by intersecting the predicted lncRNAs interacting with miRNAs and the lncRNAs associated with sepsis. Using Cytoscape, the network of lncRNA-miRNA-mRNA ceRNAs was visualized. Ferroptosis-related genes were searched from the FerrDb database (http://www.zhounan.org/ferrdb/current/) (Zhou and Bao, 2020). A Venn diagram was used to visualize the intersection of lncRNAs and ferroptosis-related genes.
Single-cell sequencing data download and processing
A single-cell dataset of sepsis, GSE167363 (Qiu et al., 2021), was downloaded from the GEO database. Using the Seurat package, we generated the object and removed cells with poor quality. In order to calculate the percentage of gene numbers, cell counts, and mitochondria sequencing counts, we conducted standard data preprocessing. Genes detected in fewer than three cells were excluded, as well as genes detected in fewer than 200 cells were disregarded. We performed cell clustering using the FindClusters function implemented in the Seurat R package.
Cell culture and treatments
The human umbilical vein endothelial cells (HUVECs) are considered the ideal model for studying endothelial cells during sepsis progression because they play a key role in the progression of the disease (Jourde-Chiche et al., 2019). HUVECs from the Shanghai Institute of Life Sciences were obtained. A standard endothelial cell medium (ECM) (ScienCell) was used to culture the cells, and they were incubated at 37°C under 5% carbon dioxide. Standard cell culture techniques were used to maintain the cells. The HUVECs were detached from the culture plates using 0.25% trypsin-ethylenediaminetetraacetic acid (EDTA) once they reached 80% confluence. The HUVECs were then treated with 1 μg/mL lipopolysaccharide (LPS) for 24 h.
Quantitative real-time polymerase chain reaction
After reaching a confluence of 80%, HUVECs were detached using 0.25% trypsin-EDTA. Total RNA was isolated from cells using the TRIzol reagent (Invitrogen) according to the manufacturer’s instructions. The real-time polymerase chain reaction (PCR) was performed using SYBR Green PCR Master Mix (Bio-Rad Laboratories) on a MyiQ Single Color Real-time PCR Detection System (Bio-Rad Laboratories). The sequence-specific primers for the indicated genes were synthesized by Sangon Biotech.
The luciferase reporter gene assay
The first step involved seeding HUVECs into 24-well culture plates a day before transfection. We then transfected relevant plasmids into the different groups of cells. We observed the expression of fluorescent marker genes under a fluorescence microscope 24 h after transfection. In order to detect luciferase expression, cells were treated with a Dual-Luciferase® Reporter Assay System kit (E1910).
Fluorescence in situ hybridization
Fluorescence in situ hybridization (FISH) was performed to detect RNA distribution and localization in HUVECs. This technique uses fluorescent probes to hybridize with target RNA in cells or tissues and then uses laser confocal microscopy and other detection methods to judge the distribution of RNA molecules by fluorescence distribution and intensity.
Verification of the clinical correlation of hub genes
Receiver operating characteristic (ROC) curve and Kaplan-Meier (KM) survival curve analyses were used to investigate the prognostic value of hub genes in GSE65682. Univariate and multivariate Cox regression analyses were also performed to analyze the prognostic value of clinical factors and hub genes in GSE65682.
Statistical Analysis
Continuous variables were compared using Student’s t test (for normally distributed data) or Mann-Whitney U test (for data that were not normally distributed). Correlations between continuous variables were assessed using Spearman’s correlation coefficient. ROC curves and area under the curve (AUC) values were used to compare the prognostic accuracies of hub genes. Survival curves were plotted using the KM method and compared using the log-rank test. Cox regression analysis was used for univariate and multivariate analyses. Statistical analyses were performed using the SPSS 19.0 software (IBM). A p value < 0.05 was considered to indicate the statistical significance.
Results
Identification of DEmiRNAs and genes between AKI and control groups
GSE100159 and GSE94717 datasets for sepsis and control groups were analyzed using the limma package. As shown in Figure 1A, 273 significantly upregulated genes (green dots) and 654 significantly downregulated genes (red dots) are identified between the two groups in GSE100159. In total, 1043 DEmiRNAs are identified, of which 1018 are downregulated (blue dots) and 25 are upregulated (red dots) in GSE94717. The gene microarray data of the two groups had better homogeneity after logarithmic processing, and results were found to be comparable between the two groups (Fig. 1B). The heatmap of GSE100159 is showed in Figure 1C.

Differentially expressed genes in the GSE100159 and GSE94717 datasets.
Enrichment analyses of DEGs
As a result of the GO analysis, T cell activation, neutrophil activation, neutrophil-mediated immunity, neutrophil activation involved in immune response, and neutrophil degranulation ranked as the top five BPs. The top five CC terms were external side of plasma membrane, cytoplasmic vesicle lumen, vesicle lumen, secretory granule lumen, and membrane microdomain. The top five MF terms were amide binding, cytokine binding, peptide binding, cytokine receptor activity, and protein tyrosine kinase binding (Fig. 1D and Table 1). In the KEGG pathway analysis, the top five pathways were hematopoietic cell lineage, transcriptional misregulation in cancer, Th1 and Th2 cell differentiation, T cell receptor signaling pathway, and Th17 cell differentiation (Fig. 1D). The GO enrichment chordal diagram shows which genes were associated with each GO term and ranks them according to their change factor (Fig. 1E). The GO enrichment analysis terms were sorted according to strength.
Pathways and Functions Identified through GO and KEGG Analyses
BP, biological process; CC, cellular component; KEGG, Kyoto Encyclopedia of Genes and Genomes; MF, molecular function.
Identification of hub genes through WGCNA
We used β as a soft-thresholding parameter to emphasize strong correlations between genes and penalize weak correlations. To determine gene network connectivity, we converted the adjacency into a topological overlap matrix (TOM) based on a power of 7, assumed the gene’s adjacency to all other genes, and calculated the dissimilarity between them (1-TOM). Our further analysis included calculating the module’s dissimilarity for its eigengenes, selecting its dendrogram cut line, and merging some modules. Merging modules with a distance of less than 0.25 resulted in the creation of nine coexpression modules. The gray module is a gene set that cannot be assigned to any module. A significant module was identified as hub genes when the cutoff criteria were |MM| > 0.8 and |GS| > 0.1. There were 224 genes in the significant module identified as hub genes as a result of the cutoff criteria (Fig. 2).
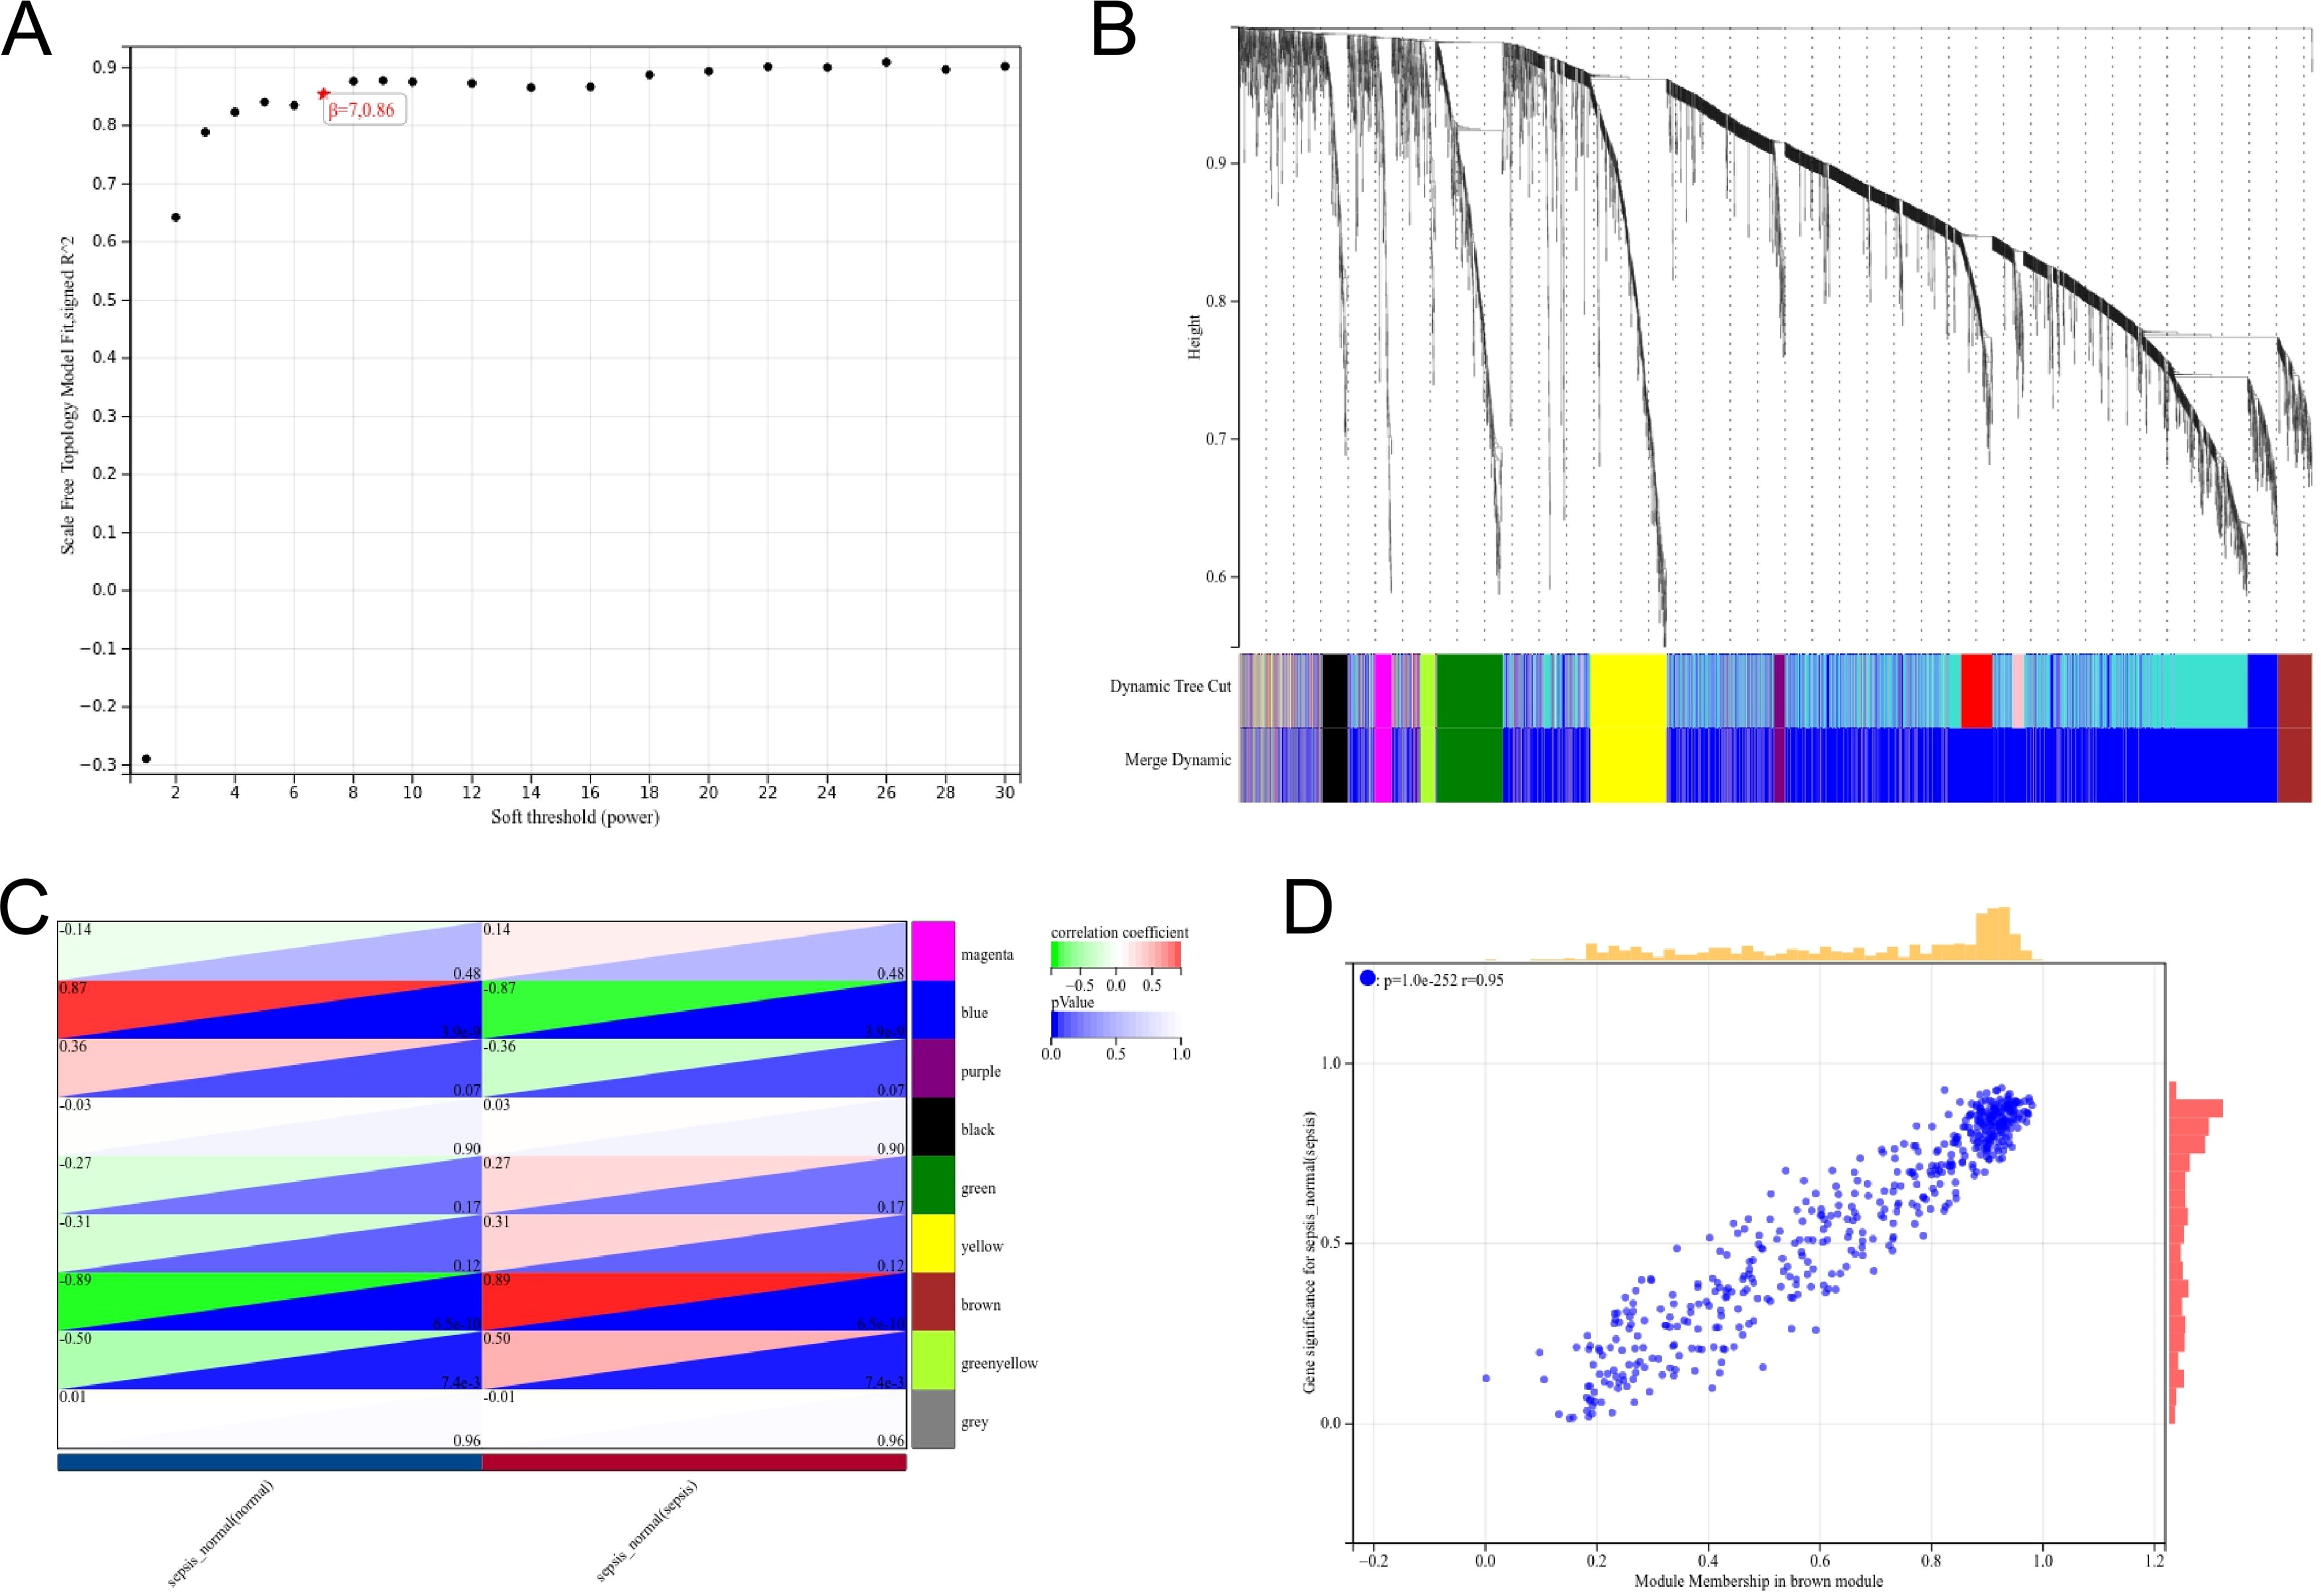
Weighted gene coexpression network analysis.
Hub gene selection and construction of a lncRNA-miRNA-mRNA ceRNA network
The top 10 DEmiRNAs with an adjusted p value from the GSE94717 dataset were selected for analysis. Target genes of these DEmiRNAs were predicted using MiWalk. These target genes were intersected with the 224 hub genes identified from the GSE100159 dataset. In all, 94 genes were found to overlap between the target genes and the hub genes (Fig. 3A). The target genes of three selected miRNAs did not intersect with the hub genes. Therefore, miR-23b-5p, miR-451a, miR-188-3p, miR-449c-5p, miR-1292-5p, let-7a-3p, and miR-16-2-3p were included in the lncRNA-miRNA-mRNA ceRNA network. In total, 126 lncRNAs associated with sepsis were downloaded from the LncRNADisease database. Among them, 18 lncRNAs may have a regulatory relationship with the miRNAs included in our lncRNA-miRNA-mRNA ceRNA network according to the DIANA-LncBase v3.0 database. A ceRNA network is constructed based on the interaction and regulatory relationships among lncRNAs, miRNAs, and mRNAs (Fig. 3B). By ssGSEA method, we identified the scores for these four types of cell death during sepsis (Fig. 3C).

Single-cell sequencing analysis
In the course of sepsis, there may be a variety of cell death modes. However, the role of ferroptosis in sepsis still needs attention. We further analyzed lncRNAs associated with ferroptosis. The intersection between lncRNA genes and ferroptosis-related genes was visualized using a Venn diagram. Three genes (PVT1, ZFAS1, and MEG3) were found to overlap between lncRNA genes and ferroptosis-related genes (Fig. 4A). The cluster analysis was carried out by the t-Distributed Stochastic Neighbor Embedding (t-SNE) method, and the cell cluster map was annotated according to the analysis results. Different colors represent different cell clusters, and Figure 4B shows the annotated cluster results. As can be seen from Figure 4C, only ZFAS1 has different expressions in endothelial cells of the sepsis group. As can be seen from Figure 4D and E, there was no significant difference in the expressions of the other two lncRNAs in single-cell analysis.

ZFAS1 expression was significantly increased in HUVECs treated with LPS
We determined the expression levels of three lncRNAs in HUVECs treated with LPS through quantitative real-time PCR. Only lncRNA ZFAS1 had a significantly different expression between the control and the LPS-treated cells. The expression levels of PVT1 and MEG3 did not differ significantly between the control and the LPS cells (Fig. 5A). As shown in Figure 5B and C, the expression levels of inflammatory cytokines were lower in the LPS + ZFAS1 small interfering RNA group than those in the LPS-treated and LPS + si-NC groups (Negative control groups). RNALocate (http://www.rna-society.org/rnalocate) analysis showed that lncRNA ZFAS1 was distributed in the nucleus, ribosomes, cytosol, and cytoplasm (Fig. 5D). FISH also showed that lncRNA ZFAS1 was distributed in the nucleus and cytoplasm of HUVECs (Fig. 5E). We determined the expression levels of three miRNAs related to lncRNA ZFAS1 from the network in HUVECs treated with LPS through quantitative real-time PCR (Fig. 5F). Only miRNA-449c-5p had a significantly different expression between the control and the LPS-treated cells. The binding site between miR-449c-5p and ZFAS1 was predicted using the DIANA-LncBase v3.0 database (Fig. 5G). Reverse transcription-polymerase chain reaction showed that the miR-449c-5p expression level was increased by si-ZFAS1 in HUVECs (p < 0.05; Fig. 5H). Moreover, the dual-luciferase reporter gene assay (Fig. 5I) showed that miR-449c-5p could specifically bind to ZFAS1.

Performance of hub genes in sepsis diagnosis in the validation set
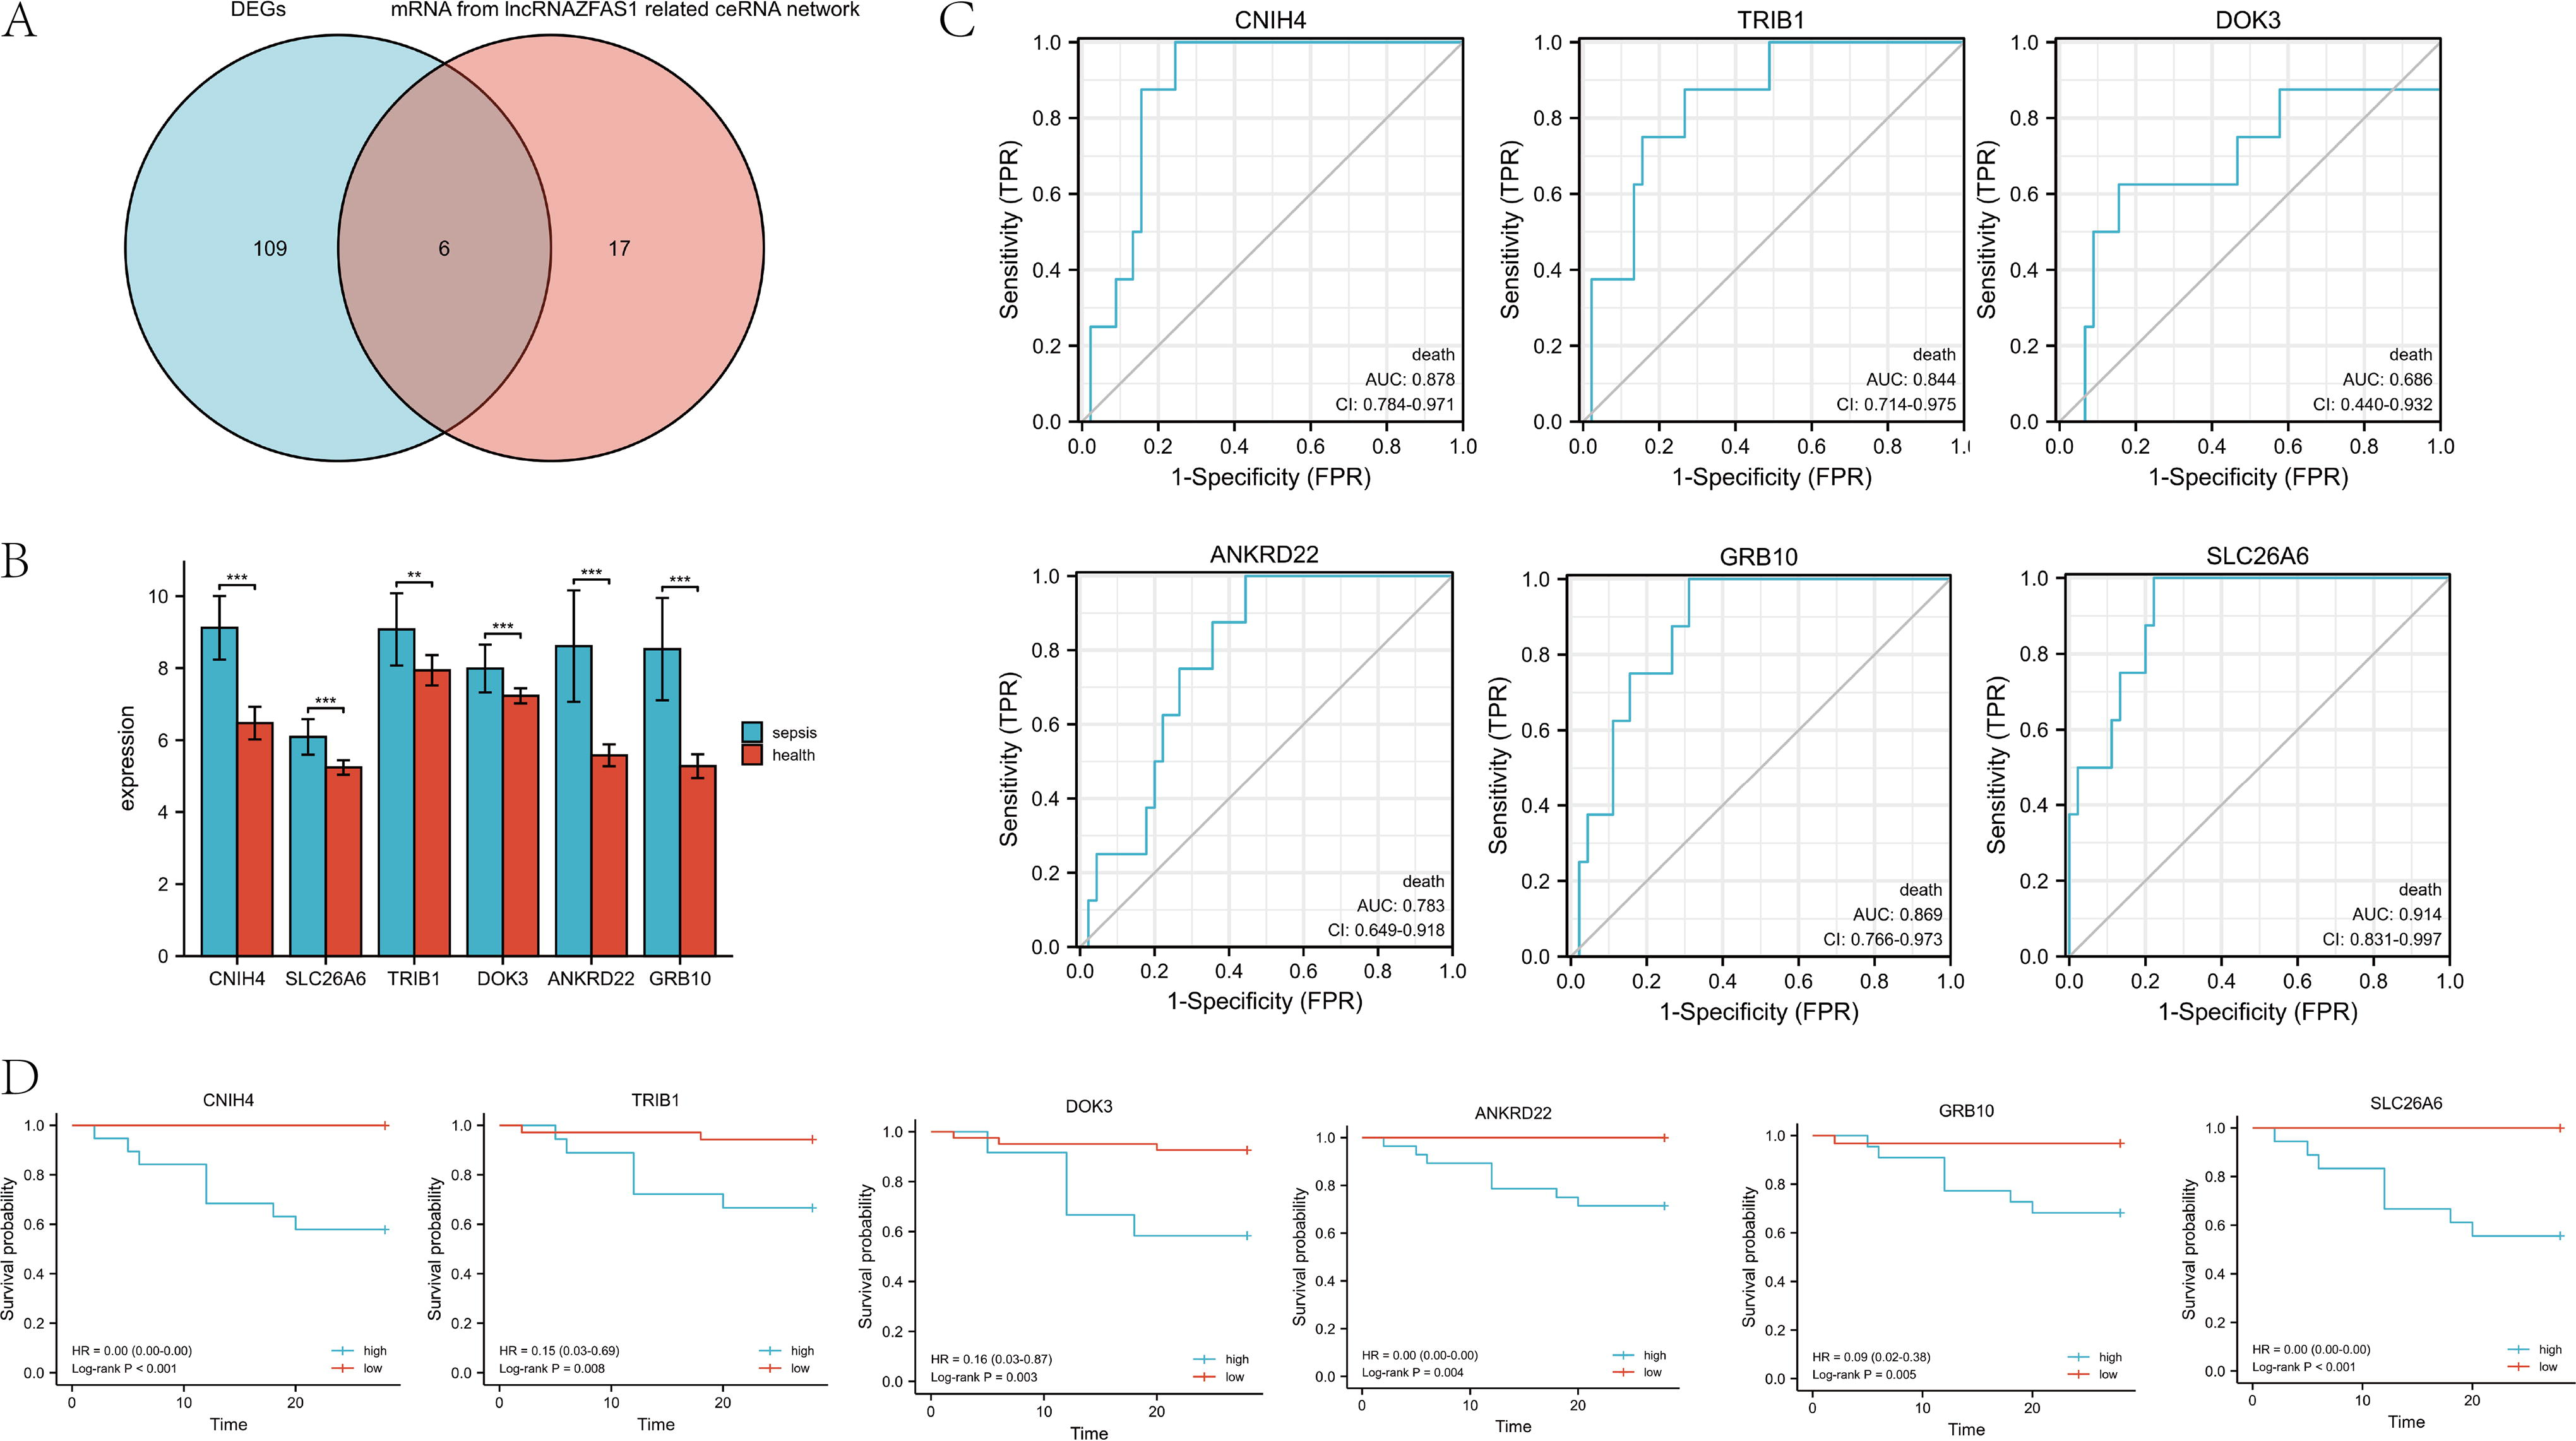
According to the abovementioned results, 23 genes were regulated by miRNA-449c-5p in the ceRNA network. Six hub genes (CNIH4, SLC26A6, TRIB1, DOK3, ANKRD22, and GRB10) were obtained from the intersection of the 115 upregulated genes in GSE65682 and the 23 hub genes in the ceRNA network (Fig. 6A). Between the sepsis and the control groups, the expression of these six hub genes had significant differences (Fig. 6B). The ability of the abovementioned genes to predict the prognosis of sepsis was evaluated using ROC curve analysis. As shown in Figure 6C, the AUC values for CNIH4, SLC26A6, TRIB1, DOK3, ANKRD22, and GRB10 were 0.878 (0.784-0.971), 0.914 (0.831-0.997), 0.844 (0.714-0.975), 0.686 (0.440-0.932), 0.783 (0.649-0.918), and 0.869 (0.766-0.973), respectively. The 28-day mortality risks caused by abdominal infection in patients with sepsis were calculated according to the cutoff point for the six hub genes. KM survival analysis showed that elevated expression of six hub genes in patients indicated a worse prognosis (Fig. 6D). We used age, gender, and the expression levels of six hub genes for univariate and multivariate Cox regression analyses and found that only SLC26A6 was an independent predictor of sepsis prognosis (Table 2).
Univariate and Multivariate Cox Regression Analyses of Hub Genes
CI, confidence interval.
Discussion
Sepsis can cause a variety of organ injuries, including acute liver injury, septic cardiomyopathy, and AKI (Bouchard et al., 2015). To date, several ceRNAs have been identified to play a role in sepsis (Deng et al., 2021; Liu et al., 2020; Yang et al., 2021a). In this study, we wanted to investigate the role of a ceRNA regulatory network in AKI caused by sepsis. According to the ceRNA hypothesis, we constructed here a lncRNA-DEmiRNA-DEG regulatory network using different datasets and databases and identified hub genes based on WGCNA in sepsis. Then, we used the CIBERSORT algorithm to analyze the differences in peripheral blood immune cells and immune checkpoint gene expression levels between sepsis and control patient groups. An increasing number of studies have shown that ferroptosis plays a significant role in the progression of sepsis (Qiongyue et al., 2022). The present study indicated that lncRNA ZFAS1 may play an important role in ferroptosis and sepsis progression. Finally, we explored the value of identified hub genes in the diagnosis and prognosis of sepsis using a validation set.
As sepsis is primarily characterized by a dysregulated host response to infection, disruption of the neuroimmune crosstalk may lead to a worse prognosis in sepsis (LaFavers, 2022). Our study showed that macrophages, monocytes, neutrophils, resting mast cells, activated mast cells, and dendritic cells were increased in the whole blood of patients with sepsis. Monocytes, neutrophils, and macrophages play a particularly key role in the pathogenesis of sepsis (Kumar, 2018). The production of inflammatory cytokines and nitric oxide by macrophages may contribute to vascular dysfunction in septic shock. Owing to the inability of the immune system to control invading pathogens in sepsis, inappropriately functioning macrophages can lead to sepsis progression and organ damage. A previous study showed that macrophages, along with neutrophils, make up an increasingly large proportion of CD45+ immune cells among endothelial cells following a single bolus LPS injection and that they are among the first responders along with endothelial and stromal cells (Janosevic et al., 2021). Therefore, the immune response in sepsis can result in the recruitment of immune cells to the endothelial cells. This results in the release of inflammatory cytokines that destroy the endothelial cells.
In the last decade, the role of ferroptosis in the pathophysiology of sepsis progression has received much attention. Some studies have revealed that ferroptosis inhibitors can repress AKI caused by sepsis effectively (Ma et al., 2021; Martin-Sanchez et al., 2017). Regulation of iron metabolism can play a role in inhibiting inflammation, reducing oxidative stress and cell damage caused by iron overload, and iron disorders. There have been several studies on the role of lncRNA in ferroptosis during sepsis. In this study, we identified three ferroptosis-related lncRNAs involved in sepsis. We determined the expression levels of these three lncRNAs in HUVECs treated with LPS using quantitative real-time PCR. It was found that only lncRNA ZFAS1 had a significant difference in expression between the control and the LPS-treated groups. In a study by Yang et al., lncRNA ZFAS1 was found to promote lung fibroblast-to-myofibroblast transition and ferroptosis (Yang et al., 2020). Ni et al. found that lncRNA ZFAS1 can promote cardiomyocyte ferroptosis and diabetic cardiomyopathy development (Ni et al., 2021). In addition, Liu et al. found that the ZFAS1/miR-7-5p/ACSL4 axis may serve as a therapeutic target for endothelial dysfunction in diabetic retinopathy (Liu et al., 2022). Therefore, lncRNA ZFAS1 may play a role in the ferroptosis of vascular endothelial cells in sepsis; we will confirm this hypothesis through subsequent studies.
In the present study, we identified six DEGs from a sepsis ceRNA network as key genes. ROC and KM analyses of these six genes showed remarkable results for the prognosis of sepsis in the validation set. However, univariate and multivariate Cox regression analyses showed that only SLC26A6 was an independent predictor of sepsis prognosis. Solute Carrier Family 26 (SLC26) is a conserved anion transporter family with 10 members in humans (SLC26A1-A11, with A10 being a pseudogene) (Wang et al., 2020). SLC26A6, which is located on chromosome 3, is a transmembrane secondary transporter (transporter and exchanger) with a molecular mass of 83 kDa and 759 amino acids. Previous studies have found the expression of SLC26A6 to be associated with kidney stone formation, but its precise role in human diseases remains unknown (Landry et al., 2016; Ohana et al., 2013). Research on CNIH4 has been rare. In the study by Wang et al., CNIH4 was identified as a novel molecular marker that can predict the overall survival of patients with hepatocellular carcinoma (Wang et al., 2021). TRIB1 is a key regulator of macrophage differentiation in AKI progression. By affecting macrophage polarization, TRIB1 plays an important role in kidney recovery and regeneration via the regulation of renal tubular cell proliferation (Xie et al., 2020). The role of TRIB1 in sepsis needs further study. DOK3 also plays a role in AKI by regulating apoptosis and inflammation. Yang showed that DOK3 exacerbated cisplatin-induced AKI (Yang et al., 2021b). There have also been rare reports about the association of ANKRD22 and GRB10 with sepsis.
There were several limitations to this study. First, as no dataset related to AKI in sepsis exists, the role of the six hub genes identified by us in AKI needs to be further studied through clinical research. Second, though our findings revealed that lncRNA ZFAS1 is highly expressed in LPS-treated endothelial cells and may play a role in endothelial cell injury, whether lncRNA ZFAS1 plays a role in the ferroptosis of endothelial cells needs further experimentation. Third, the prognostic and diagnostic value of the six hub genes identified by us in adults with septic AKI needs further validation.
Conclusions
The ceRNA network constructed here contains 94 mRNAs, 7 miRNAs, and 18 lncRNAs, using data from a variety of databases. We also demonstrated that the ZFAS1/hsa-miR-449c-5p/SLC26A6 ceRNA regulatory axis may play a role in sepsis. We expect that the findings of our study will lead to the identification of biomarkers and therapeutic targets for the management of sepsis. In light of the bioinformatic analysis used in this study, further clinical research is required to confirm its conclusions.
Footnotes
Ethical Approval and Consent
Humans and animals were not involved in this study, so the ethical approval and consent are not applicable.
Availability of Data and Materials

Authors’ Contributions
Q.F. conceived the study. Y.L. designed the study. J.F. and Q.F. acquired and analyzed the data. Z.X., X.L., and C.Z. contributed the analysis tools. Q.F. wrote the article. L.T. and Y.L. were of immense help in the preparation of the article. All authors read and approved the final article. Q.F. had an equal contribution along with Y.L.
Author Disclosure Statement
The authors do not have any competing interests to declare.
Funding Information
This study was supported by the Medical and Health research Project of Zhejiang province (ID:2022499885 and 2022505672).