
Abstract
Abstract
Moore, G. W. K., and J. L. Semple. Freezing and frostbite on Mount Everest: new insights into wind chill and freezing times at high altitude. High. Alt. Med. Biol. 12:271–275, 2011.—Cold injury is an acknowledged risk factor for those who venture into high altitude regions. There is, however, little quantitative information on this risk that can be used to implement mitigation strategies. Here we provide the first characterization of the risk of cold injury near the summit of Mount Everest. This is accomplished through the application of a meteorological dataset that has been demonstrated to characterize conditions in the region as inputs to new parameterizations of wind chill equivalent temperature (WCT) and facial frostbite time (FFT). Throughout the year, the typical WCT near the summit of Everest is always <−30°C, and the typical FFT is always less than 20 min. During the spring climbing season, WCTs of −50°C and FFTs of 5 min are typical; during severe storms, they approach −60°C and 1 min, respectively; values typically found during the winter. Further, we show that the summit barometric pressure is an excellent predictor of summit WCT and FFT. Our results provide the first quantitative characterization of the risk of cold injury on Mount Everest and also allow for the possibility of using barometric pressure, an easily observed parameter, in real time to characterize this risk and to implement mitigation strategies. The results also provide additional confirmation as to the extreme environment experienced by those attempting to summit Mount Everest and other high mountains.
Introduction
A comprehensive analysis of mortality on Mount Everest found that, in the deaths that occurred above 7000 m, adverse weather conditions were a contributing factor in approximately 25% of the cases (Firth et al., 2008). Analysis of the 1924 Mallory and Irvine attempt to summit Mount Everest (Moore et al., 2010), as well as the 1996 Into Thin Air storm (Moore and Semple, 2006), reported that large drops in barometric pressure occurred during these events, which were associated with high winds, blowing snow, and cold temperatures. On Denali, the highest mountain in North America, hypothermia is the second leading cause of death, with 16% of all fatalities being attributed to this cause (McIntosh et al., 2008). Half of these fatalities occurred during a single storm in 1967 (Wilson et al., 1978). In addition, it has been reported that strong winds, snow, and cold temperatures are often associated with mountain deaths in the Pyrenees (Pascual and Callado, 2010).
Research into quantifying the combined impact of wind and low temperatures on the cooling of exposed skin has been ongoing for over 60 yr (Siple and Passel, 1945; Osczevski and Bluestein, 2005). Two important metrics that have been developed are the wind chill equivalent temperature (WCT), defined as the temperature in still air that would result in the same steady- state facial heat loss as occurs at a given temperature and wind speed; and facial frostbite time (FFT), defined as the time it takes facial flesh to freeze (Tikuisis and Osczevski, 2003; Osczevski and Bluestein, 2005). Joint work by the American and Canadian Weather Services has recently resulted in the development of new expressions for WCT and FFT; these combine results from wind tunnel studies of heat loss from human subjects with model studies of the heat transfer from the human face (Office of the Federal Coordinator for Meteorological Research, 2003). These new expressions are currently being used for forecasting purposes in the two countries (Osczevski and Bluestein, 2005).
Methods
We used the National Centers for Environmental Prediction (NCEP) Reanalysis (Kalnay et al., 1996), a meteorological dataset that captures the large-scale atmospheric flow in the vicinity of Mount Everest (Moore and Semple, 2004; Moore and Semple, 2006), to derive a time series of wind speed and temperature at the mountain's summit. In this article, we use the data for the 62-yr period from 1948 to 2009. With these time series, we used the expressions for WCT and FFT shown in Table 1 to calculate the climatological mean annual cycle for these parameters, thereby providing an estimate of their mean values throughout the year. In addition, we considered the temporal evolution in these parameters during the May 1996 Into Thin Air storm, the deadliest storm in Everest's history during which 8 climbers died near its summit (Krakauer, 1999; Moore and Semple, 2006).
Results
Figure 1 shows the annual cycle in WCT and FFT at the summit of Mount Everest based on daily mean climatological values. It indicates that at the summit of Mount Everest the mean WCT is always lower than −30°C and the mean FFT is always <20 min, with the lowest values occurring during the winter months when the mean WCT approaches −65°C and the mean FFT is less than 1 min. During May, when most summit attempts occur, climbers typically experience WCTs of −45°C and FFTs of 7 min.
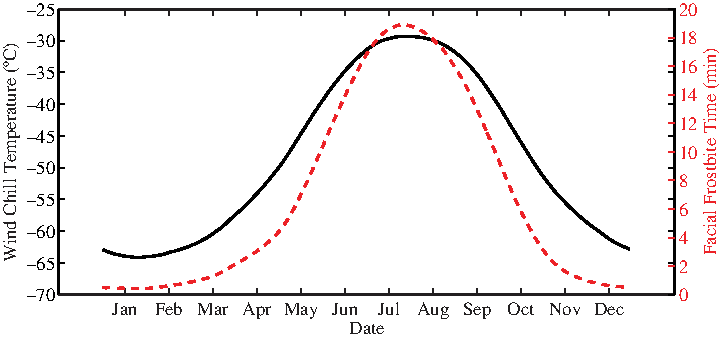
Annual cycle of wind chill temperature (black lines) and facial frostbite time (red dashed lines) at the summit of Mount Everest based on data from 1948 to 2009.
Figure 2 shows the scatter plots of the daily mean climatological WCT and FFT against the daily mean climatological summit barometric pressure.The multivalued behavior of both scatter plots reflects different dependencies during the spring and fall seasons, with the fall being the period of the year during which the WCT and FFT are lower for a given barometric pressure. Despite this behavior, an exponential relationship exists between both the cold injury parameters and the summit barometric pressure. The root-mean-square errors in the relationships are 1.1°C and 1.3 min for WCT and FFT, respectively.
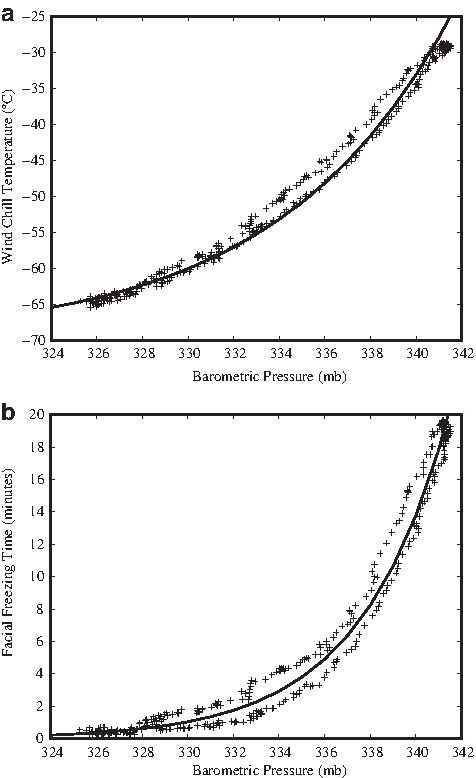
Scatter plot of (a) the daily mean climatological wind chill temperature (oC) and (b) the daily mean climatological facial freezing time (min) versus the daily mean climatological barometric pressure (mbar). Solid curves represent least-squares exponential fits.
Figure 3 shows the time series of the WCT and FFT during the Into Thin Air storm of May 1996. The storm was at its most severe on May 10 and 11, and during this period the WCT and FFT were as low as −57°C and 1 min, respectively. These values are substantially lower than the mean values for this period and approach the values representative of winter conditions on the mountain (Fig. 1).
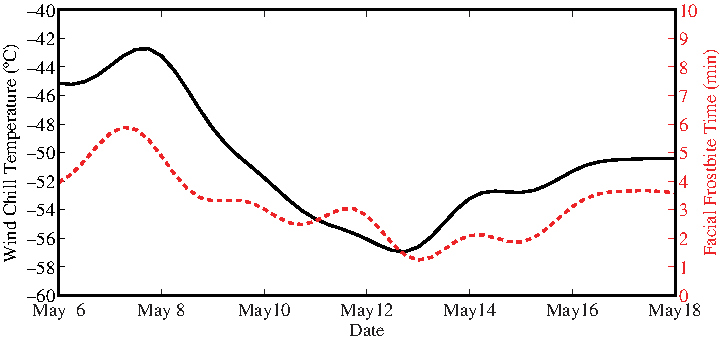
Time series of daily mean wind chill temperature (black lines) and facial frostbite time (red dashed lines) during the Into Thin Air storm in May 1996. The storm was at its most intense on May 10 and 11.
Discussion
Our results (Fig. 1) indicate that WCT and FFT typically found near the summit of Mount Everest characterize it as a region where the risk of cold injury is very high (Dery and Yau, 1999; Tikuisis and Osczevski, 2003; Osczevski and Bluestein, 2005). Given the close proximity of Mount Everest to other high mountains in the Himalaya, it is expected that the elevated risk of cold injury is common to these summits as well. These results quantify and provide confirmation for the experience on these mountains of an elevated risk of hypothermia and frostbite (Ward, 1974; Subedi et al., 2010).
A relationship between summit barometric pressure and both the summit WCT and FFT has been identified (Fig. 2). Low barometric pressures are typically associated with stormy conditions, characterized on Mount Everest by high wind speeds and cold temperatures (Moore and Semple, 2004; Moore and Semple, 2006). It is therefore reasonable that such relationships exist, with their exponential character reflecting the nonlinear dependence of WCT and FFT on temperature and wind speed (Table 1). Given the relative ease with which the barometric pressure can be measured and forecast, the relationships identified in Fig. 2 can be used to estimate the risk of cold injury in real time or for historical retrospectives.
The exponential relationship between the cold injury parameters and barometric pressure also emphasizes the greater risk of cold injury during high-impact storms. During the Into Thin Air storm, the daily mean values of WCT and FFT (Fig. 3) approach levels typically found during the winter months.
Extremities freeze at a rate up to eight times that of facial skin (Tikuisis, 2004), and climbers are therefore acutely at risk of suffering frostbite on their hands and feet, as has been reported (Harirchi et al., 2005; Subedi et al., 2010). The common occurrence of high winds at high altitudes (Moore and Semple, 2006) therefore suggests that individuals at high altitude are at a greater risk of cold injury than previously thought (Huey and Eguskitza, 2001). This risk is elevated during adverse conditions when an individual fatigues and slows. The ensuing drop in heat production results in peripheral vasoconstriction to preserve core temperature, an effect that can rapidly predispose extremities to frostbite (Ward, 1974; Ainslie and Reilly, 2003).
It is important to recognize that the WCT and FFT expressions were derived at sea level, and several cautions apply to their use at high altitude. For example, convective heat loss from the body is proportional to the square root of the Reynolds number, which depends on the product of the air density and wind speed (Tikuisis and Osczevski, 2002). At the summit of Mount Everest, the density is approximately 38% that at sea level. The expressions for WCT and FFT (Table 1) are based on the wind speed 10 m above the surface and assume a reduction of 33% to take into account the lower wind speeds, resulting from frictional effects in the surface boundary layer, that one would observe at the typical height of a human head (Ahmad and Boraas, 2010). This reduction assumes a laminar boundary layer that only occurs in the absence of obstacles. In their presence, as would occur in regions of complex topography such as the summit region of high mountains, the boundary layer is turbulent and the reduction is close to zero (Ahmad and Boraas, 2010). As a result, we would expect in mountainous regions that the wind speeds would be larger by a factor of ∼1/(1−0.33) or ∼1.5 those assumed in the expressions in Table 1. As a result, we would expect heat loss at the summit of Mount Everest to be:
These results provide the first characterization of WCT and FFT near the summit of Mount Everest and allow for the possibility of using summit barometric pressure to characterize the risk of cold injury. Performance in severe cold at extreme altitude is not merely the ability to conduct routine mountaineering tasks, but must also include awareness of risk situations and the capacity to avoid accidents and to function under conditions of cold stress, hypoxia, and fatigue. Our results provide additional confirmation as to the extreme environment experienced by those attempting to summit the mountain. They underscore the importance of appropriate clothing, equipment, knowledge of conditions, and limited exposure to high-impact storms, as well as offer a warning that cold injury is a significant risk even in less extreme high altitude environments.
Footnotes
Acknowledgments
The authors would like to thank the Physical Sciences Division of NOAA in Boulder Colorado for access to the NCEP Reanalysis. Author Moore was supported by the Natural Sciences and Engineering Research Council of Canada.
Disclosures
The authors have no conflicts of interests or financial ties to disclose.