
Abstract
Abstract
Slingo, Mary E., Fionna S. J. Lowe, Andrew R. P. Pieri, Chris H. E. Imray, The British Schools Exploring Society. Visual analogue self-assessment of acute mountain sickness in adolescents: Experience from two Himalayan Expeditions. High Alt Med Biol. 13:185–192, 2012.—
Methods:
The study was conducted during the 2009 and 2010 British Schools Exploring Society 35-day expeditions to Ladakh. Comparable ascent profiles were followed, reaching a maximum altitude of 6000 m. LLS and VAS AMS scores were recorded each morning. VAS comprised 100 mm lines for each LLS symptom; VAS scores were summed to give a composite daily total (VAS(c), expressed as a percentage). In 2010, an additional line was used to score overall “altitude sickness' (VAS(o)).
Results:
42 individuals participated in 2009 (83% compliance; mean age 17.4 years); 28 in 2010 (82% compliance; 17.5 years). 759 data points were recorded in 2009; 529 in 2010. There was a significant correlation between LLS and VAS(c) on both expeditions (rho=0.80, p<0.001 in 2009; rho=0.65, p<0.001 in 2010). These significant correlations remained when cases of AMS were analyzed separately. However, in all cases, the relationship between LLS and VAS was distorted, with a tendency for VAS to underscore symptoms of AMS when LLS<5. A VAS(c) value of 5.5% had an 82% specificity and sensitivity for all cases of AMS; VAS(c) of 9.5% had a 90% specificity and sensitivity for moderate and severe AMS.
Conclusions:
Whilst adolescents are capable of self-monitoring for AMS using VAS, the relationship with LLS is distorted. The LLS, despite its limitations, therefore remains the preferred method for the self-assessment of AMS in adolescents.
Introduction
Visual analogue scales (VAS) have been proposed as an alternative to the LLS in several recent studies.4–7 VAS comprise a horizontal 100 mm line, on which the user draws a single slash mark to represent the severity of the relevant symptom. VAS are simple to use, require little written language, and provide a continuous measure of symptom severity (in contrast to the categorical LLS). Their use has become commonplace in many areas of medicine, particularly in the assessment and management of pain.8,9 It is possible that VAS may provide a better, more user-friendly, measurement of AMS.
Whilst several studies have investigated the role of VAS in the assessment of AMS,4–7 all of these included a wide range of participants and the age of the subjects was particularly variable. None focused solely on adolescents, yet it is possible that younger individuals are those for whom VAS is a better alternative to the LLS. Whilst it has been demonstrated that adolescents are capable of self-reporting using the LLS, 10 no study has investigated the possible role of VAS. The British Schools Exploring Society (BSES) expeditions provide a unique opportunity for investigating, over several years, with comparable ascent profiles, the responses to altitude that are seen in a large group of adolescents with very similar demographics.
We therefore sought to investigate the role of VAS in the assessment of AMS in adolescents, using two separate expeditions as an opportunity for further validation of the data. In 2009, we aimed to investigate whether an individual VAS (VAS (i)) for each symptom category would correlate with the corresponding LLS symptom score. We then sought to create a composite VAS (VAS (c)), which was the sum of the separate VAS (i) scores, and also to investigate whether this correlated with the total LLS. In 2010, we included an additional VAS (VAS (o)) that was used to measure an individual's overall “altitude sickness.” We also aimed to investigate whether the relationships between LLS and VAS differed in individuals with AMS. Finally, we set out to define a cut-off point for the diagnosis of AMS using the VAS (c).
Methods
Study setting and participants
The study was conducted during the 2009 and 2010 BSES expeditions to the Himalayan region of Ladakh, India. Both expeditions lasted 35 days and involved trekking and mountaineering to a maximum altitude of 6000 m, with comparable ascent profiles. The study participants were recruited at a preparation weekend held several months before departure. Education sessions were held, so that participants knew and understood the symptoms of AMS, why careful monitoring was important, and how to use the data collection booklets and VAS. These sessions were repeated at the beginning of the expeditions. The participants and their parents/guardians gave their informed, written consent to participate in the study. Written approval for the study was obtained from the Coventry and Warwickshire Research and Ethics Committee.
Data collection
Each participant was given a booklet containing abbreviated Lake Louise questionnaires for each day of the expedition. Corresponding VAS were also included in the booklet, and the latter was printed in a way to make it difficult to compare the LLS and VAS during completion (to prevent ‘copying’ of scores). The booklets were completed each morning, before breakfast or any strenuous activity. The VAS (i) comprised five separate 100 mm lines, with the word “none” at the left-hand end of the line, and “worst” at the right-hand end. There were no other marks or divisions on the lines. Subjects were asked to make a single slash mark on the line at the point that best represented how they felt for each symptom on that day. The VAS (o) also comprised an individual 100 mm line, and subjects were asked to place a single slash mark on this at the point representing how their overall “altitude sickness” felt on that day.
One of the investigators measured all VAS for both years by measuring the distance, in mm, from the left end of the line to the slash mark. This investigator was blinded to the identity of the subject whose VAS was being measured. LLS and VAS were processed separately, so that the investigator was also blinded to the corresponding LLS for each VAS measurement. VAS (c) was calculated as the sum of the five VAS (i) (a total ranging from 0 to 500 mm) and expressed as a percentage of the maximal total possible. AMS was defined as the presence of a headache and an LLS of 3 or more. Mild AMS was defined as LLS 3 and 4, moderate as LLS 5 and 6, and severe as 7 and above.
2009 and 2010 data were kept separate for the initial analysis of LLS versus VAS (o) and VAS (c). The comparable ascent profiles and demographics allowed subsequent combination of the data from both expeditions, enabling sub-analysis to be performed on individual LLS symptoms and on cases of AMS. Combined data were also used to determine a diagnostic cut-off point on the VAS (c) for AMS. Sub-analysis of the first three days of the expeditions was also possible—both parties initially flew from Delhi to Leh (3500 m) and spent three subsequent days at this altitude. Since most cases of AMS occurred during this time period, and as any learning bias (from repeated use of the LLS and VAS) would have been low, sub-analysis of these three days in Leh was also performed.
Statistical analysis
Spearman's and Kendall's rank correlation tests (rho and tau, respectively) were used to compare all LLS and VAS. Similar to a previous study, 6 we used receiver operator characteristic (ROC) curves to determine the optimal cut-off point on the VAS (c) for the diagnosis of AMS. We chose to assess the performance of VAS (c) as a diagnostic tool for AMS using two LLS thresholds—headache and either LLS≥3 or LLS≥5. We classified individuals as having, or not having, AMS, and ROC curves were then generated and the area under the curve (AUC) analyzed. Decision plots of sensitivity and specificity (y axis) for all VAS (c) levels (x axis) were generated and crossing point of the curves used to determine the optimal VAS (c) cut-off point. Results were considered significant at p<0.05. Data were processed using Excel (Microsoft, USA) and SPSS 19 (IBM, USA).
Results
Subject characteristics
42 individuals (nine female) participated in the 2009 expedition, with 35 of these (mean age 17.4 years, median age 17, range 16–21; seven female) returning completed booklets (83% compliance) containing a total of 759 LLS and corresponding VAS. 28 individuals (six female) participated in the 2010 expedition with 23 of these (mean age 17.5 years, median age 17, range 17–20; six female) returning completed booklets (82% compliance) containing a total of 529 LLS and corresponding VAS. Several individuals were evacuated, for medical reasons, from the expedition early and this explains the loss of their booklets.
Overall relationships between LLS, VAS (c) and VAS (o)
The relationships between LLS, VAS (c) and VAS (o) for both expeditions (analyzed separately) are summarized in Table 1. Figures 1a–1c illustrate these relationships; all data points are included for analysis (759 for 2009; 529 for 2010). There was a significant correlation between VAS (c) and LLS in both 2009 and 2010 (rho=0.80, tau=0.70, p<0.001; and rho=0.65, tau=0.53, p<0.001, respectively, Figs. 1a and 1b). In 2010, there was also a significant correlation between VAS (o) and LLS (rho=0.52, tau=0.44, p<0.001, Fig. 1c). However, in all cases, the relationship between LLS and VAS was distorted. Rather than clustering around the theoretical line of identity, the data points (particularly for LLS<5) tended to fall below it. In other words, for low LLS scores the VAS tended to underscore AMS symptoms. Finally, there was also a strong correlation between VAS (c) and VAS (o) (rho=0.78, tau=0.66, p<0.001).
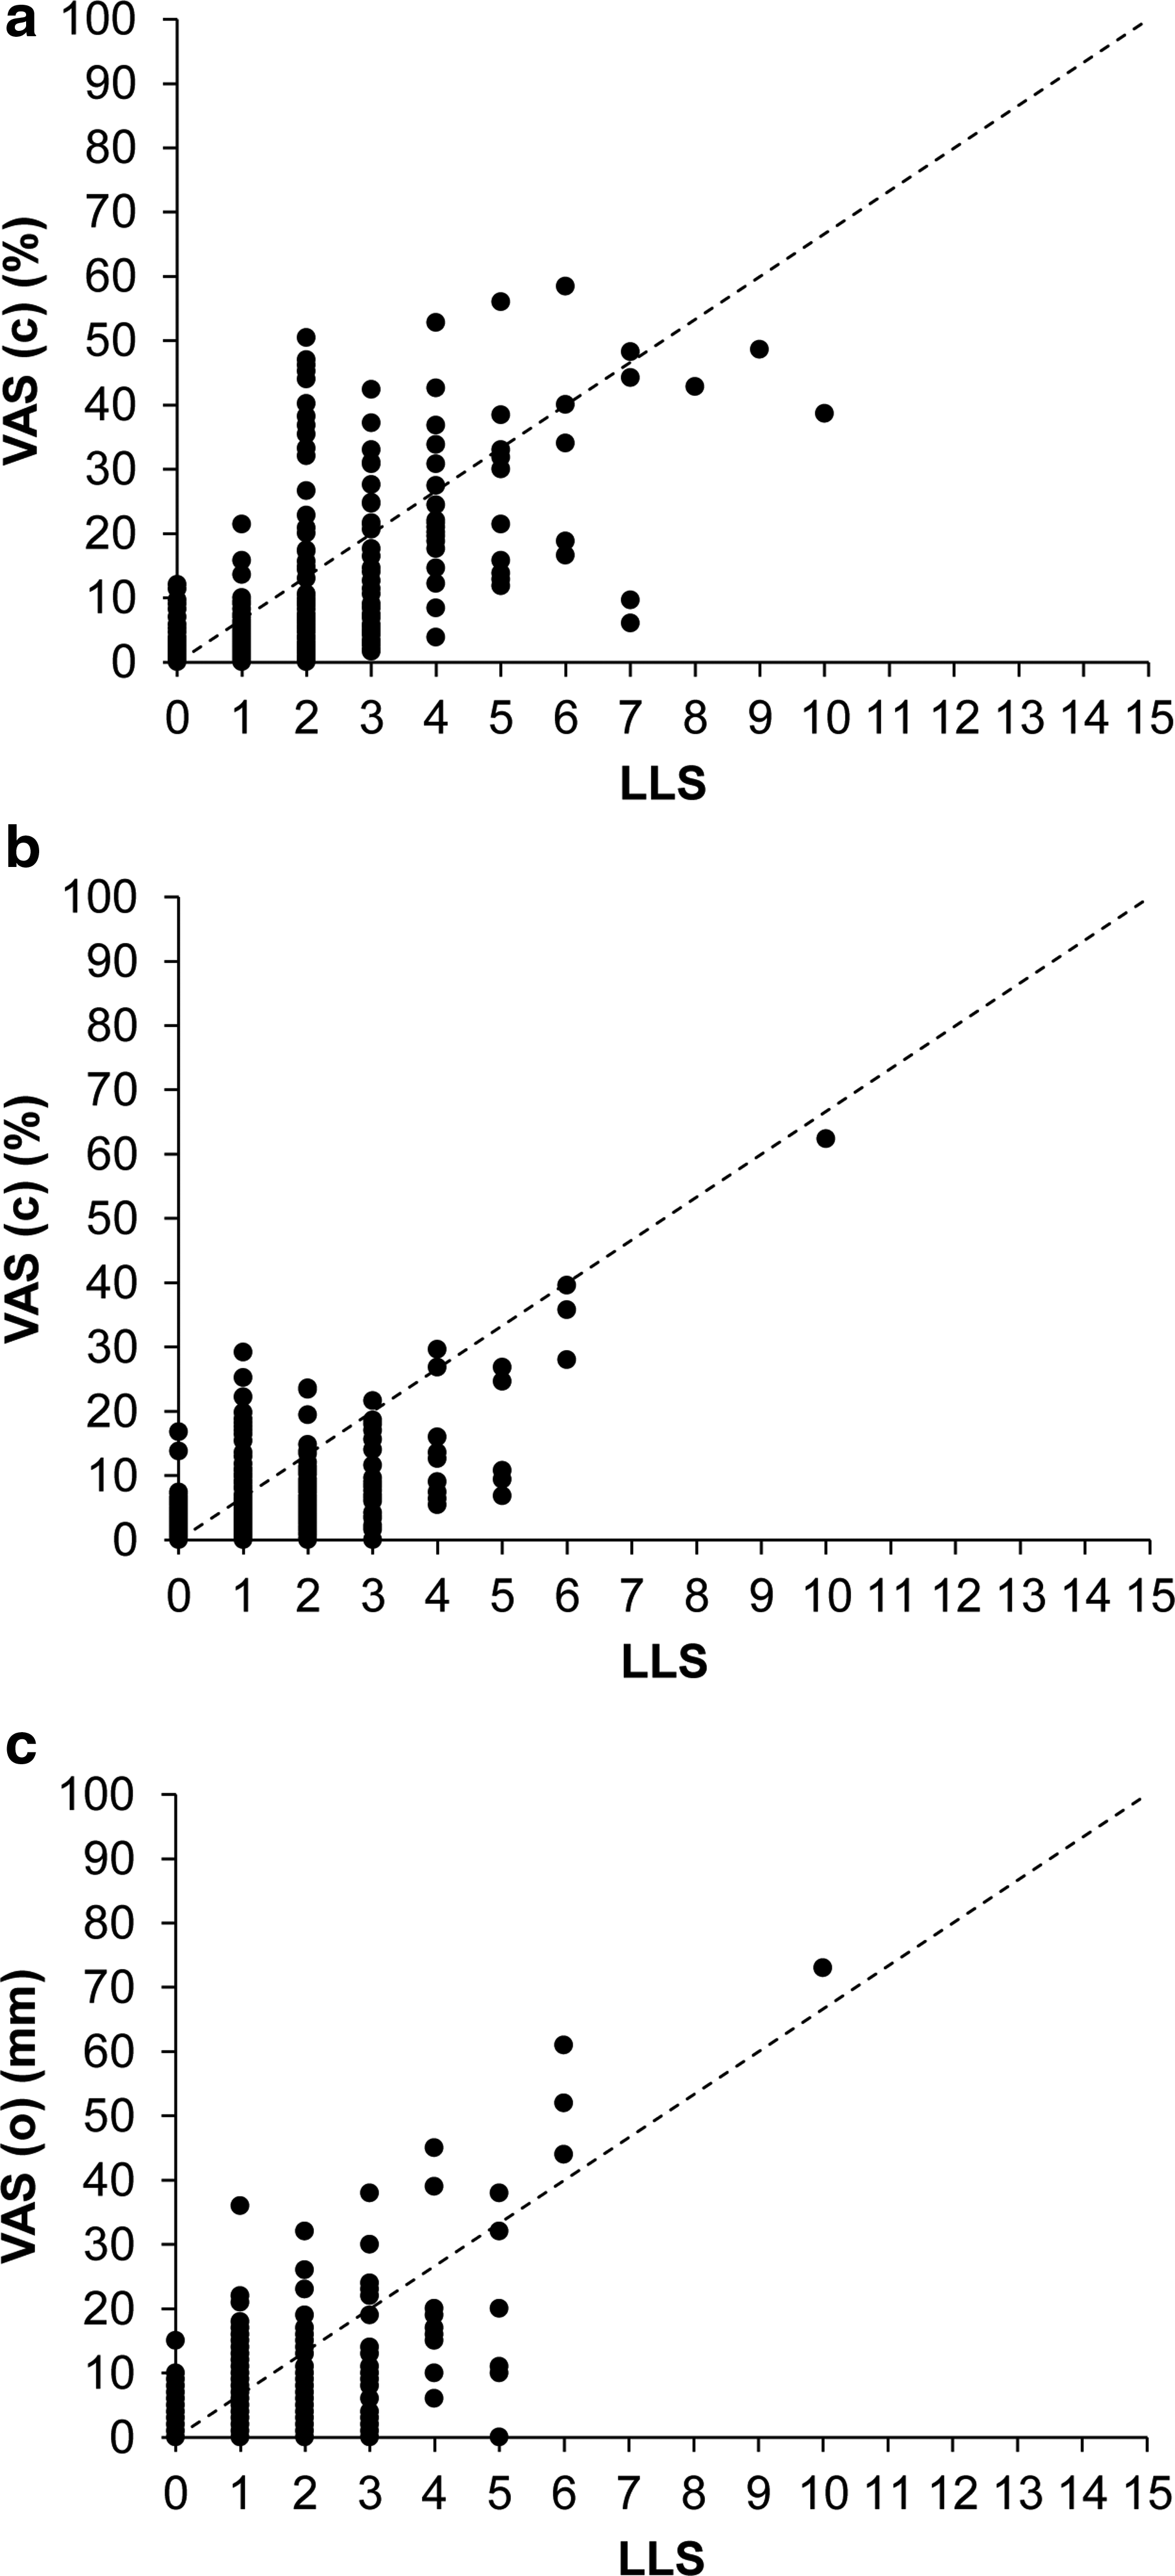
Relationship between LLS and VAS, in 2009 and 2010. Solid circles represent all individual data points (LLS against corresponding VAS). Dashed line represents the line of identity.
LLS, Lake Louise AMS Self-Report Score; VAS, visual analogue scale; VAS (c), composite VAS; VAS (o), overall VAS; VAS (i), individual symptom VAS; AMS, acute mountain sickness; rho, Spearman's rank correlation coefficient; tau, Kendall's rank correlation coefficient; R2, coefficient of determination.
LLS and VAS (c) data are shown for both 2009 and 2010. VAS (o) was only measured in 2010. 2009 and 2010 data are combined for the AMS scores, and for the individual symptom scores.
There was considerable noise in the data, with a wide range of VAS (c) and VAS (o) for a given LLS. There was also considerable variability in an individual's use of the VAS. For example, some individuals (exemplified in Fig. 2a) were quite consistent in their responses, in that a particular LLS would result in a similar VAS on different days of testing. In contrast, some individuals (exemplified in Fig. 2b) were less consistent.
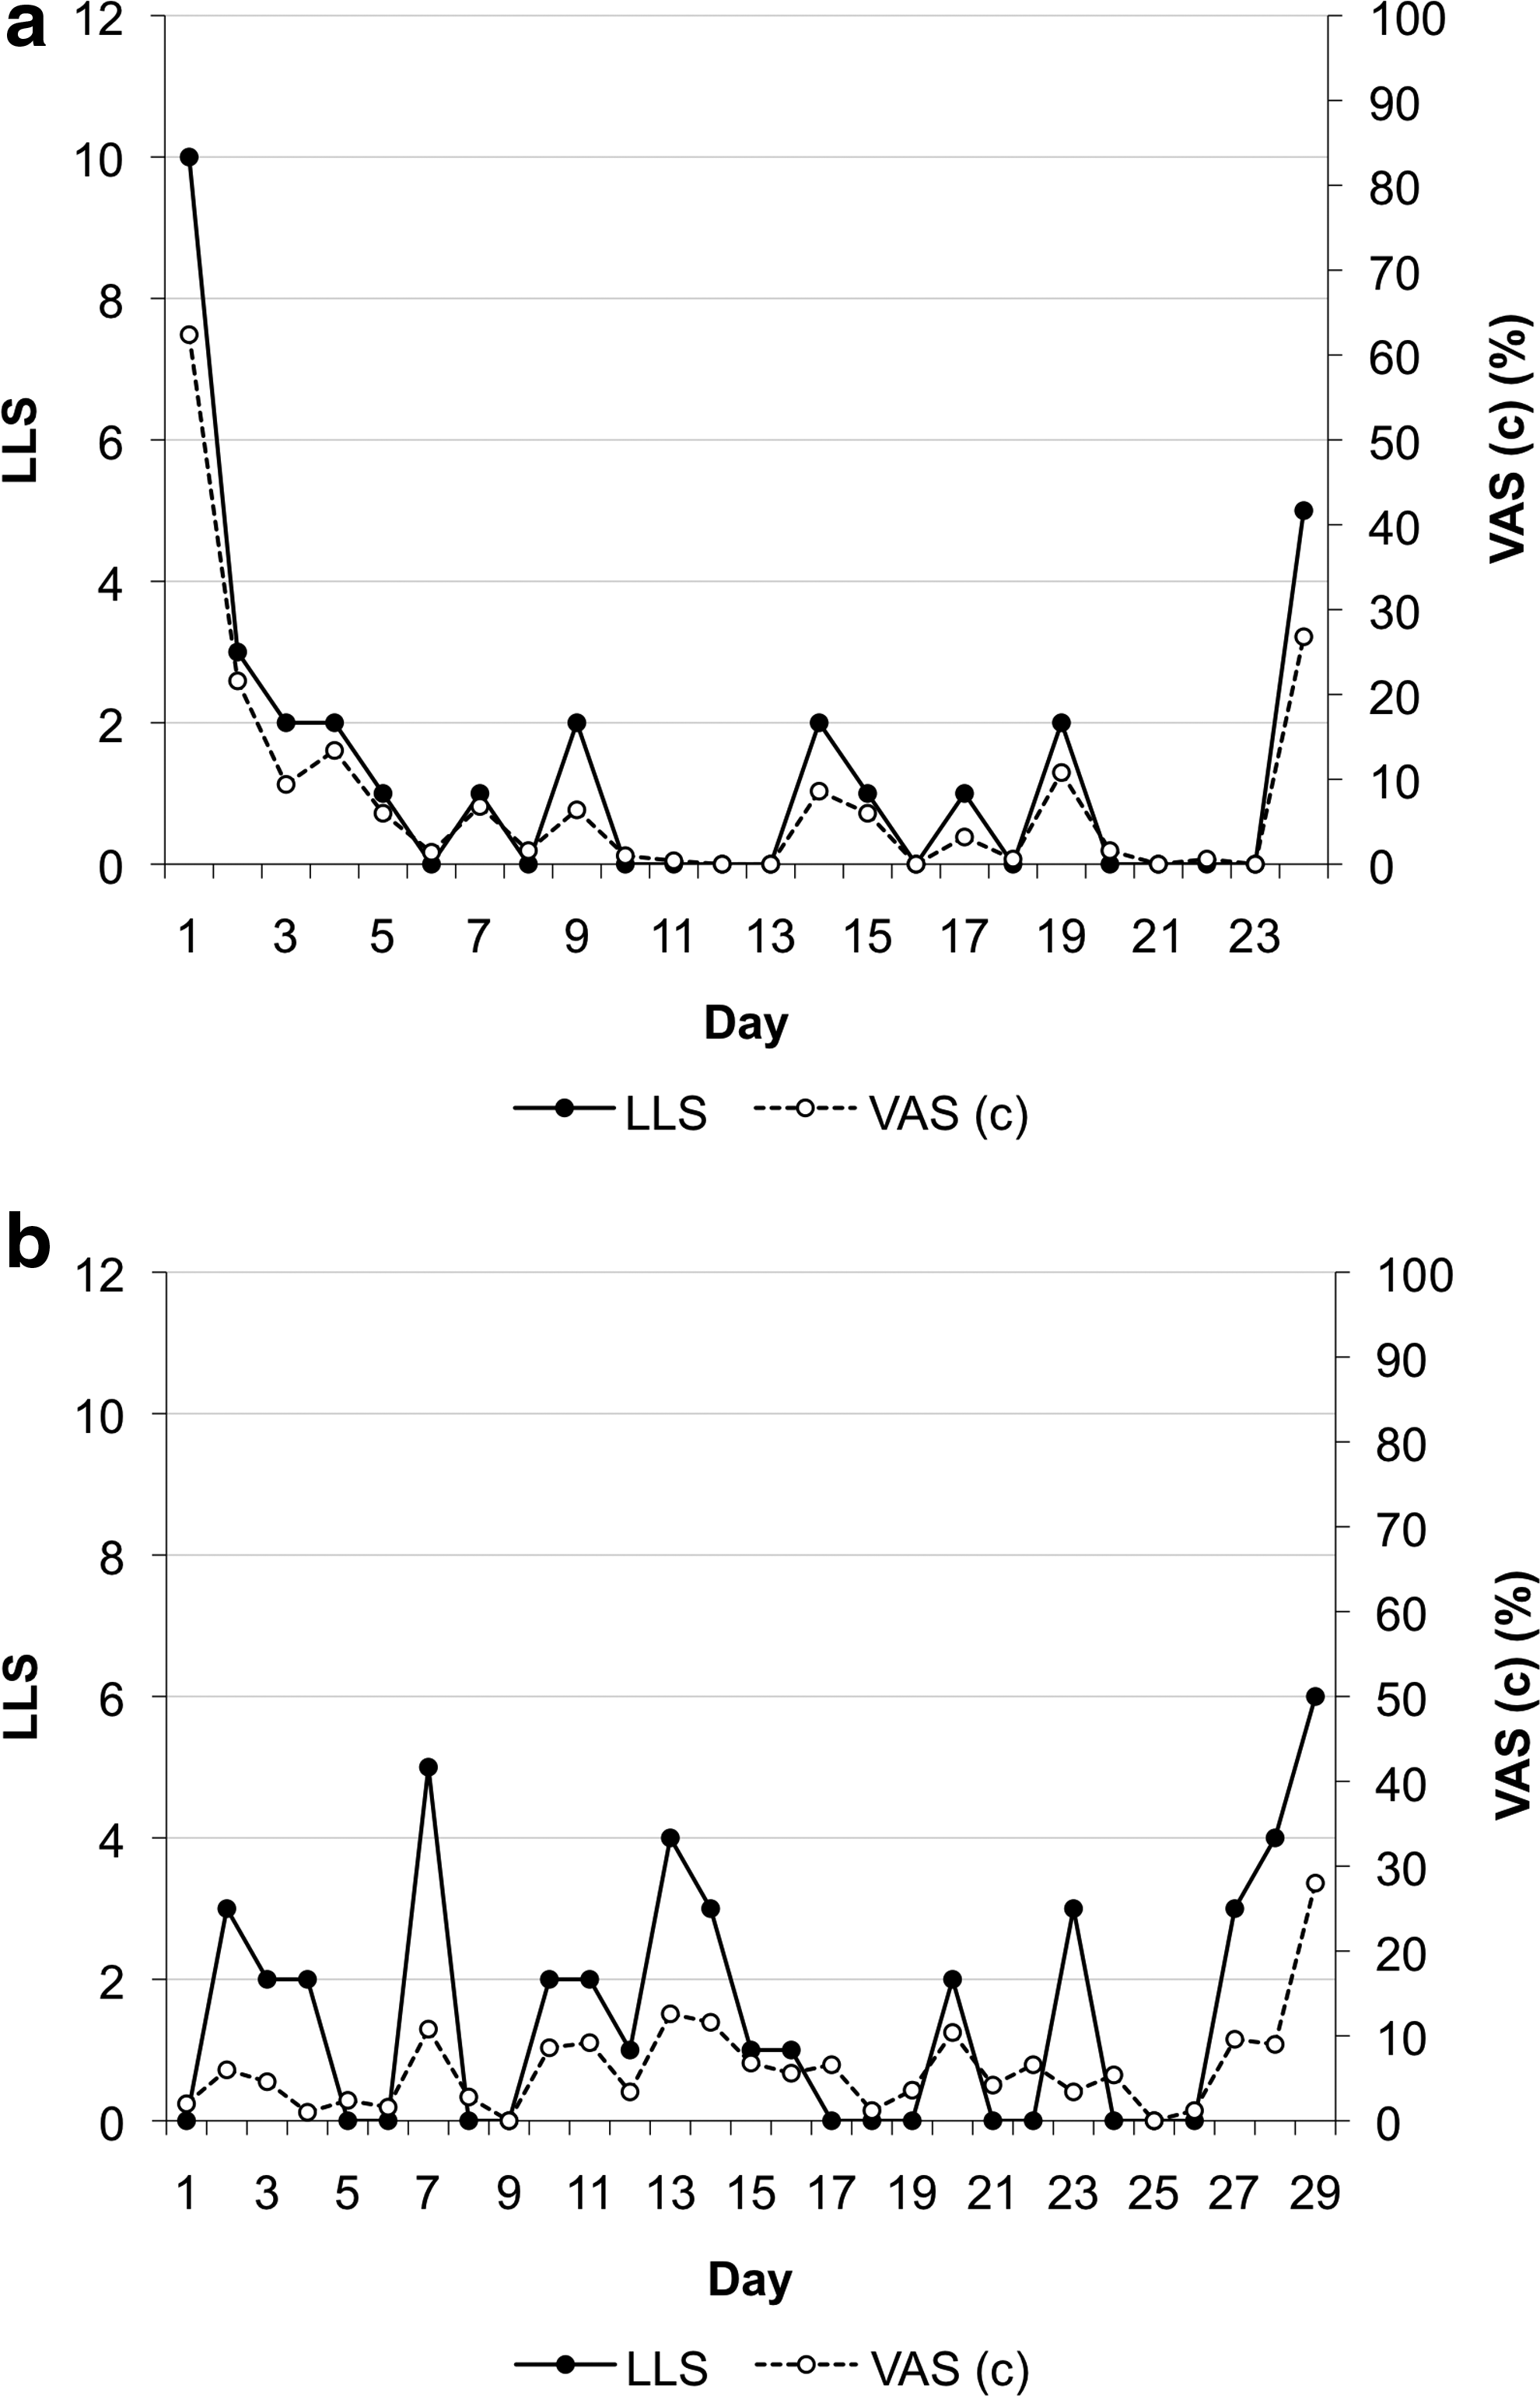
Example of individual LLS and VAS (c) over the course of the expedition. Solid circles and solid line represent LLS. Open circles and dashed line represent the corresponding VAS (c) for each LLS. One data point per day of expedition; the number of days is different as data were variably recorded at the end of the expedition (during descent).
Relationship between LLS and VAS (c) for the 3 days at Leh (3500 m)
Daily use of the VAS may have resulted in a learning bias. We therefore performed a sub-analysis of the first three days after arrival at Leh (3500 m) from sea level. As this ascent was identical in both 2009 and 2010, data were combined to increase power. 171 data points from 58 individuals were recorded. Of these, 23 individuals (14 in 2009; 9 in 2010) developed AMS, with 32 corresponding LLS and VAS (c) completed. These data are summarized in Table 1 and Figure 3a. Once again, there was a significant correlation between LLS and VAS (c) (rho=0.72, tau=0.58, p<0.001). However, while there was still distortion to the relationship (with similar underscoring of symptoms for LLS<5) it was less marked when compared to Figures 1a and 1b.
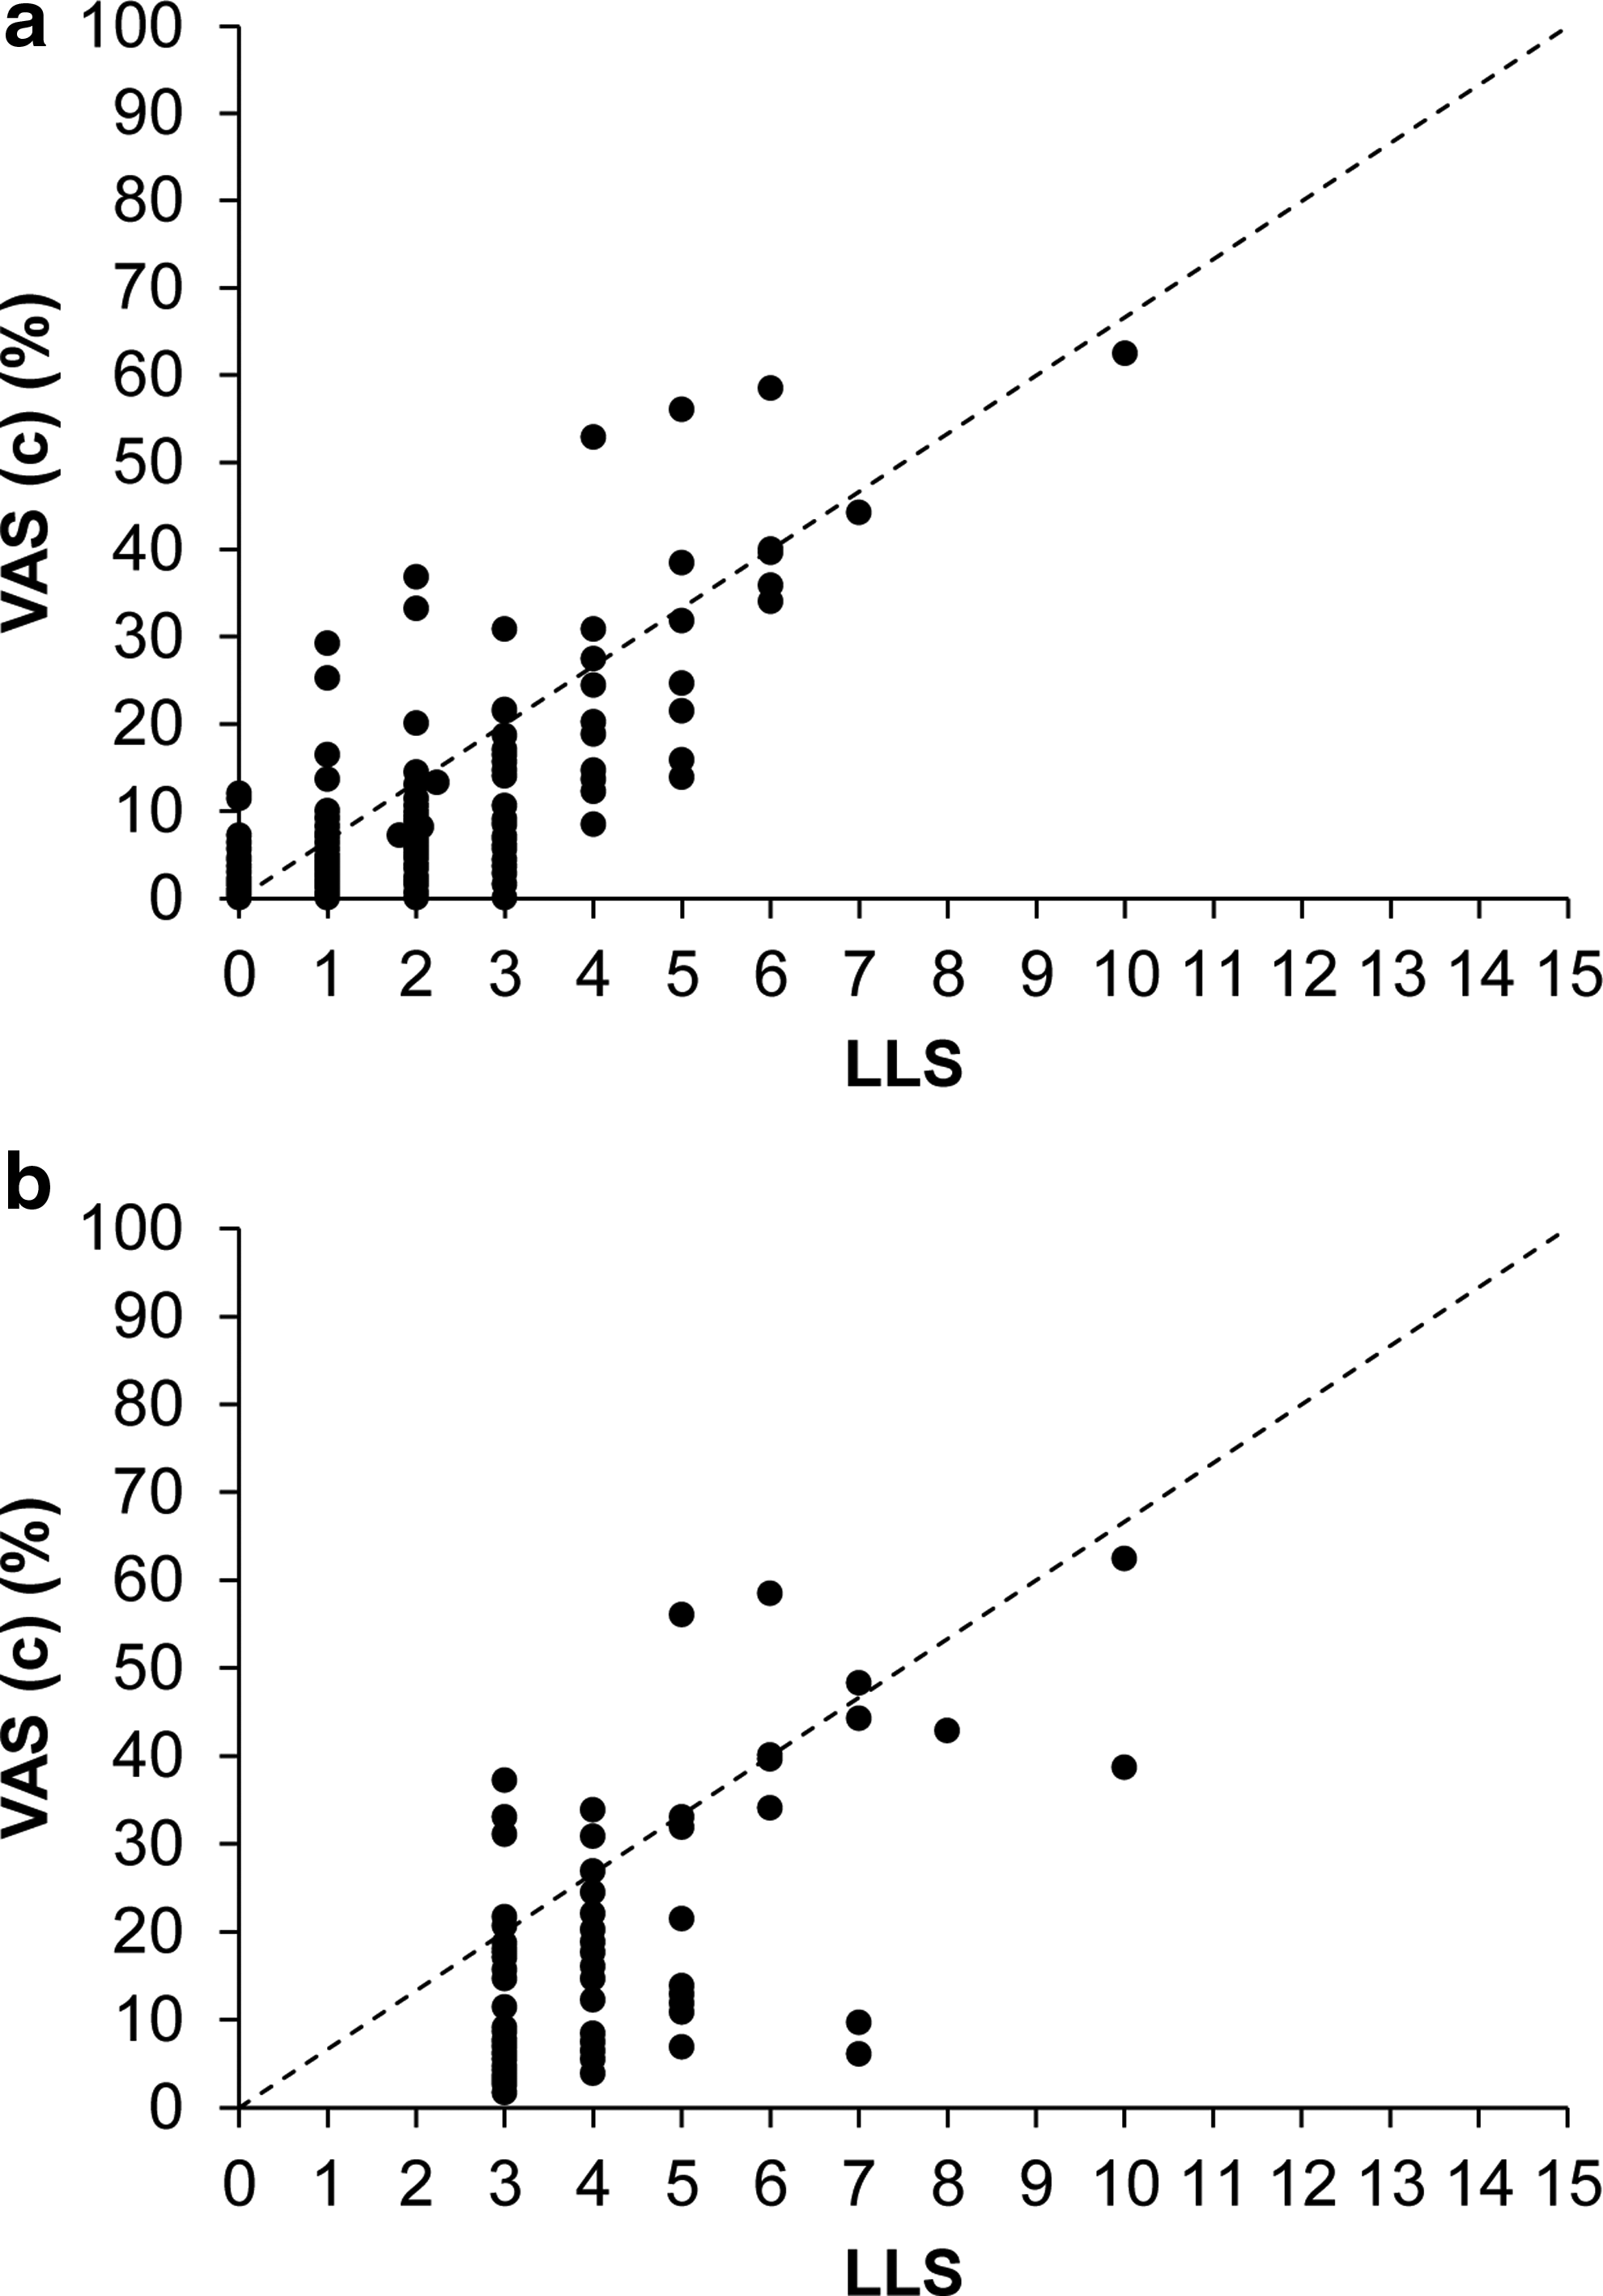
Relationship between LLS and VAS (c) for both the time period in Leh (3500 m), and for all individuals with AMS throughout the expeditions. Data from 2009 and 2010 are combined. Solid circles represent all individual data points. Dashed line represents the line of identity
Relationship between LLS and VAS (c) for individuals with AMS
Over the whole course of both expeditions, 30 individuals developed AMS. Their LLS and corresponding VAS (c) (71 data points) are summarized in Table 1 and Figure 3b. There was a significant correlation between LLS and VAS (c) (rho=0.56, tau=0.44, p<0.001), but once again the relationship was distorted and there continued to be considerable noise within the data.
Relationships between LLS and VAS (i)
The relationships between LLS (symptom) and VAS (i), for both 2009 and 2010 combined, are summarized in Table 1 and illustrated graphically in Figures 4a–4e (1288 data points for each symptom). There were significant correlations between the LLS and VAS (i) for each symptom, but once again there was considerable noise within the data and the relationship between LLS and VAS was distorted.
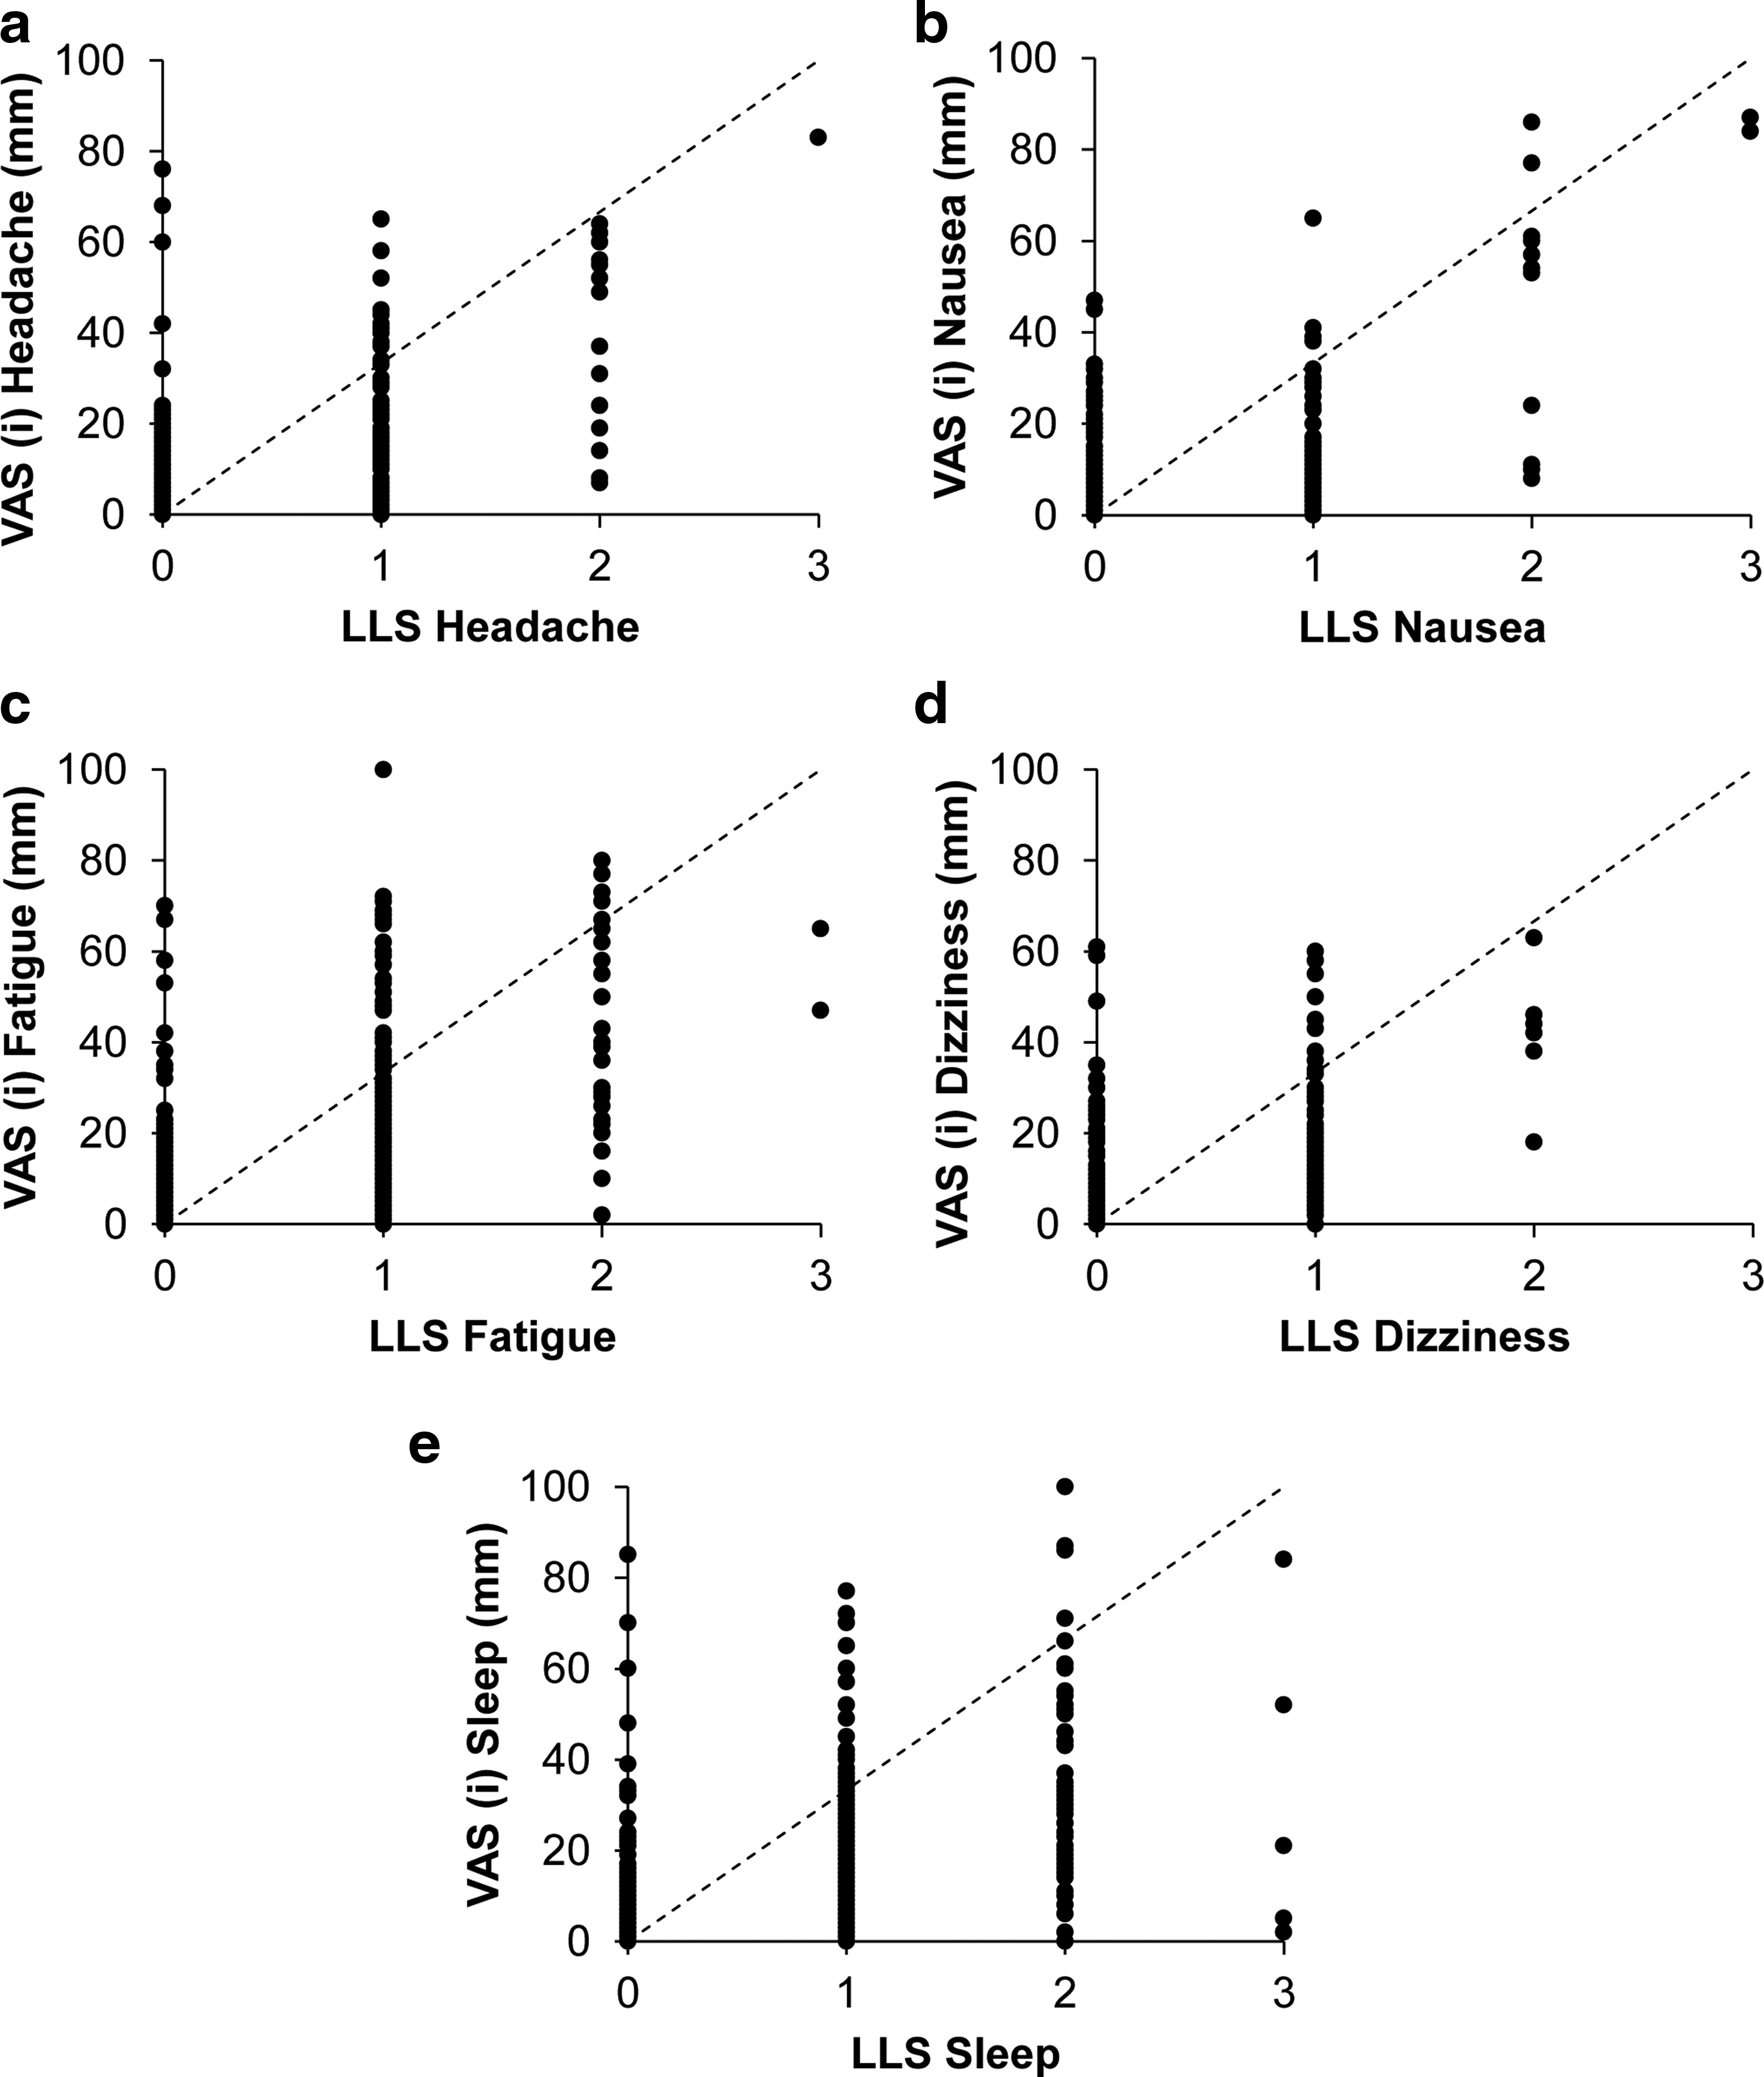
Relationship between LLS symptom scores and VAS (i). Data from 2009 and 2010 are combined. Solid circles represent individual data points (LLS against corresponding VAS, 1288 data points for each symptom). Dashed line represents the line of identity.
Defining a diagnostic cut-off point for AMS using VAS (c)
Combining the data from 2009 and 2010 generated a large data set from which we could define diagnostic cut-off points for AMS using VAS (c). Using the definition of AMS as LLS≥3 in the presence of a headache, 71 data points from the total 1288 corresponded to a diagnosis of AMS. Using the alternative definition of LLS≥5 in the presence of a headache,11,12 20 data points remained. The ROC curves generated using these two definitions are shown in Figure 5a. When the lower LLS threshold for the diagnosis of AMS was used (LLS≥3), the AUC was 0.90 (95% confidence interval: 0.87, 0.92); for the higher threshold (LLS≥5), the AUC was 0.96 (95% CI: 0.93, 0.98).
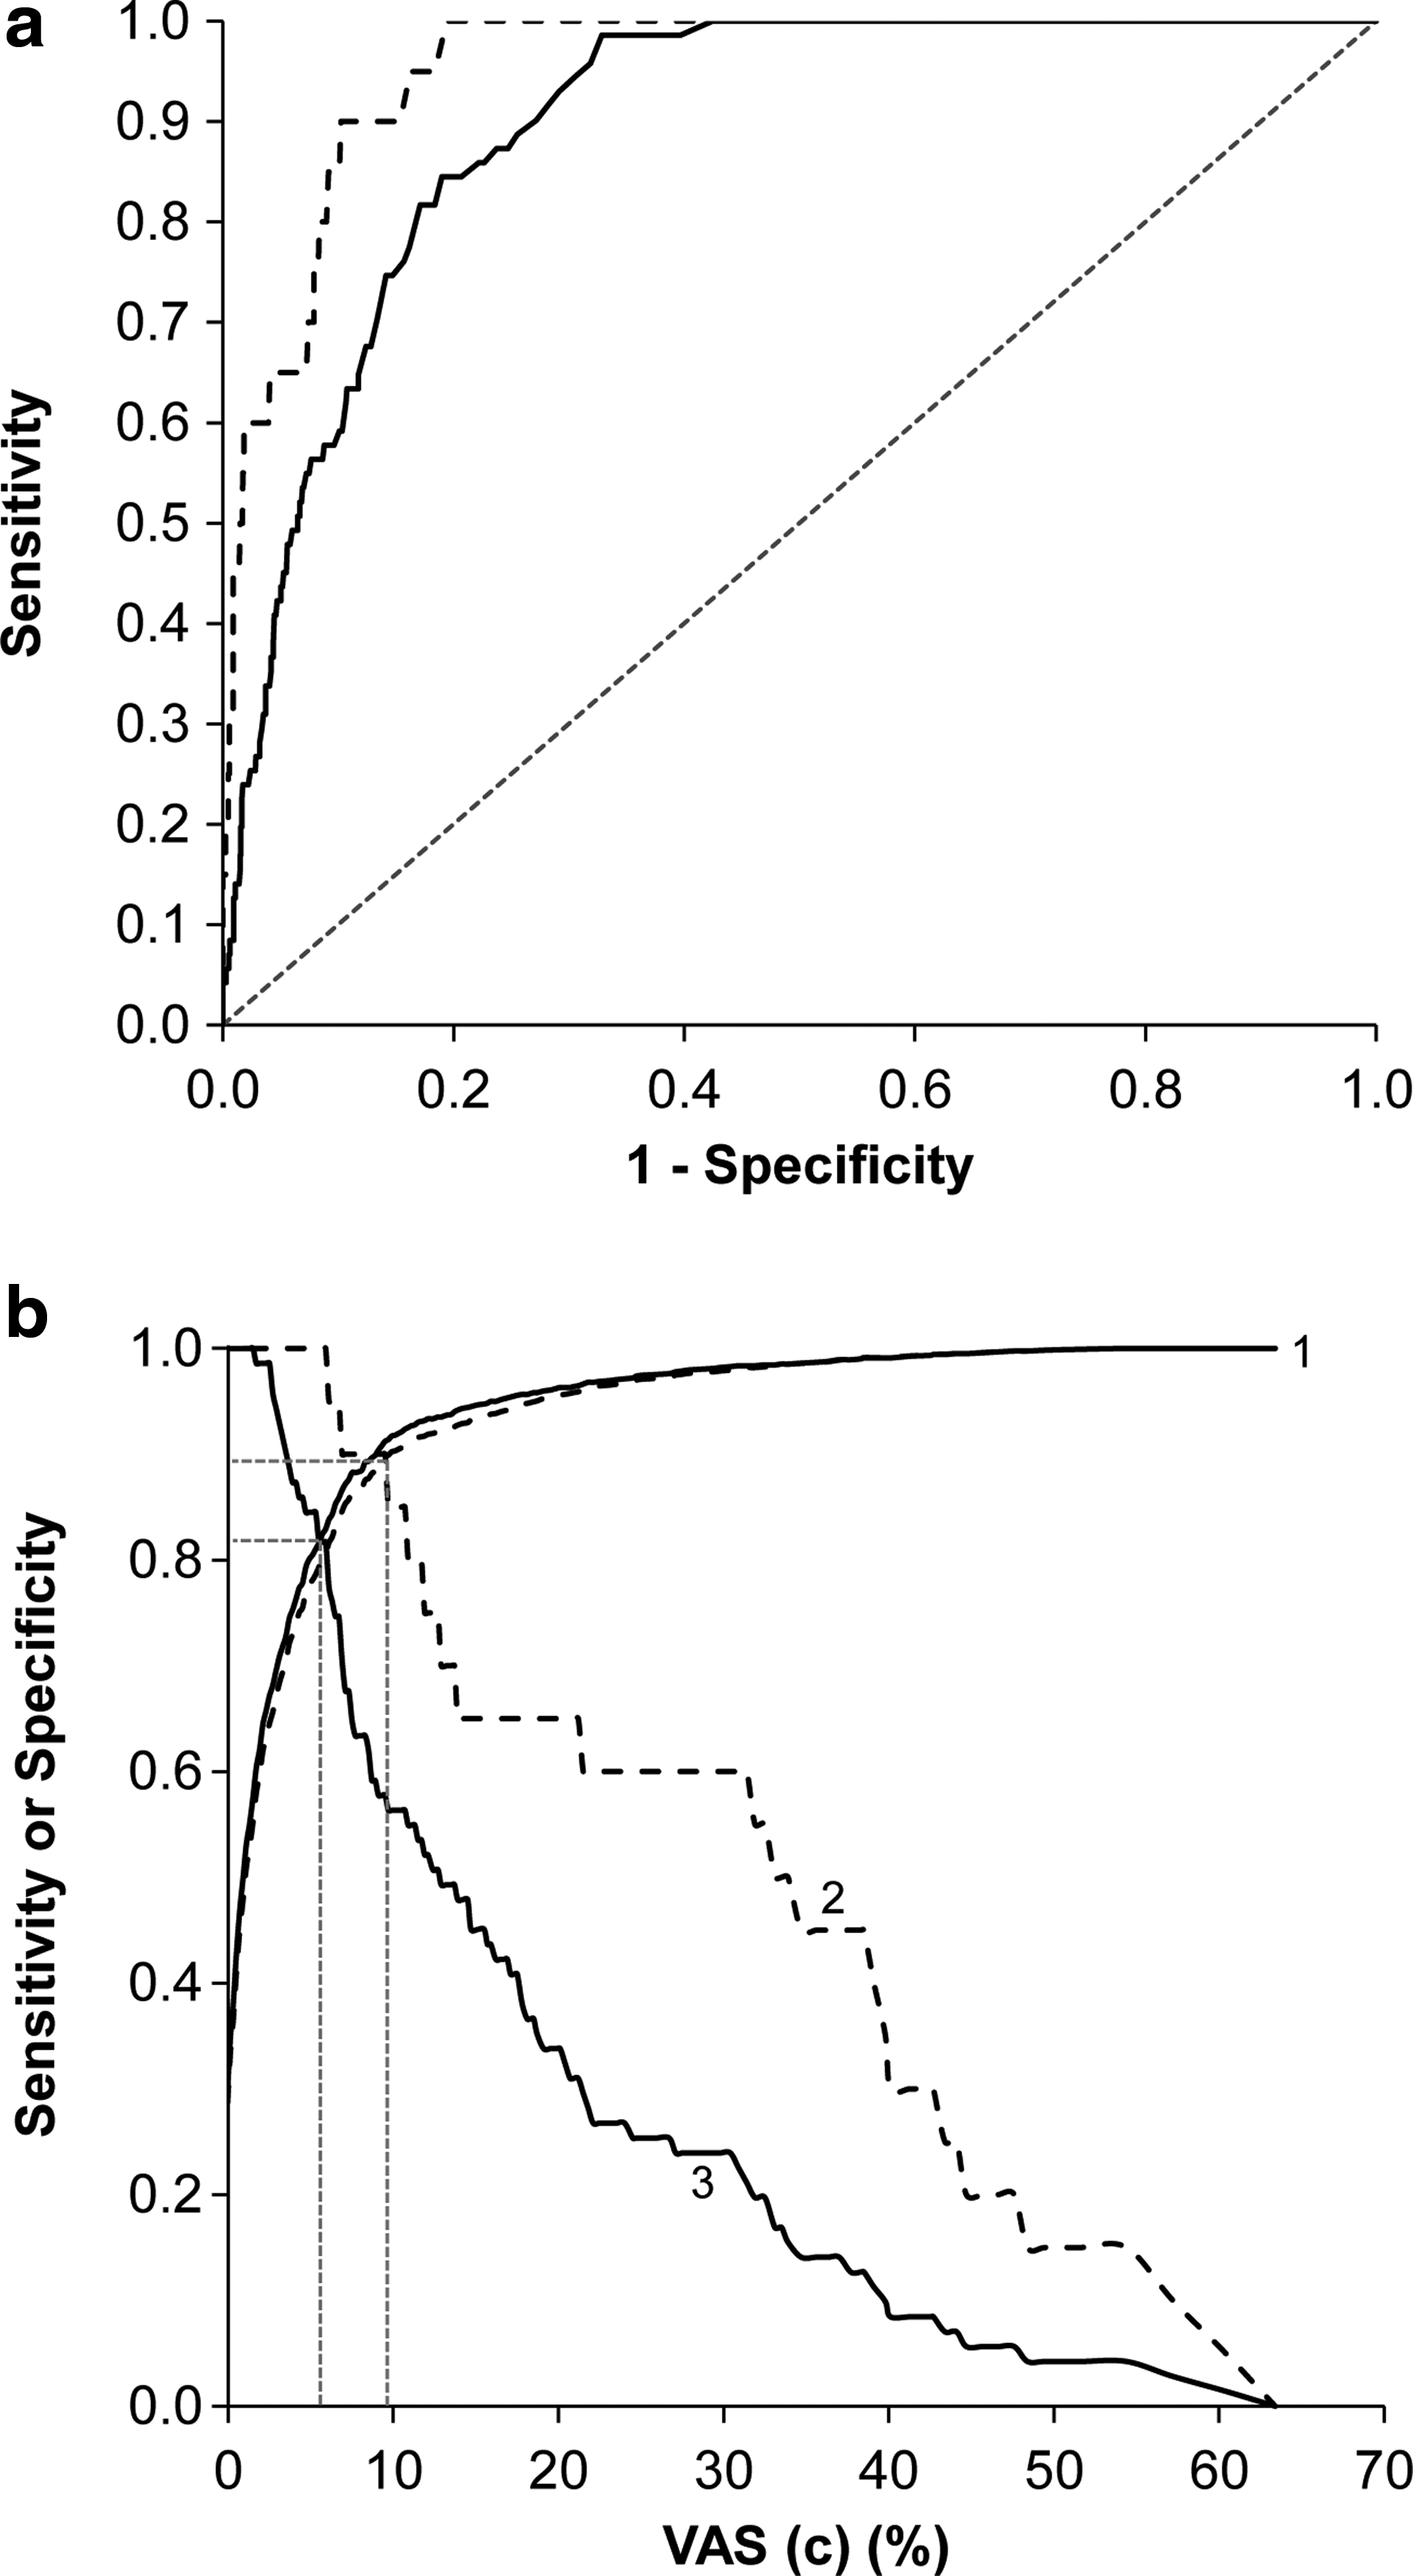
ROC curves and decision plots for the determination of optimum values of VAS (c) for the diagnosis of AMS. Data from 2009 and 2010 have been combined.
Figure 5b illustrates the decision plots of sensitivity and specificity for all VAS (c) levels for both the lower and higher diagnostic thresholds for AMS (based on LLS). The specificity of VAS (c) for AMS was high and was not altered by more stringent criteria for the definition of AMS. In contrast, altering the LLS threshold from 3 to 5 increased the sensitivity of the VAS (c) for AMS. The point at which the respective sensitivity and specificity plots crossed was taken as the optimum VAS (c) at which most cases of AMS would be correctly diagnosed. When LLS≥3 was used for diagnosis, the optimum VAS (c) was 5.5% (a total of 27.5 mm combined from the five VAS (i)), with a sensitivity and specificity of 82%, positive likelihood ratio (LR) of 4.4 and negative LR of 0.2. When LLS≥5 was used, the optimum VAS (c) was 9.5% (a total of 47.5 mm from the five VAS (i)), with a sensitivity and specificity of 90%, positive LR of 8.8 and negative LR of 0.1.
Discussion
This is the first study to investigate the role of VAS, both for individual symptoms and overall altitude sickness, in the self-assessment of AMS in adolescents. It is also the first study to conduct the investigation over two separate expeditions with comparable subject demographics and ascent profiles, making it the largest study into the role of VAS at altitude. The demographic homogeneity of the large group of subjects in this study is also unique. During these expeditions, altitude-naïve adolescents made first ascents of several 6000 m Himalayan peaks. Despite this, the incidence of AMS was relatively low—less than half of the participants developed AMS, and most of these cases were mild.
This study demonstrates that adolescents are capable of self-monitoring using, with high compliance, both the Lake Louise AMS Self-Report Score (as per previous studies10,13) and visual analogue scales. Furthermore, we show that adolescents understand the use of separate VAS for different symptoms and that these, together with both the composite and overall VAS, correlate with their corresponding LLS. These significant correlations were robust, and shown to be present in two datasets from separate expeditions. These correlations also held true when only individuals suffering from AMS were included in the analysis.
Whilst VAS have been extensively researched in the medical literature, particularly in reference to pain management, ours is only the fifth field study to evaluate the role of VAS in the self-assessment of AMS, and the first solely in adolescents. The studies conducted to date vary considerably with regards to study design, number of participants, incidence of AMS, and participant demographics.
The earliest study, by Wagner and colleagues, 4 assessed 356 climbers ascending to 4419 m, at which point LLS (mean 2.8) and overall VAS (on a 100 mm scale) were measured, showing a significant correlation (365 data points, r=0.65). Second, Kayser and colleagues 5 studied 14 climbers ascending to 4560 m (maximum mean LLS=3.9), performing twice-daily measurements of LLS and overall VAS (85 mm scale) and showing a significant correlation between these (172 data points, r=0.84). They noted both the distortion of the relationship between LLS and VAS (o), and the phenomenon of underscoring of symptoms by VAS for LLS<5.
Van Roo and colleagues 6 recently presented the first use of VAS (c), comparing this with both the LLS and VAS (o). 66 climbers, reaching an altitude of 6962 m (median LLS=4), completed the LLS and VAS at the point in the climb at which they felt that their symptoms were worst. Their study (66 data points) showed significant correlations between LLS and both VAS (o) (rho=0.71) and VAS (c) (rho=0.83). Finally, Hext and colleagues 7 recently assessed 23 individuals ascending to 4392 m, using VAS (c) and VAS (o) and comparing these with both LLS and a shortened Environmental Symptoms Questionnaire. Scores were obtained twice daily, but only the first six time-points (138 data points) after arrival at 4392 m were used for analysis. They demonstrated significant correlations between LLS and both VAS (o) (rho=0.83) and VAS (c) (rho=0.87). They also defined cut off points on the VAS for the diagnosis of AMS, demonstrating a high specificity but lower sensitivity (using LLS≥3 as diagnostic of AMS).
A unifying feature of these previous studies, and our own, was a consistently moderate/high correlation of both VAS (c) and VAS (o) to LLS. However, in all cases this relationship was distorted, in that the data points were not grouped around the theoretical line of identity. The phenomenon of underscoring of symptoms by VAS for LLS<5 was first noted by Kayser. 5 Indeed, this effect can be seen in both of the subsequent studies by Van Roo 6 (although less marked) and Hext, 7 and in our own. The distortion of this relationship is in contrast with that seen in the acute pain setting. 9
The relationship between LLS and VAS may be affected in several ways. Importantly, the LLS is an ordinal scoring system, whereas VAS is a continuous measure. Whilst the LLS restricts the user to a selection of symptom severities, the VAS allows a full range. This difference may account for much of the scatter that is seen within all of the studies, including our own. A second explanation for this scatter is that individuals, as we have demonstrated, use the VAS with varying consistency. Individuals will have different ‘thresholds’ for moving between categories on the LLS and they may not be consistent in their choices. The VAS does not have the same limitations, but this advantage may also lead to difficulties in comparing the two self-assessment methods.
It is possible that a learning bias could contribute to the distorted relationship between LLS and VAS. Repeat usage of the VAS (as seen in the studies by Kayser, Hext and ourselves) may cause a user to gradually underscore their symptoms, in comparison to the LLS. Indeed, it is interesting that the relationship between LLS and VAS (c) is less distorted when only the first 3 days of the expedition are analyzed (Fig. 3a, in comparison to Figs. 1a and 1b). If a learning bias was present, it would certainly limit the role of VAS in the self-assessment of AMS, as repeat recordings and observation of trends are of particular importance.
The apparent relationship between LLS and VAS will also be affected by the sample size and the incidence of AMS. There are discrepancies amongst the studies described with regard to the number of participants, ascent profiles, maximum altitudes reached, and the timing of the self-assessment. By electing to only study subjects on the summit (Wagner) or when individuals subjectively felt that their AMS was worst (Van Roo), it was possible to introduce a selection bias. Nevertheless, a unifying feature of all studies is that the incidence of moderate and, particularly, severe AMS is low. The distorted relationship between LLS and VAS and, in particular, the apparent altered sensitivity of VAS for AMS symptoms when the LLS exceeds 5 could be partly explained by this discrepancy.
Our large study (1288 data points) allowed us to determine two diagnostic values of VAS (c) for AMS, the first study to do so. Using the ROC curve method and LLS≥5 for the diagnosis of AMS, the study by Van Roo had demonstrated that a VAS (o) threshold of 35–43 mm had a high sensitivity (78%–87%) and specificity (86%–96%) for AMS. The study by Hext derived the diagnostic cut-off point of VAS (o), corresponding to a LLS of 3, from the line of best fit to the data points. The resultant value (22 mm) had a high specificity (98%) but lower sensitivity (67%) for AMS. The high specificity is unsurprising, given the methodology, and the latter may be flawed as it relied on a linear, undistorted, relationship between LLS and VAS. We have demonstrated that a VAS (c) value of 5.5% (27.5 mm total, from a possible 500 mm) has a high sensitivity and specificity for AMS (82%) and that these can be improved (to 90%) by increasing the threshold value to 9.5% (47.5 mm total) for the detection of more severe AMS. Therefore, for several reasons, VAS (c) may be of more value in the diagnosis of more severe LLS. First, we have demonstrated both higher sensitivity and specificity for the diagnosis of AMS when a higher value of VAS (c) is used. Furthermore, a total distance of 27.5 mm (from a possible 500 mm) on the composite VAS is small. This may be difficult to record and measure, and will be less sensitive to change than the higher value.
The role of VAS (c), versus VAS (o), could also be debated since we, and previous studies,6,7 have demonstrated that there is a significant correlation between VAS (o) and both the LLS and VAS (c). However, the use of a VAS for “overall altitude sickness” requires knowledge of the symptoms of AMS and it does not specifically ask about headache. While the VAS (c) takes slightly longer to complete and requires some subsequent analysis, it provides a better representation of the separate symptoms of AMS.
Our study is not without other limitations. One important consideration is that only one investigator performed the VAS measurements. While this may be a potential source of bias, precautions were taken so that the investigator was blinded both to the participant identity and the corresponding LLS. Furthermore, previous studies have shown robust intraclass correlations between investigators' measurements of VAS (correlation>0.994,6) and consequently the use of one investigator should not have introduced additional error. Second, a potential flaw that is common to all studies of VAS at altitude is the use of the LLS as the “gold standard” comparator. The LLS itself has limitations14,15 and therefore using it to define individuals with AMS for the purpose of evaluating the specificity and sensitivity of the VAS could introduce error. An alternative approach could be to compare VAS and LLS self-assessments to the independent judgment of several clinicians. However, this may well not be practical in the field. Finally, while our data set was large, the number of data points corresponding to AMS, particularly severe AMS, was low in comparison to the overall total (although relatively high compared to some previous studies). This may have affected both the relationship between LLS and VAS (particularly for LLS>5, as previously discussed) and our results from the ROC curve analysis.
During the study of a new self-assessment technique, it is important to consider the context in which this technique may be applied. The detection and management of AMS has long been a major challenge, both due to the nonspecific nature of the symptomatology and the environment in which the illness develops. Criticisms of studies using heterogeneous study cohorts, peaks of less extreme altitudes, variable ascent rates, serial VAS measurements, and of low incidences of AMS, are all valid in the context of academic rigor. However, for a self-assessment method to be of use in the reliable detection of AMS (and, importantly, to stand as a ‘rival’ to the alternatives), it must be robust enough to withstand serial measurements (the rate of change of the symptomatology is as important as the initial/final severity) and to detect those individuals sojourning to lower altitudes who may be developing less severe AMS.
In conclusion, at present, despite optimism from successful use in the medical setting and the demonstration by several studies, including our own, of strong correlations between LLS and VAS, there are many limitations to the use of visual analogue scales in the self-assessment of AMS. Difficulties arise in the comparison of two very different scoring systems, and defining robust cut-off points for the diagnosis of AMS is problematic. Therefore, while the Lake Louise AMS Self-Report Score has its own limitations, it remains the most commonly used self-assessment method. An appropriately powered study on a mountain with a high incidence of AMS would be of academic interest, but it would need to surmount the problems described before it was able to present visual analogue scales as a robust alternative to the other, more commonly used, scoring systems.
Footnotes
Acknowledgments
The authors wish to thank Chris Horobin and Mick Pawley as Chief Leaders of the 2009 and 2010 expeditions, respectively; the British Schools Exploring Society; and all of the Leaders and Young Explorers on the BSES 2009 and 2010 Uncharted Himalaya expeditions.
Disclosure Statement
No competing financial interests exist.