
Abstract
Abstract
Luo, Yongjun, Yu Chen, Yao Zhang, and Yuqi Gao. The Association of Angiotensin-Converting Enzyme Gene Insertion/Deletion Polymorphisms with Acute Mountain Sickness Susceptibility: A Meta-Analysis. High Alt Med Biol 13:252–257, 2012.—Altitude exposure in nonacclimatized subjects may lead to acute mountain sickness (AMS). AMS is defined as headache upon recent arrival to altitude and may be accompanied by loss of appetite, nausea or vomiting, dizziness, fatigue, and poor sleep. Susceptibility for AMS varies and has been linked to angiotensin-converting enzyme (ACE) gene polymorphisms. We performed a meta-analysis of studies to assess the association between the ACE deletion (D) and insertion (I) alleles and AMS from published data. A fixed effects model was applied and study quality was assessed in duplicate. Five studies with a total of 333 AMS cases and 373 healthy controls were assessed. Our results revealed no significant differences in risk for AMS between carriers of ACE deletion and insertion polymorphism alleles.
Introduction
A large number of candidate genes have been associated with AMS susceptibility, including the angiotensin-converting enzyme (ACE), angiotensin II (Ang II) type 1 receptor, beta-2 adrenergic receptor, bradykinin receptor-B2, heat shock protein 70, endothelial nitric oxide synthase, hypoxia-inducible factor 1 alpha, and vascular endothelial growth factor (Dehnert et al., 2002; Zhou et al., 2005; Koehle et al., 2006; Wang et al., 2007; 2009; 2010; Droma et al., 2008; Kalson et al., 2009; Buroker et al., 2010; Hennis et al., 2010; Ding et al., 2011). Several groups have reported AMS susceptibility related to SNP variants (Droma et al., 2008), while others have reported no association (Dehnert et al., 2002; Koehle et al., 2006). Therefore, it remains a challenge to determine which genes and genetic determinants are actually involved in the development of AMS.
Fluid retention is linked to AMS (Hackett et al., 1982; Loeppky et al., 2005). Consequently, there has been substantial interest in understanding the association between variants in the gene-encoding components of the renin–angiotensin system (RAS), which plays a role in regulating plasma volume and vascular tone, and AMS. ACE, a key component of the circulating RAS, cleaves the decapeptide Ang I to yield Ang II, a powerful vasoconstrictor that also drives adrenal aldosterone release. ACE-generated Ang II interacts with Ang II receptors to increase pulmonary vasoconstriction in response to hypoxia (Morrell et al., 1995b). ACE inhibition has been suggested as an additional therapy for hypoxic pulmonary hypertension (Cargill and Lipworth, 1996), so plasma ACE concentrations may be a useful indicator of AMS risk (Norihiro et al., 2002). Fifty percent of the variation observed in individual plasma ACE levels may be explained by insertion (I) and deletion (D) polymorphisms in the human ACE gene (Rigat et al., 1990).The I allele has been previously linked to decreased plasma ACE levels and improved adaptation to high altitudes (Pasha et al., 2002). To address this issue systematically, we performed a meta-analysis of published studies to assess the association between ACE I/D polymorphism and AMS.
Materials and Methods
Literature search
We searched all reports published before July 15, 2011, in the following databases: PubMed, Web of Science, and Embase. The key words used for the search were1) polymorphism and acute mountain sickness, 2) SNP and AMS, or 3) AMS. Only articles written in English were included. Abstracts and unpublished reports were not included.
Inclusion and exclusion criteria
We used the following inclusion criteria: 1) the study was a case/control, 2) sufficient data were provided in the literature to analyze the results (e.g., the genotype number or frequency were included), and 3) the ACE I/D polymorphism in the control population was in Hardy-Weinberg equilibrium. LLS was used as an inclusion criterion of binary AMS outcomes in the original studies. Exclusion criteria included studies with 1) insufficient information on the genotype number or frequency, 2) the ACE I/D polymorphism in the control population was not in Hardy-Weinberg equilibrium, or 3) the same population was included in a previous study (the study that was most recent or had the larger sample size was included).
Data extraction
For each study, we extracted the first author, year of publication, study population, country, and the genotype number for both cases and controls. All control subjects were exposed to high altitude but did not develop AMS. If the data were collected at different times following exposure or different levels of altitude in the same population, we selected the highest altitude or the most recent analysis.
Statistical analysis
In this meta-analysis, we assessed the association between the D or I ACE alleles and AMS. To do this, we used an allelic model (D vs. I), a dominant genetic model (DD + ID vs. II), a recessive genetic model (DD vs. ID + II), homozygote comparison (DD vs. II), and heterozygote comparison (ID vs. DD, ID vs. II). Unadjusted OR corresponding to a 95% CI was used to compare the alleles and genotypes between patients and controls. The heterogeneity was assessed using a chi-square-based Q-test and I-squared test. Heterogeneity was therefore considered significant when p<0.05. If there was no heterogeneity (p>0.05) among the studies, the pooled OR estimate of each study was calculated using the fixed effects model (p<0.05) (Mantel and Haenszel, 1959; Ma et al., 2010).We also used the Bonferroni correction to correct for multiple testing. A difference was considered significant if p<0.008. All of the above statistical analysis were performed using RevMan 5.0 (The Cochrane Collaboration) in similar fashion as reported before (Qi et al., 2011). For this study, we calculated the sample size using the Armitage's trend test (http://ihg2.helmholtz-muenchen.de/cgi-bin/hw/power2.pl). The minor allele frequency in the cases was 0.50 and disease prevalence was 0.4. Therefore, we need only 45 cases and 45 controls for genotype, indicating that the meta-analysis was sufficiently powered to detect a difference (Slager and Schaid, 2001).
Results
Description of the studies identified using meta-analysis
In this study, a total of 5 studies with 333 AMS cases and 373 controls were included for meta-analysis. The baseline characteristics for the qualified studies are presented in Table 1. Two studies were conducted on Asian (Chinese and Nepalese) populations, and three studies were conducted in Caucasian populations. The sample sizes ranged from 103 to 205 subjects.
Meta-analysis results
In our analysis, there was no heterogeneity among our studies. Because of the lack of heterogeneity, the pooled odds ratio (OR) estimate for each study was calculated using the fixed effects model. The summary OR indicated that no significant differences in the risk of developing AMS were found between carriers of other ACE D and I polymorphism alleles (Table 2) (OR=1.10; 95% CI, 0.87–1.37; p=0.43) (Fig. 1). Similarly, lack of association persisted for genotypes (DD vs. ID+II) of inheritance (OR=1.05; 95% CI, 0.72–1.52; p=0.80) (Fig. 2). In addition, there was no significant correlation between having the genotype DD compared to II (OR=1.10; 95% CI, 0.72–1.77; p=0.59) (Fig. 3), having the genotypes DD+ID compared to II (OR=1.20; 95% CI, 0.84–1.70; p=0.32) (Fig. 4), or having the genotype ID compared to DD (OR=0.99; 95% CI, 0.66–1.48; p=0.96) and risk of AMS (Fig. 5). Finally, we also found no significant correlation between the genotype ID compared to II (OR=1.20; 95% CI, 0.82–1.75; p=0.35) and risk of AMS (Fig. 6).
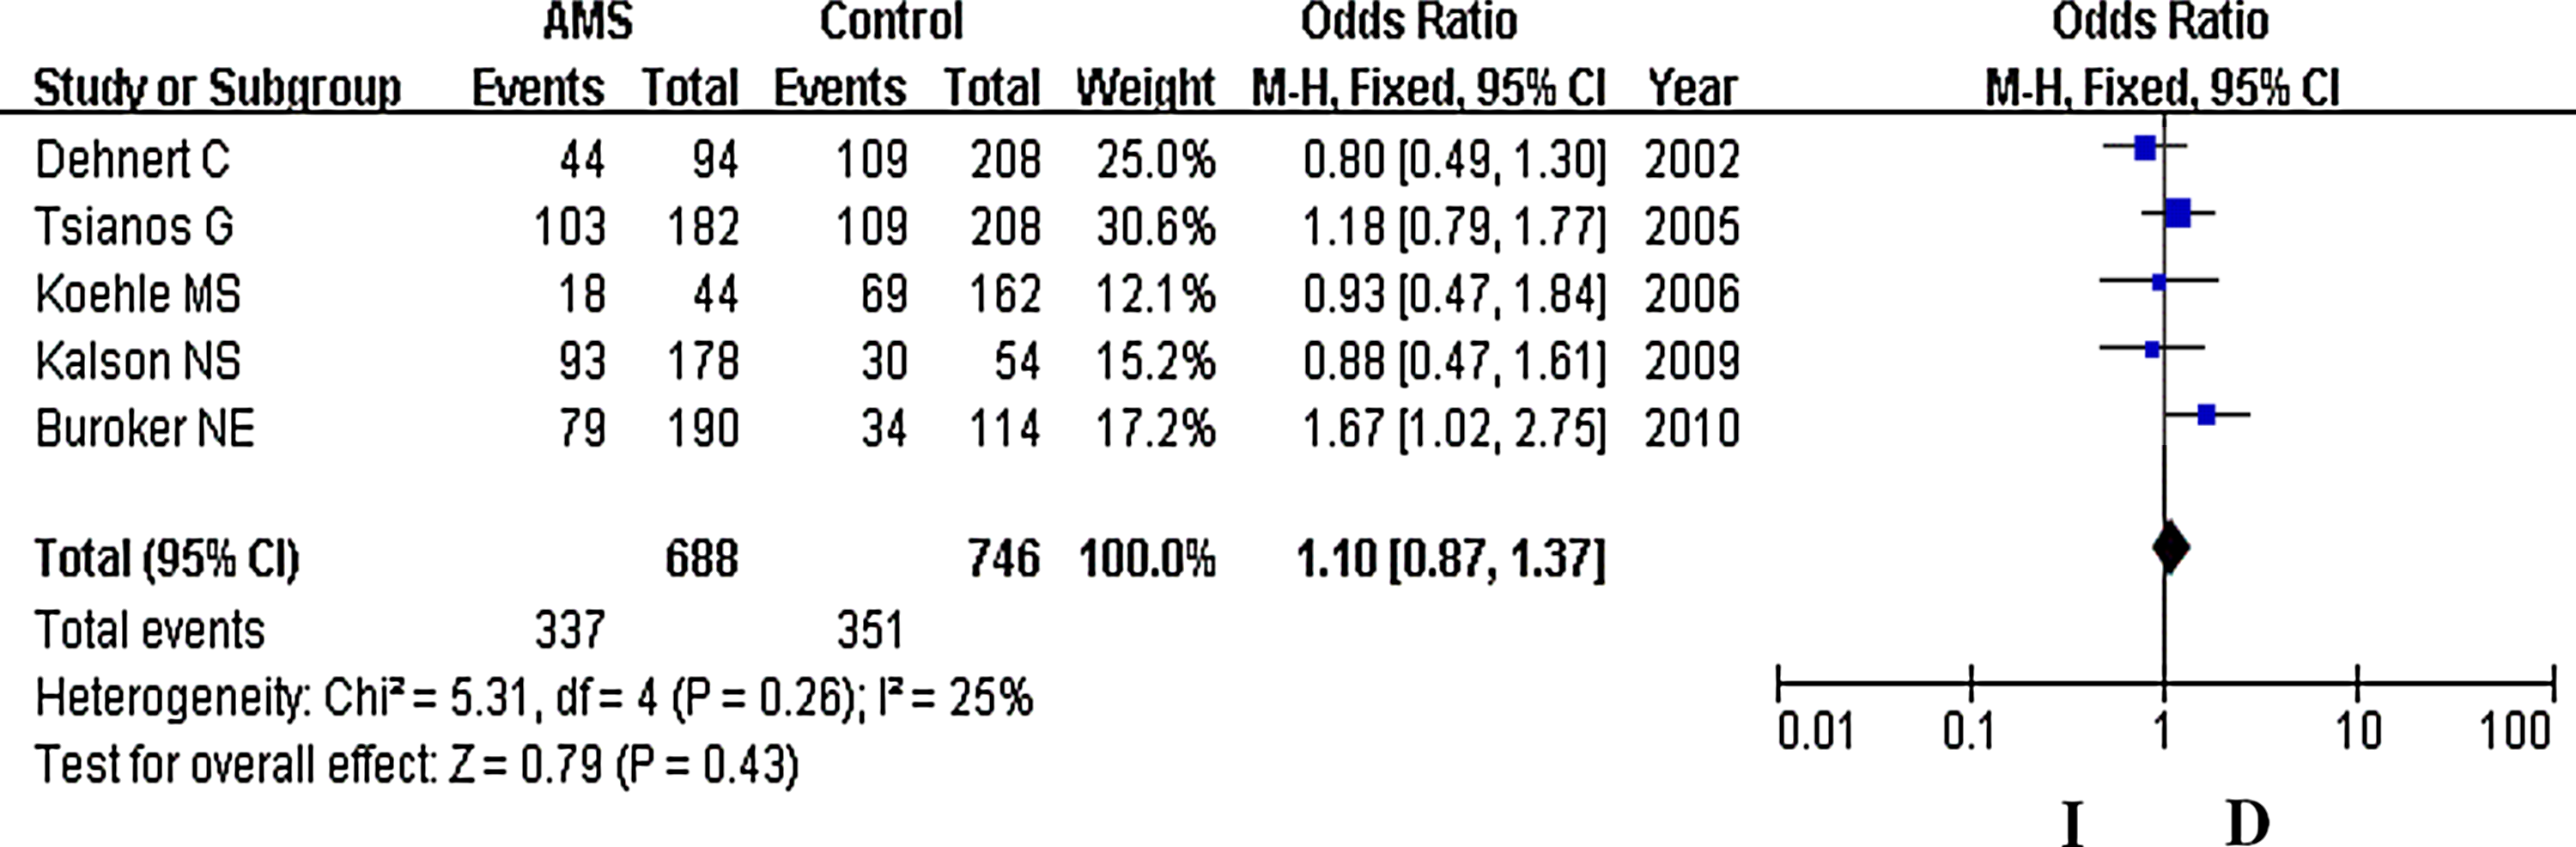
Forest plot for ACE I/D polymorphisms. The summary treatment effect (odds ratio) is shown under the allelic model. The left and right extremes represent the corresponding 95% confidence interval (95% CI). Events refer to the prevalence of the ACE I allele in the cases and the controls.
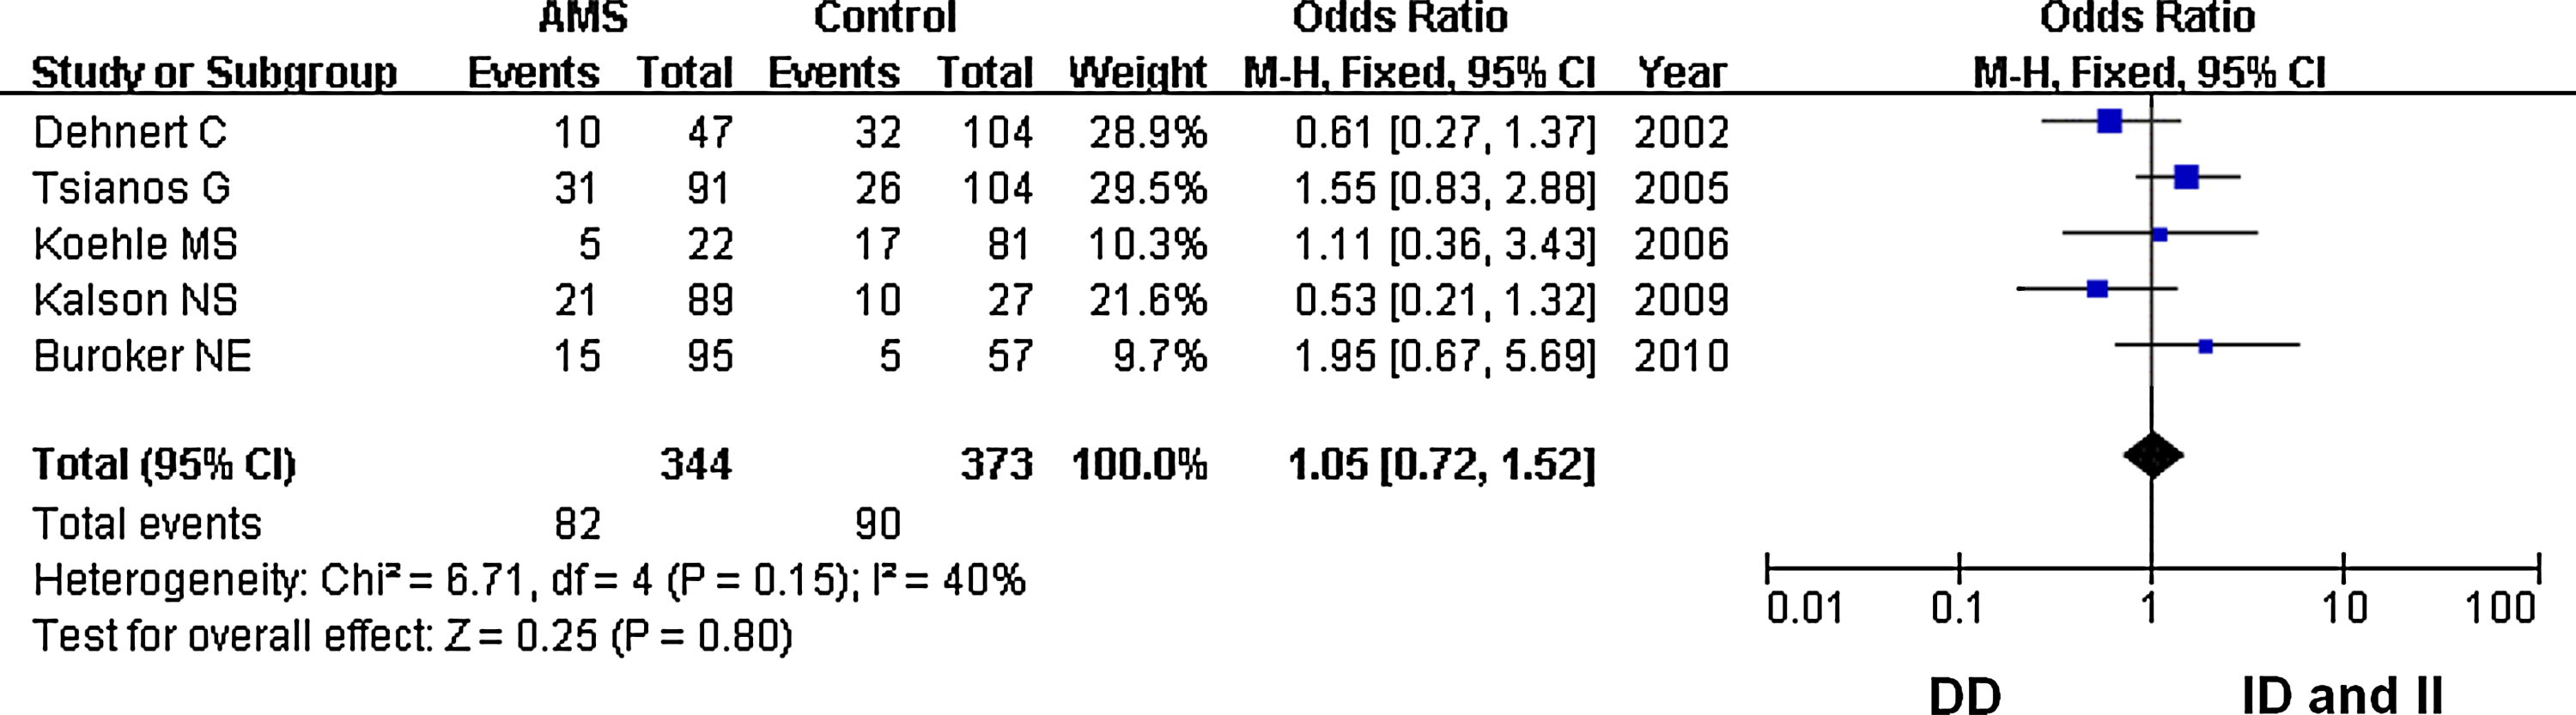
Forest plot for the ACE I/D polymorphisms: DD versus ID and II. The summary treatment effect (odds ratio) is shown under the dominant genetic model. The left and right extremes represent the corresponding 95% confidence interval (95% CI). Events refer to the prevalence of the ACE DD genotype in the cases and the controls.
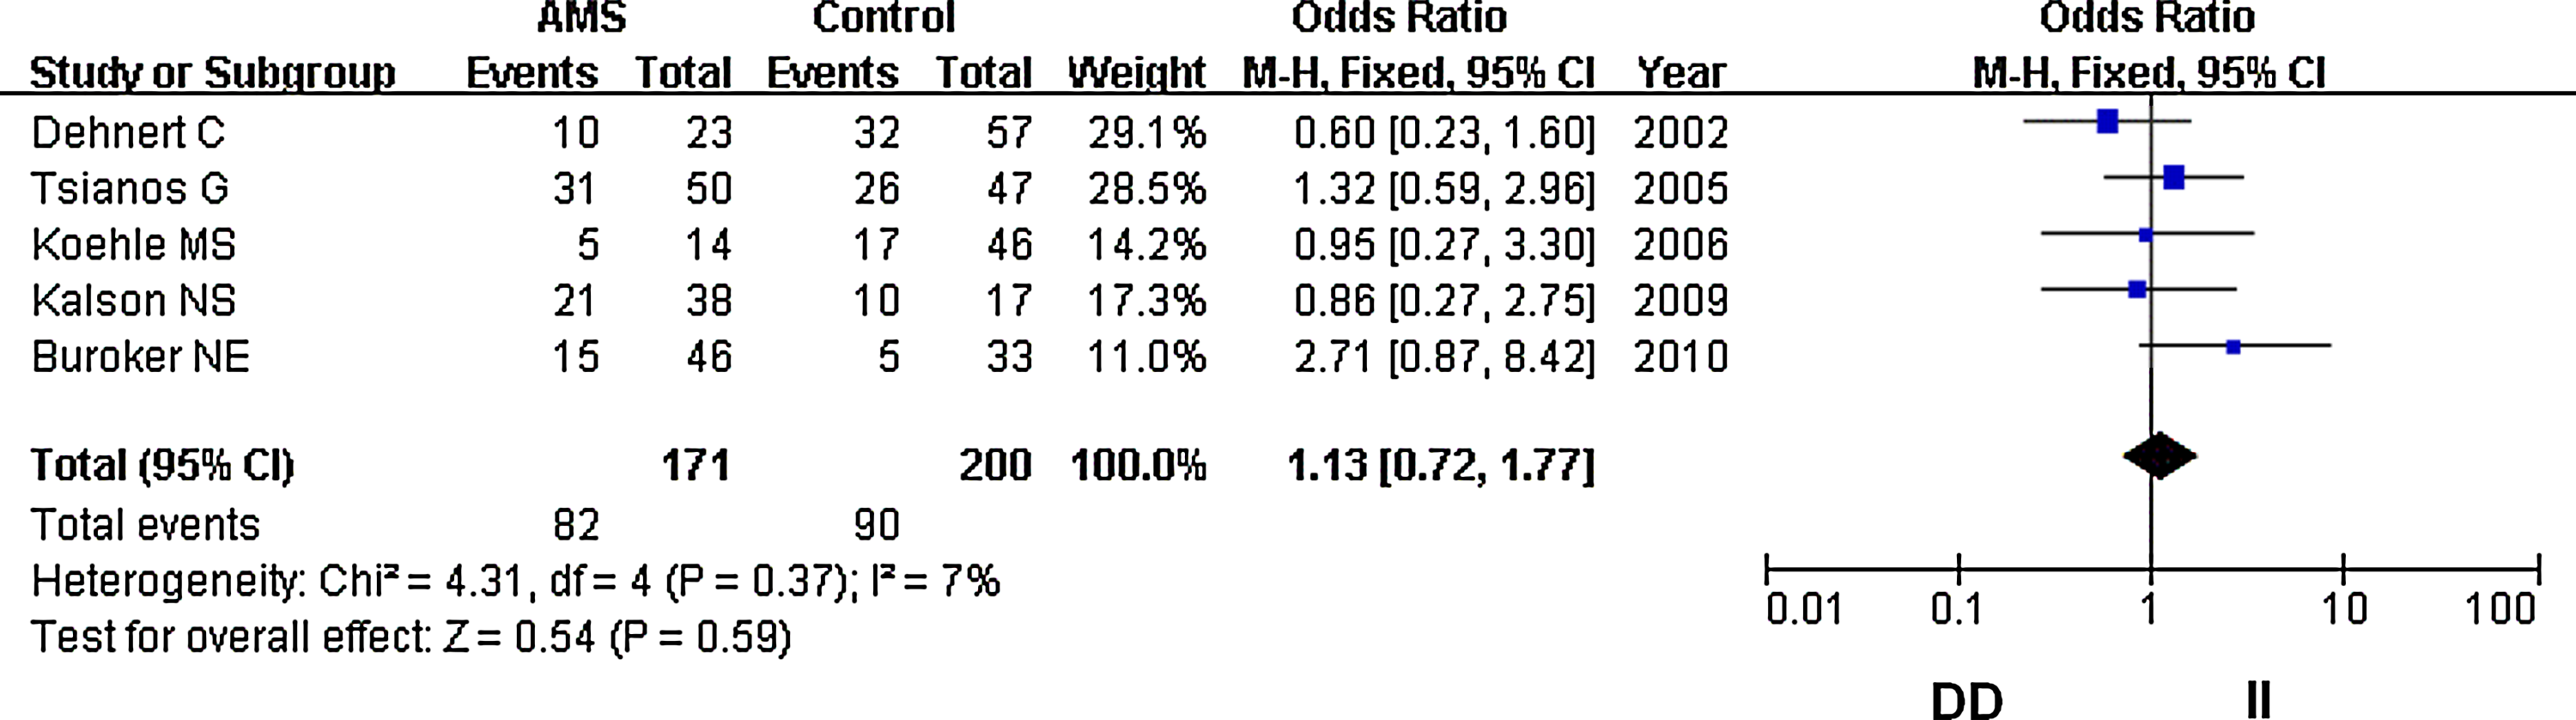
Forest plot for the ACE I/D polymorphisms: DD versus II. The summary treatment effect (odds ratio) is shown under the homozygote comparison. The left and right extremes represent the corresponding 95% confidence interval (95% CI). Events refer to the prevalence of the case DD genotype in the cases and the controls.
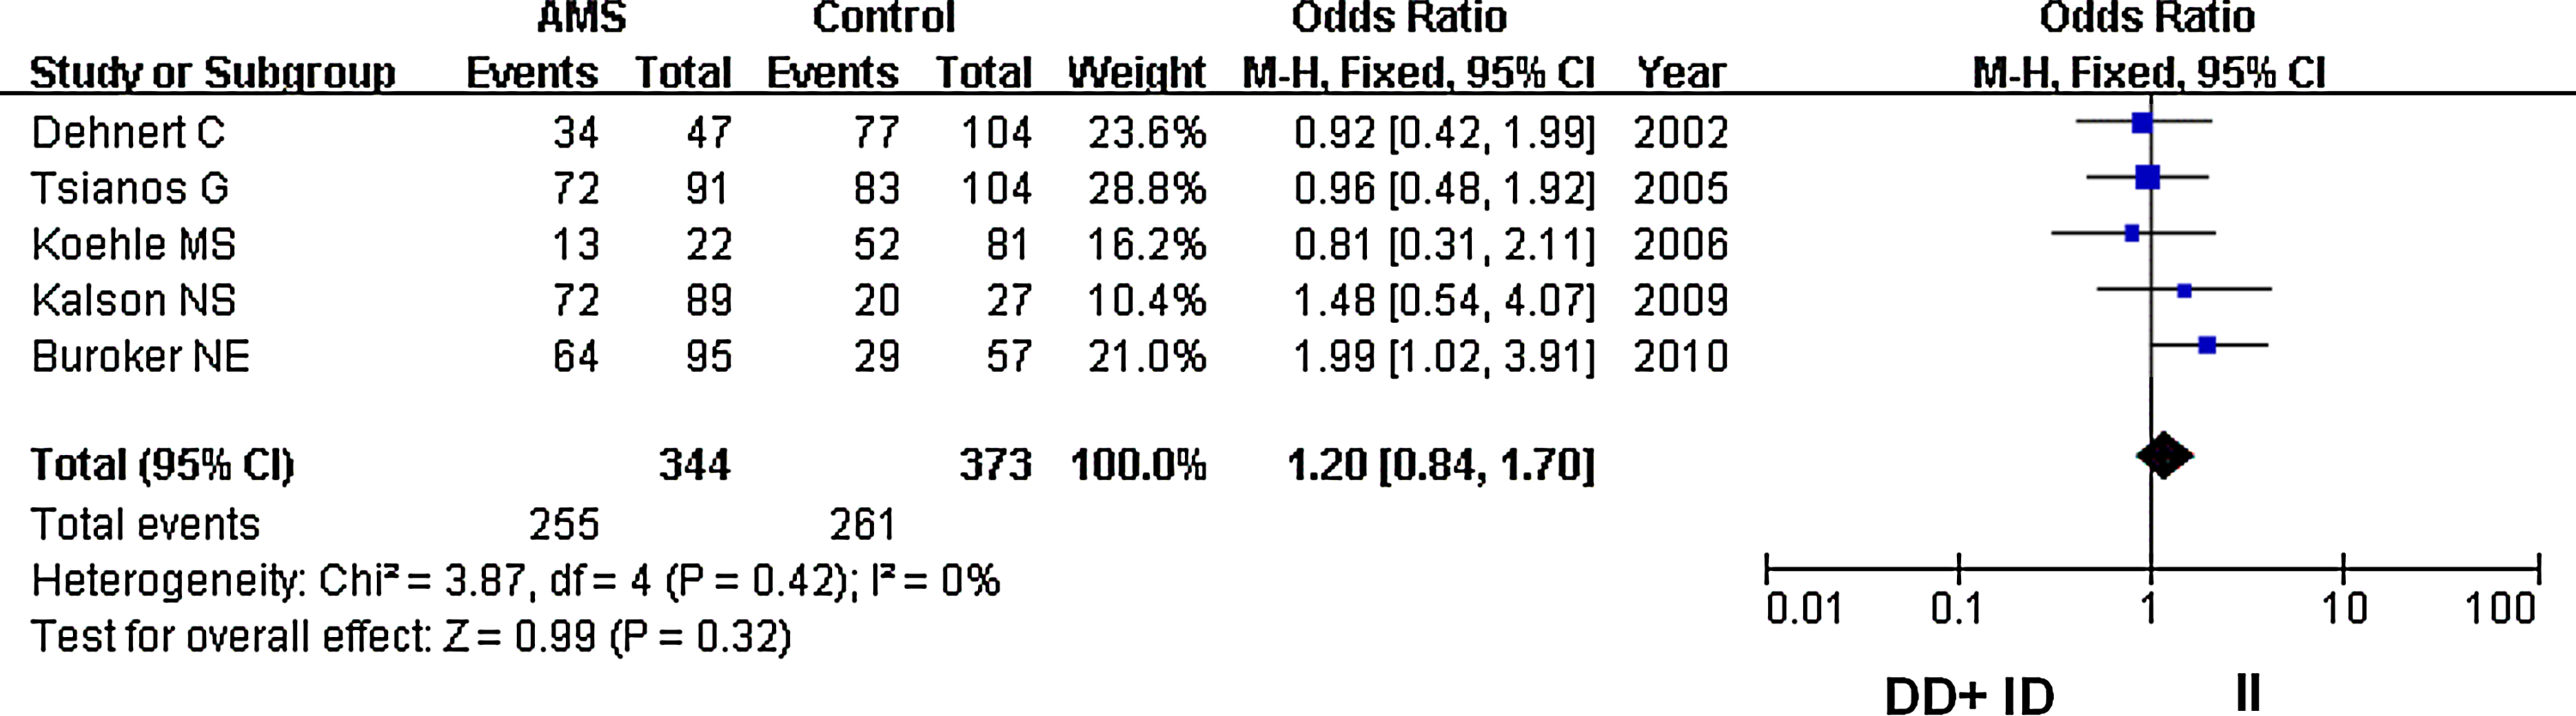
Forest plot for the ACE I/D polymorphisms: DD+ID versus II. The summary treatment effect (odds ratio) is shown under the recessive genetic model. The left and right extremes represent the corresponding 95% confidence interval (95% CI). Events refer to the prevalence of the ACE DD and ID genotypes in the cases and the controls.
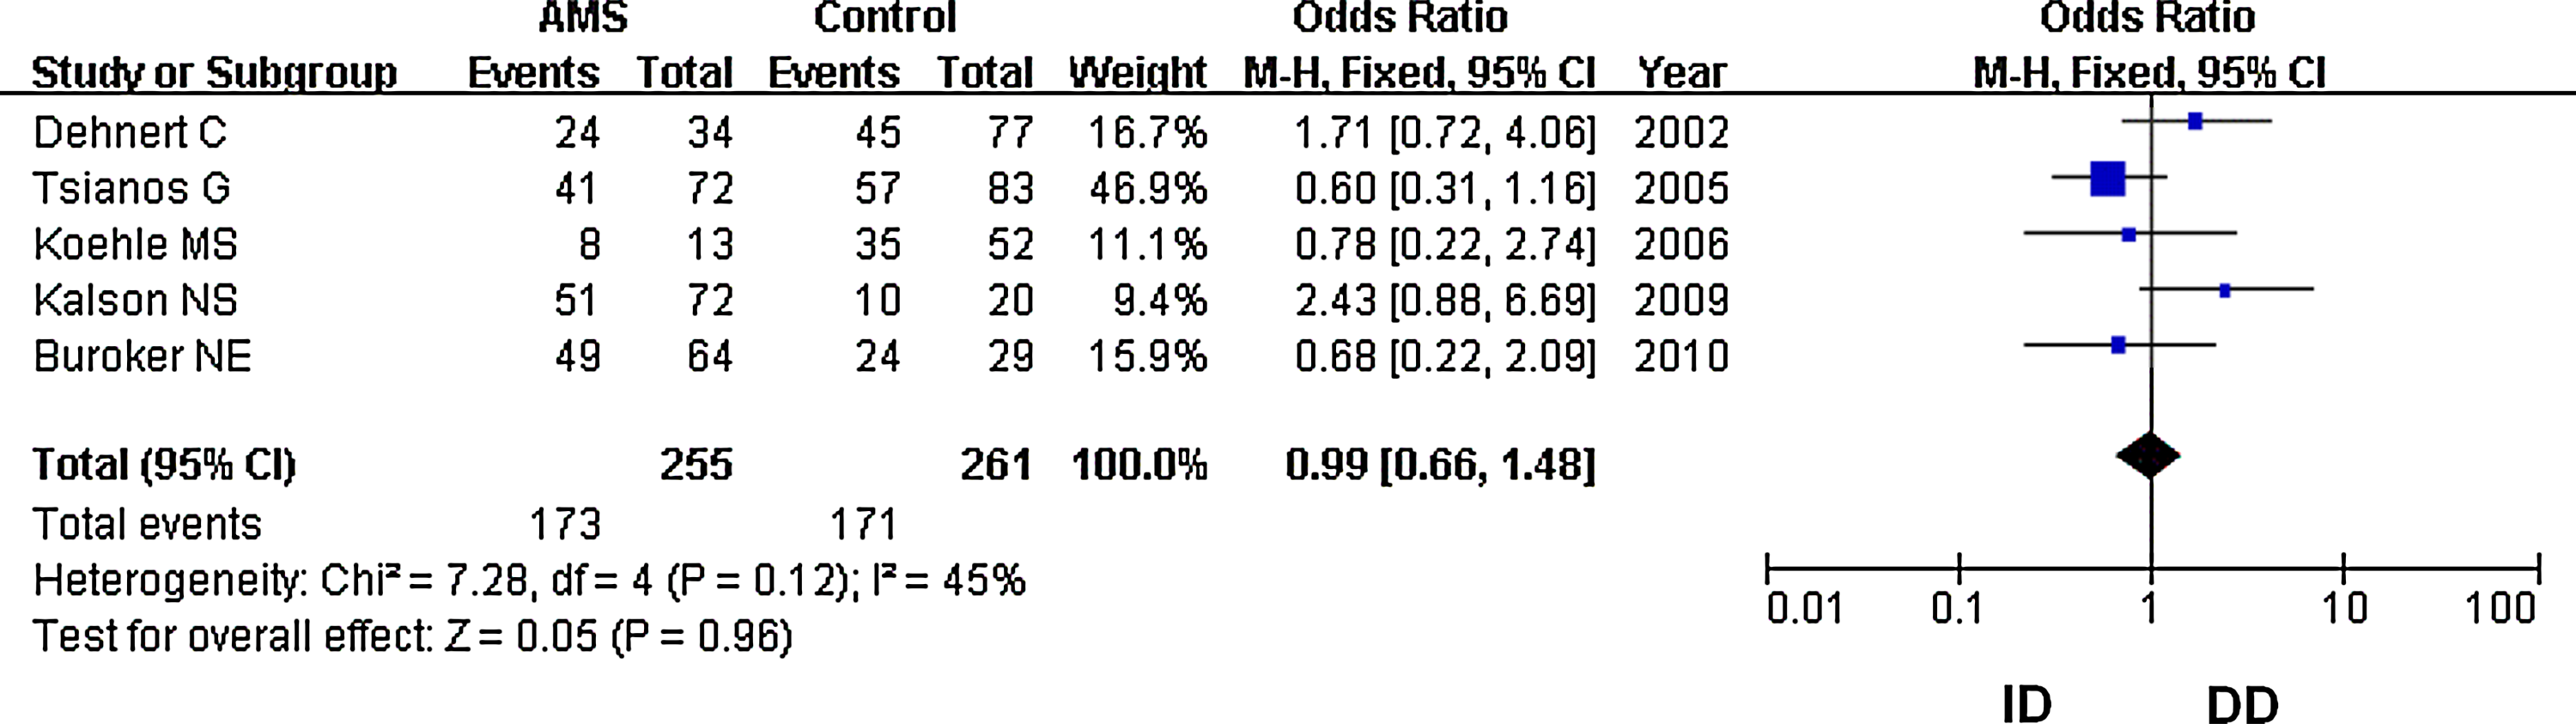
Forest plot for the ACE I/D polymorphisms: ID versus DD. The summary treatment effect (odds ratio) is shown under the heterozygote comparison. The left and right extremes represent the corresponding 95% confidence interval (95% CI). Events refer to the prevalence of the ACE ID genotype in the cases and the controls.
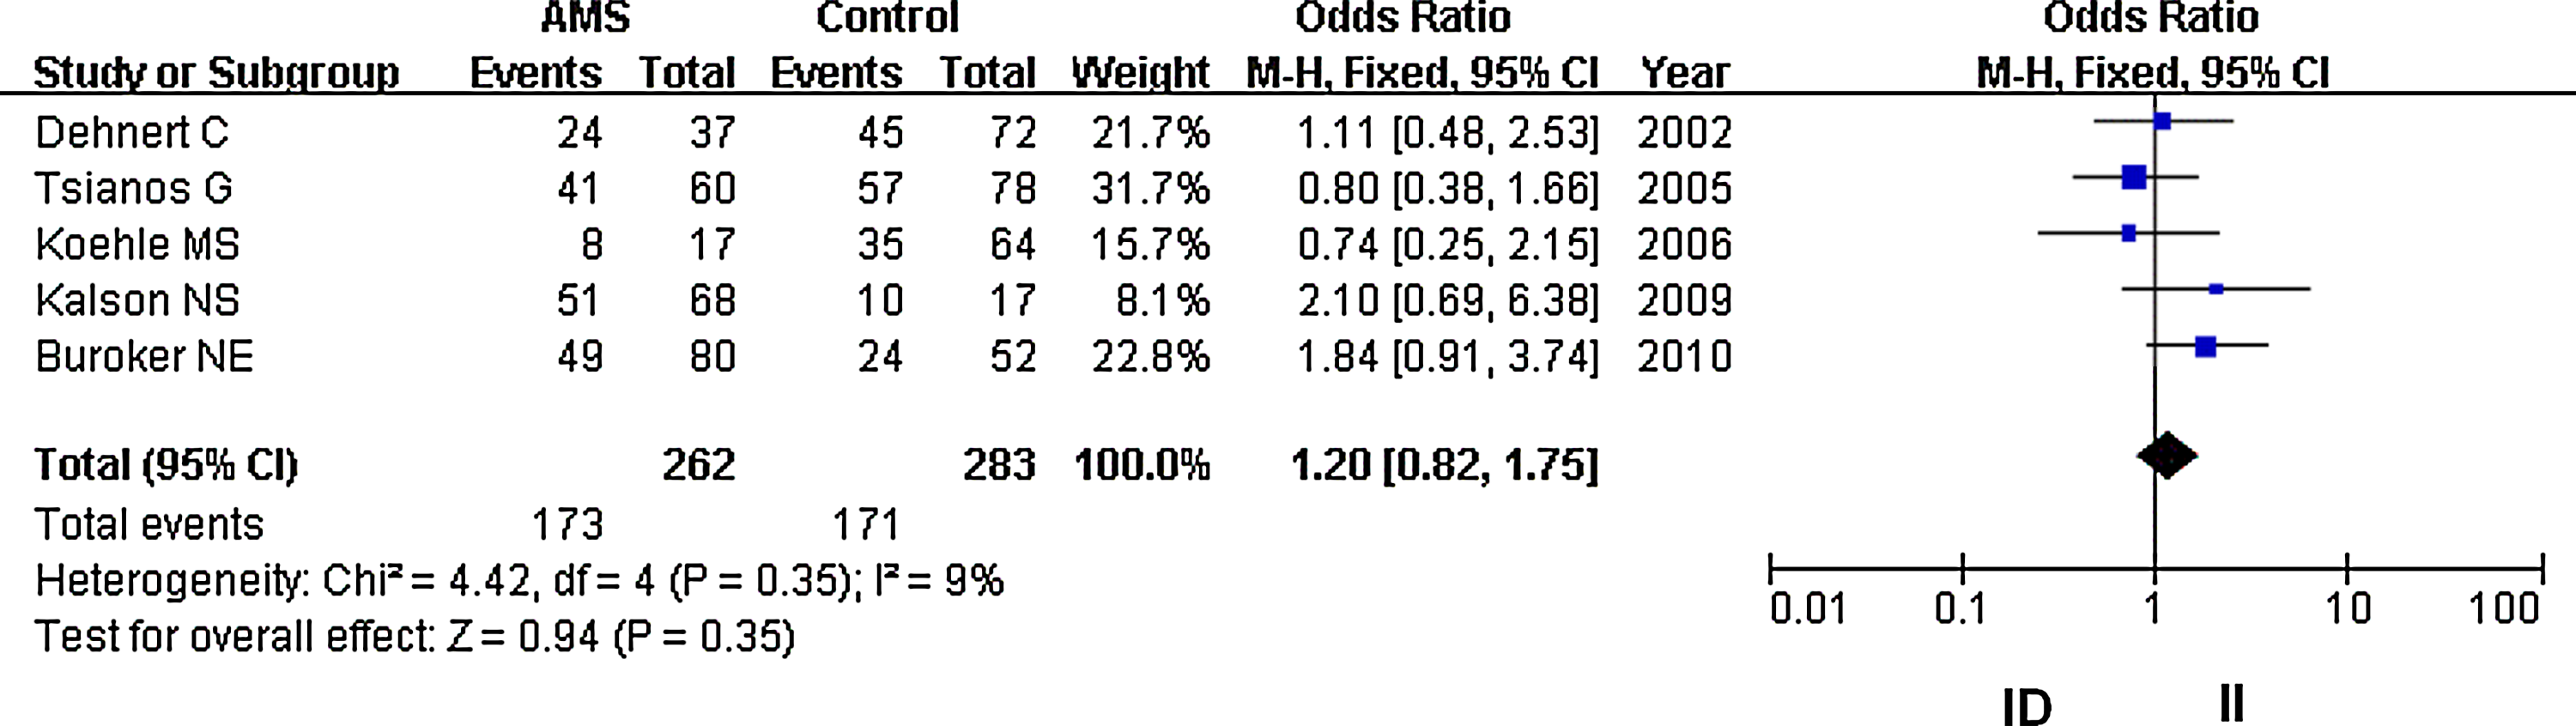
Forest plot for the ACE I/D polymorphisms: ID versus II. The summary treatment effect (odds ratio) is shown under the heterozygote comparison. The left and right extremes represent the corresponding 95% confidence interval (95% CI). Events refer to the prevalence of the ACE ID genotype in the cases and the controls.
Analysis to determine if publication bias exists
Funnel plots were performed to determine whether the literature showed publication bias based on data from the dominant genetic mode. The funnel plots were symmetrical by visual inspection, indicating that there was no publication bias (Fig. 7).
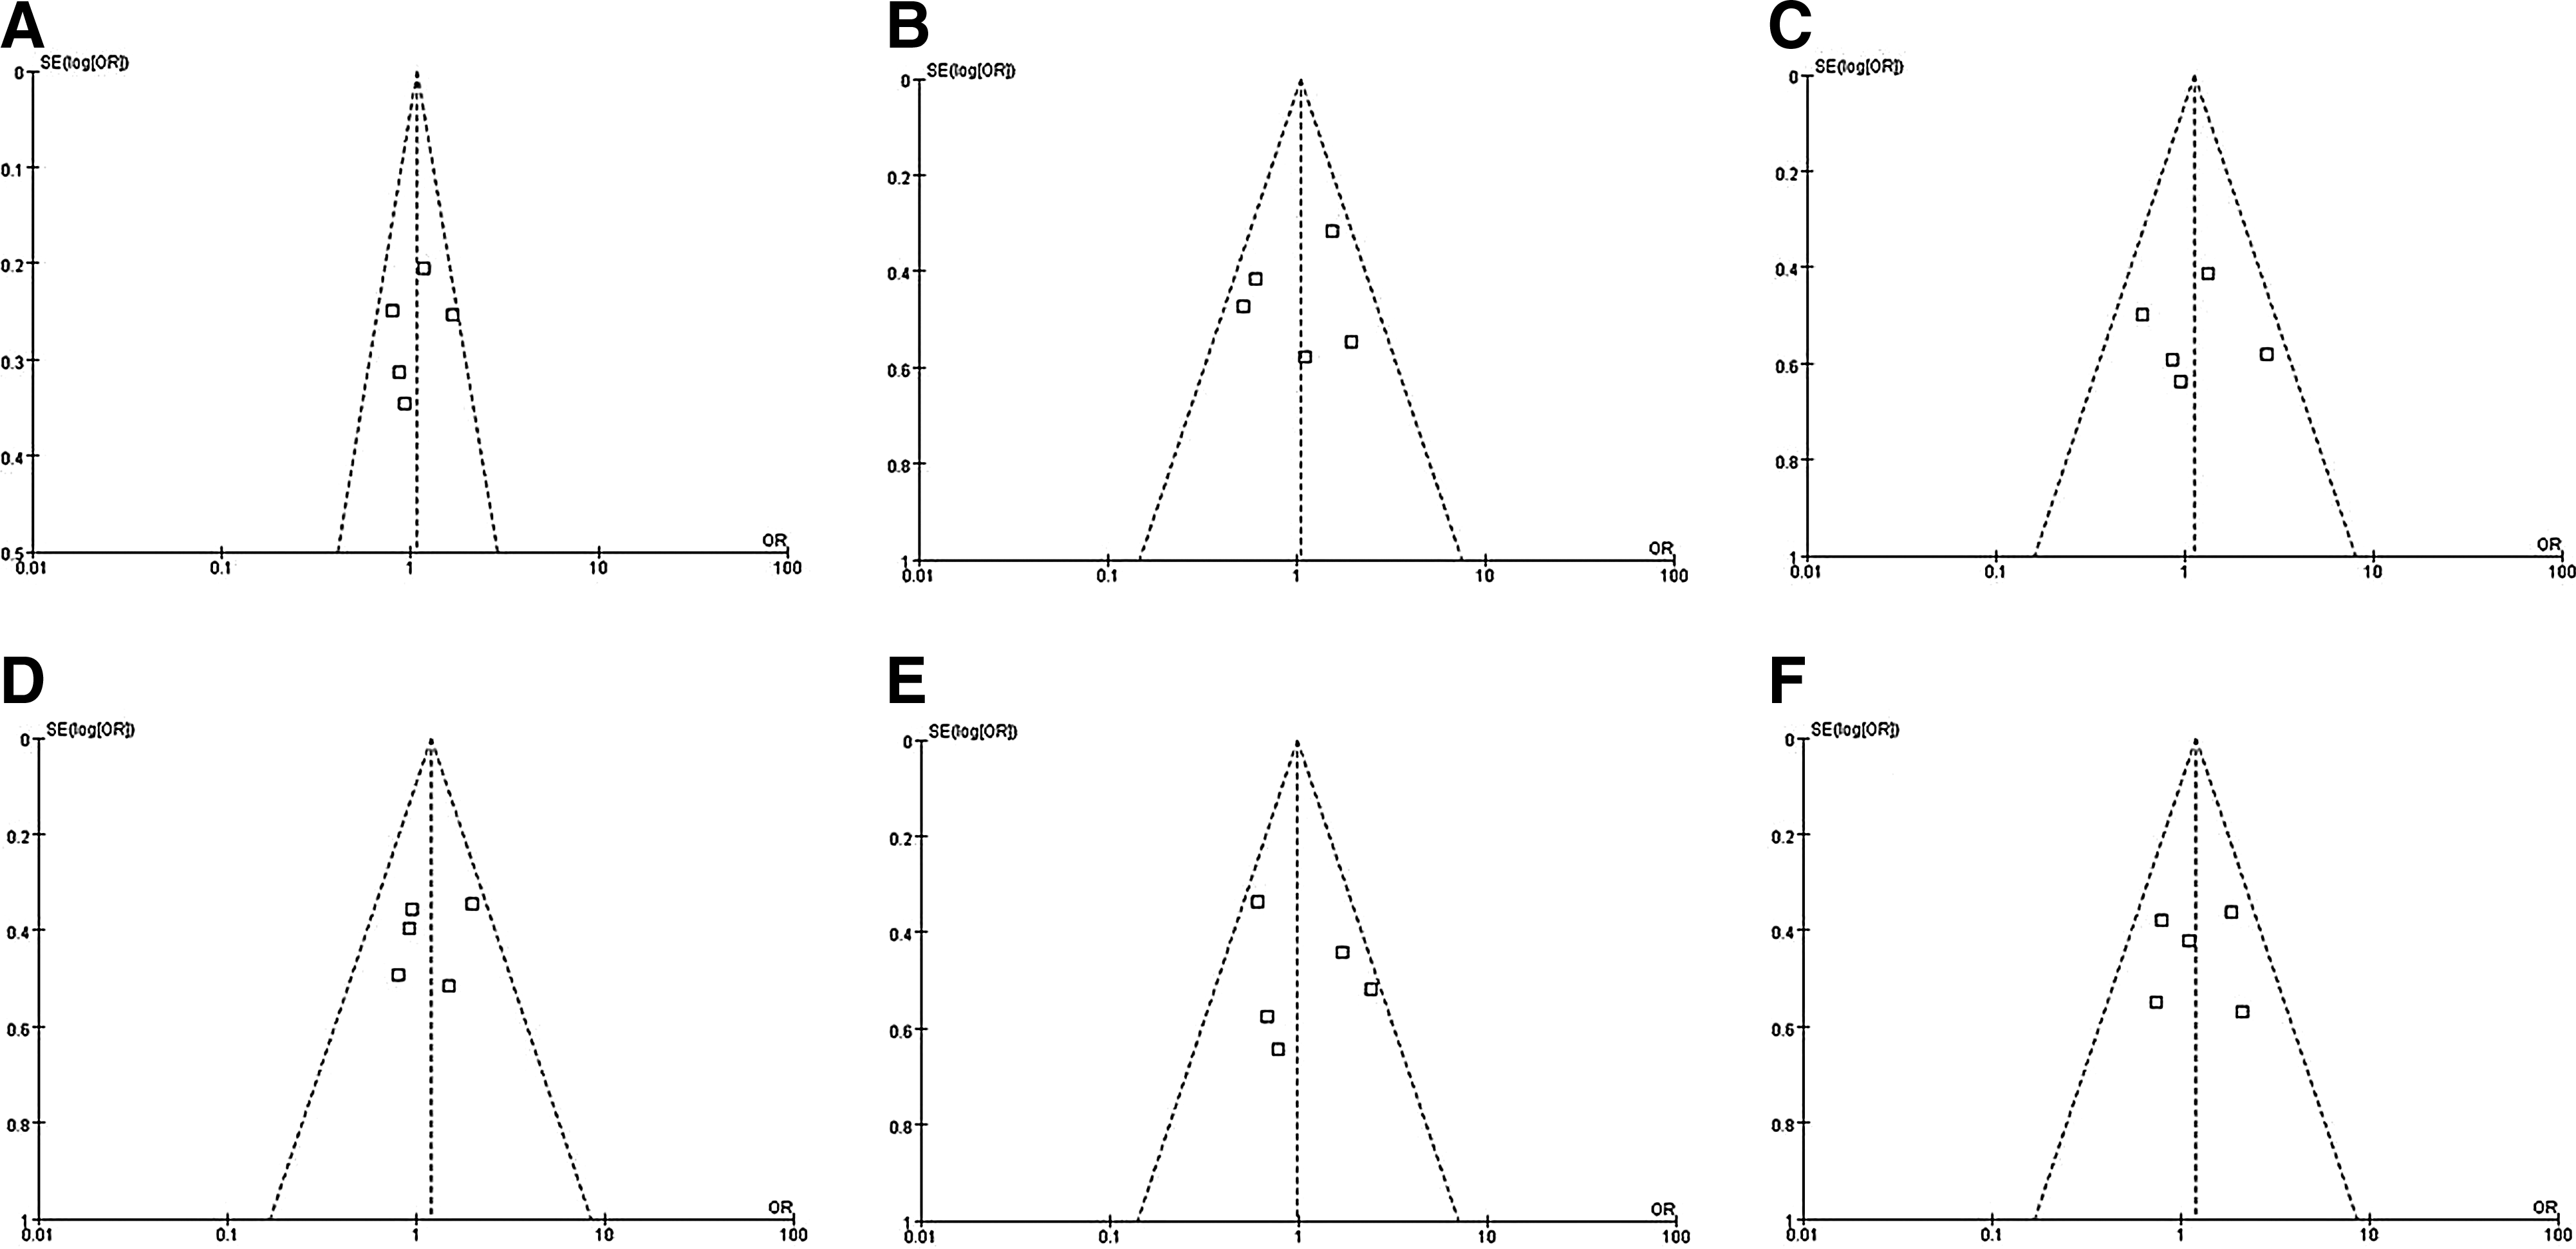
Funnel plot analysis to detect publication bias. There was no publication bias found. Each point represents a separate study for the indicated association.
Discussion
To the best of our knowledge, this was the first meta-analysis study performed to assess the association between ACE I/D polymorphisms and AMS risk. In this study, a total of 5 studies that included 333 cases and 373 controls were analyzed. The meta-analysis demonstrated that no significant differences in risk of developing AMS were found between carriers of ACE D and I polymorphism alleles.
ACE, a key component of the circulating renin-angiotensin system (RAS), cleaves the decapeptide Ang I to yield Ang II. Ang II is a powerful vasoconstrictor and also drives adrenal aldosterone release, which may contribute to AMS (Bartsch et al., 1988). Only a few studies conducted in humans have demonstrated that the I/D polymorphisms are a predisposing factor for developing AMS (Dehnert et al., 2002; Koehle et al., 2006). The reason may be that, due to the small sample sizes in most studies, the power was insufficient to detect a positive association. Conversely, results obtained from a larger sample size may be used to attain more useful information on whether these polymorphisms regulate susceptibility to AMS. Usually, the inclusion of different populations in one genetic study will decrease the power of that study. This issue, however, is inherent to the low prevalence of total AMS cases (Walker et al., 2008).
In both South American and Indian populations, it has been reported that the I allele frequency is higher in lowland migrants to altitude than in native high altitude settlements. This suggests that the ACE gene plays a role in aerobic metabolism and altitude performance (Puthucheary et al., 2011). In 2010, Qi et al. (2011) found that ACE D allele carriers were at a significantly increased risk of developing HAPE. However, our combined analysis failed to detect an allele effect. The reason may be that HAPE and AMS are two different conditions. The principal symptom of AMS is a headache, and the headache normally worsens with increased cerebral volume and the development of high altitude cerebral edema (HACE). HAPE may induce severe hypoxia that can lead to the rapid development of HACE (Thomassen and Skaiaa, 2007). Considering that ACE I/D polymorphisms account for about half of the total variance in plasma ACE levels (Rigat et al., 1990), ACE I/D polymorphisms are a likely explanation for the observed variance in plasma ACE levels. ACE might interact with additional genetic factors (e.g., Pvu II polymorphisms) (Chamberlain et al., 1989), or environmental factors may be involved in the observed individual variations in circulating ACE levels. ACE is expressed in small pulmonary arteries and contributes to hypoxic pulmonary vasoconstriction in rats (Morrell et al., 1995a), which may contribute to AMS.
There are several limitations to this study. The relative small number of eligible studies precluded us from being able to perform subgroup analyses to explore the effects of other contributors, such as gender and age. It is possible that the I/D polymorphisms are in linkage disequilibrium with another variant near the ACE gene, which results in the observed variations in plasma ACE levels. Finally, we only explored the link between ACE I/D polymorphisms and AMS, but did not examine other polymorphisms of ACE or target genes associated with AMS. The role of I/D polymorphisms, therefore, may be masked by the interactions with other genes or the environment (Qi et al., 2011).
In summary, we performed a meta-analysis to explore the association between ACE I/D polymorphisms and the prevalence of an adverse event in response to high altitude. We concluded that ACE I/D polymorphisms are not associated with AMS incidence.
Footnotes
Acknowledgments
This research was supported by the National Natural Science Foundation of China (30900715) and the National Science and Technology Ministry of China(2009BAI85B01).
Author Disclosure Statement
No competing financial interests exist.