
Abstract
Abstract
Marquez, Juan L., Scott Rubinstein, Jill A. Fattor, Omer Shah, Andrew R. Hoffman, and Anne L. Friedlander. Cyclic hypobaric hypoxia improves markers of glucose metabolism in middle-aged men. High Alt Med Biol 14:263—272, 2013.—Chronic hypoxia increases dependence on glucose in men and increases insulin sensitivity in men and women. Cyclic Variations in Altitude Conditioning (CVAC) is a novel technology that provides exposure to rapidly fluctuating cyclic hypobaric hypoxia (CHH).
Introduction
Although research exists on the relationship between hypoxia and glucose metabolism, the majority of studies investigating this relationship have used a continuous hypoxic stimulus. Continuous hypoxia, either induced artificially or via ascents to altitude, has been shown to affect markers of glucose in different ways, depending on the length of exposure. Acute exposure to continuous hypoxia increases uptake of glucose in vitro (Cartee et al., 1991), in animal models (Zinker et al., 1994), and in men (Roberts et al., 1996; Kelly et al., 2010). Over time, chronic exposure to continuous hypoxia causes glucose uptake to fall relative to acute exposure, but still to remain elevated above sea-level values (Roberts et al., 1996). Insulin sensitivity is also impacted by continuous hypoxia. Short duration hypoxia induces a transient insulin resistance while chronic continuous hypoxia improves insulin sensitivity (Larsen et al., 1997). The above adaptive responses are observed in studies that assure adequate feeding as caloric deficiencies confound the effects of hypoxia and decrease dependence on glucose (Barnholt et al., 2006). Because of potential benefits of continuous hypoxia, it has been suggested that long-term exposure (greater than 3 days) could be a beneficial strategy for controlling blood glucose in at-risk populations (Lee et al., 2003).
While continuous hypoxia may have beneficial effects on glucose metabolism, the studies that exist on the effects of “cyclic” hypoxia on glucose metabolism have mainly been done in the context of obstructive sleep apnea (OSA), a condition in which frequent, intermittent interruptions in breathing occur as a result of collapsed airways. Exposure to a single 8 hour bout of cyclic hypoxia decreases glucose tolerance (Louis and Punjabi, 2009). Similarly, long-term epidemiologic studies investigating OSA have generally established a correlation between OSA and type 2 diabetes (Reichmuth et al., 2005; Drager et al., 2010). However, long-term studies on OSA in humans have not been able to control for confounds such as obesity and sleep deprivation (Spiegel et al., 1999) associated with the condition, which can independently lead to impaired glucose tolerance.
Given the paucity of controlled studies available in healthy humans, it is difficult to predict the effects of repeated, cyclic hypoxia on glucose metabolism, such as would be experienced by users of the CVAC device. Further, comparisons between previous investigations of OSA and the reported use of CVAC are complicated by differences in the length of exposure to cyclic hypoxia, number of repeat exposure bouts, length of normoxia between hypoxic episodes, and the duration of study intervention. In addition, it is unknown how the unique nature of the rapid pressure changes generated by the CVAC device may affect glucose metabolism as, to our knowledge, all previous cyclic hypoxic studies have used cyclic normobaric hypoxia ((Polotsky et al., 2003; Peng and Prabhakar, 2004; 2005; Kumar et al., 2006; Peng et al., 2006; Iiyori et al., 2007; Aouad et al., 2008; Louis and Punjabi, 2009) which can elicit different responses than hypobaric hypoxia in certain variables (Faiss et al., 2013).
Therefore, the purposes of this study was to investigate the effects of short, repeated bouts of cyclic, hypobaric, hypoxia on glucose metabolism in human subjects. Selecting a standard protocol (as recommended by the manufacturer of CVAC) that mimics previous patterns of use in participants who anecdotally reported improvements in glucose control, we hypothesized that exposure three times a week for 40 minutes per day for 10 weeks would improve markers of glucose metabolism in middle-aged men at risk for metabolic syndrome.
Methods
Subjects
Twenty-eight men were recruited from the greater Palo Alto, CA community. Subjects were considered for participation if they were between 40–60 years, nonsmoking, and mostly sedentary (<150 min/week of light-moderate physical activity). Volunteers were excluded if they suffered from cardiovascular or metabolic disease, brain injury, sinus or ear problems, claustrophobia, or any conditions that might have been exacerbated by altitude or rapid changes in pressure. All procedures were approved by the Stanford University Institutional Review Board and all subjects gave written, voluntary, informed consent before participation.
Study design
The experimental design was single-blinded, group matched, and sham-controlled. Prior to enrollment, potential subjects visited the Clinical Studies Unit (CSU) of the Veterans Affairs Palo Alto Health Care System (VAPAHCS) where they provided a health history, vital signs, and a resting ECG. Once medical approval was obtained, subjects were assigned to either a cyclic hypobaric hypoxia (CHH) intervention or a sham (SH) intervention group by a third party investigator not associated with the study. The groups were matched on age, BMI, and fasting glucose. Both interventions utilized Cyclic Variations in Altitude Conditioning (CVAC). CHH experienced rapidly fluctuating hypobaric hypoxia that simulated altitudes from sea level to 6096 m, while SH were given slowly fluctuating simulated altitude from sea level to 607 m (see below for protocol).
CVAC sessions
The CVAC device consists of a small pod-like chamber attached to a computer system that controls a strong pump that can draw air rapidly out of the chamber to increase the simulated altitude (Fig. 1a). To lower simulated altitude, air is allowed to flow back into the chamber at various speeds. Over the course of the study, subjects were given 40 min of sessions inside the CVAC device per day (two sessions sequentially per day each consisting of 20 min), 3 days a week for 10 weeks, for a total of 30 sessions or 20 hours. The cyclic hypobaric hypoxic group (CHH) began with a week of “setup sessions” during which they controlled a slow progression through increasing simulated altitudes ranging from sea level to 3048 m. These sessions were designed to familiarize the subjects to the cyclic pressures, in particular to practice equalizing ear pressures. After the set up sessions, proprietary pre-programmed sessions were administered, progressing from Tier 1 to 5. Subjects rotated through three pre-programmed sessions per Tier and each session varied the pattern and rate of change, so that subjects would experience a constantly changing stimulus at each elevation. Five weeks were allotted to progress from Tier 1 to Tier 4. At Tier 5, there was an additional 5 weeks of exposure. There were approximately 100 fluctuations in elevation per 20 min session. The progression in peak simulated altitudes ranged from sea level (SL) to 3048 m for Tier 1 and 2, SL to 4572 m for Tier 3, SL to 5486 m for Tier 4, and SL to 6096 m for Tier 5. A sample of a 20 min Tier 4 program (with elevation and accompanying oxygen saturation) is presented in Figure 1b. If subjects experienced excessive ear discomfort, they remained at lower tiers until they felt comfortable to move to the next level. If subjects were sick or otherwise had to miss more than one session, then extra sessions were added to the end of the testing protocol to keep the total number of sessions the same between subjects. Care was taken not to administer sessions to participants experiencing head congestion because of the risks associated with an impaired ability to equalize their ears.

The sham-treated group (SH) was exposed to regular, slowly-fluctuating pressures that reached a maximum altitude of 607 m for all 30 sessions. Sham sessions mimicked the noises and initial pressure-change sensations created in the CHH sessions, thus giving naïve subjects the impression that they were experiencing altitude treatment. All subjects were blind to their elevation throughout the intervention. SH subjects were told that their sessions mimicked traditional hypoxic exposure (e.g., rising to a certain simulated altitude and staying there) and, thus, the “slow rise” in altitude prevented them from feeling excessive pressure changes in their ears. To further ensure that the subjects were made unaware of their sham assignment, SH subjects were told that there were three groups in total: Fast Rise, Traditional (slow Rise), and Control. The strategies of deception were approved by the Stanford IRB as a low-risk, necessary part of the sham-control. As much as possible, subjects from different groups were kept separate to discourage talking in a way that could reveal the true nature of their group assignments. Subjects were free to read, listen to music, talk on the phone, etc. while in the CVAC device, but were asked not to fall asleep 1) to ensure they would equalize the pressure in their ears, and 2) to prevent potential altitude-associated changes in sleep breathing patterns that could affect O2 saturations. All sessions were administered by a CVAC-trained operator who remained present during the sessions and could wake subjects if they fell asleep.
Testing
Fasting blood draws, vitals, functional tests, and activity/diet questionnaires were administered at baseline, 3-week, 6-week, and 10-week time points. An Oral Glucose Tolerance Test (OGTT) was performed after a 10–12 h fast at baseline and at 10 weeks in the morning following the final CVAC session. Participants were asked to refrain from changing their diets or level of physical activity for the duration of the study. Subjects completed a 24-hour food log before their first blood draw session and were asked to follow similar intakes for each subsequent blood draw to control for diet. Subjects were asked to refrain from physical activity for 24 h prior to functional testing.
Fasting blood draws
Blood was collected consistently after a 10–12 h fast the morning after a CVAC session (except for baseline). Blood for glucose, insulin, ferritin, HbA1c, lipid panel, and complete blood count (CBC) was taken between 7:00
Oral Glucose Tolerance Test (OGTT)
OGTTs were initiated after a 12 hour fast between 7:00
Functional testing
In addition to the activity logs, changes in fitness were measured by a timed walk/run test at baseline and at the end of the 10 week intervention. Subjects were asked not to consume any caffeinated beverages within 4 h of the exercise test. The first 10 subjects of the study were instructed to complete 8 laps (581.6 m) around the VAPAHCS gymnasium at the fastest pace they could maintain. The distance was chosen based on the constraints of the environment, while still providing a strong cardiovascular challenge. Due to unforeseen construction projects, the test was later moved to a parking lot, where the subjects completed 6.5 laps (581.9 m) around the middle divider of the lot. Only one subject had run laps in both the gymnasium and the parking lot. The remaining 10 subjects performed all runs in the parking lot. The time taken to complete the distance was the primary outcome variable. Heart rate was recorded throughout the test and the average, peak, and final heart rates were compared to assess effort and did not differ between tests. Standard encouragement was given throughout the test.
Statistical analyses
Data are presented as means±standard deviation (SD). Non-paired Student's t-tests were used to determine differences in subject characteristics at baseline and the change in OGTT glucose area under the curve (AUC) pre- to post-intervention between groups. To assess significance of values over time, two-way ANOVAs (group x time or test x time) with repeat measures were used, and, where appropriate, Fisher least significant difference tests were used for post hoc analyses. Statistical significance was set at α<0.05.
Results
Subjects
Of the 28 participants recruited in this study, seven participants dropped out of the study, four from CHH and three from SH (CHH: one due to an abnormal blood test at baseline, and three due to inability to equalize ears; SH: one unrelated to intervention, one due to time constraints, one due to being diagnosed with uncontrolled hypertension). Therefore, 21 men completed the study. The CHH and SH groups were similar in age, weight, and BMI at baseline and remained weight stable throughout the intervention [CHH subjects (n=11, age: 48±6 years, weight: 86±12 kg, BMI: 27.1±3.2 kg/m2), SH subjects (n=10, age: 50±4 years, weight: 89±15 kg, BMI: 27.5±2.9 kg/m2)]. According to self-reported activity levels, there was no change in physical activity throughout the course of the study in either group.
Progression of the intervention
As mentioned previously, over the course of the intervention 5 weeks were allotted to progress from Tier 1 (CHH, 3048 m) to Tier 4 (CHH, 5486 m), with an additional 5 weeks of exposure at Tier 5 (CHH, 6096 m). On average, CHH subjects took 6.1±0.6 weeks to reach Tier 5 and SH took 6.5±1.1 weeks to reach the sham Tier 5. If a participant was unable to complete the training regimen in 10 weeks, sessions were given in subsequent weeks until 20 hours of exposure time was reached. There were three reasons given for extending the training time; illness, vacation, and inability to equalize ears. Two of the CHH subjects were unable to progress past the simulated altitude of the Tier 1 (3048 m) because of an inability to equalize their ears in the rapidly changing pressures at the higher simulated elevations and therefore were excluded from the analyses. The average time it took to complete the training was 11.8±1.4 weeks and 11.0±0.9 weeks for the CHH and SH groups, respectively.
Arterial oxygen saturation
The pulsatile nature of the sessions, the variable pattern of pulses, and the steady acclimatization process made meaningful mean oxygen saturation values difficult to obtain during the exposure sessions (a typical example of O2 saturation changes is presented in Fig. 1b for an initial T4 session). As shown, the lowest O2 saturations reached approximately 68%. To address this problem, a standardized 7 minute 5486 m elevation test was given to subjects in the CHH group at the start of Tier 4 and at the end of the intervention to obtain an estimate of hypoxic stimulus intensity. Although not ideal for determining the full acclimatization effects of overall intervention (because of the previous exposures at lower simulated altitudes), the start of Tier 4 was selected as a compromise between conflicting needs of stimulus and safety (i.e., testing them earlier at a lower elevation would not have been a strong enough stimulus to lower the blood oxygen saturation), but subjects could not be brought up to high elevation without some acclimatization. The test consisted of 2 min of gradual rise to 5486 m, 3 min of steady exposure, and then 2 min to get back to sea level. The saturations during the last minute of the 5486 m exposure were 74.4±2.6% and 75.6±3.0% for the start of Tier 4 (approximately week 4) and the end of the intervention, respectively. This saturation test could not be given safely to the SH group because they were not acclimatized to the high simulated elevation at any point during the intervention.
Fasting plasma glucose
At enrollment, mean fasting plasma glucose concentration was not different between groups (Fig. 2). However, there was a decrease of 6 mg/dL in the CHH group after 10 weeks, while the SH group increased 3 mg/dL, resulting in a significant difference between groups by week 10 (p<0.05). As well, there was a significant group by time interaction in fasting glucose concentration (Fig. 2).
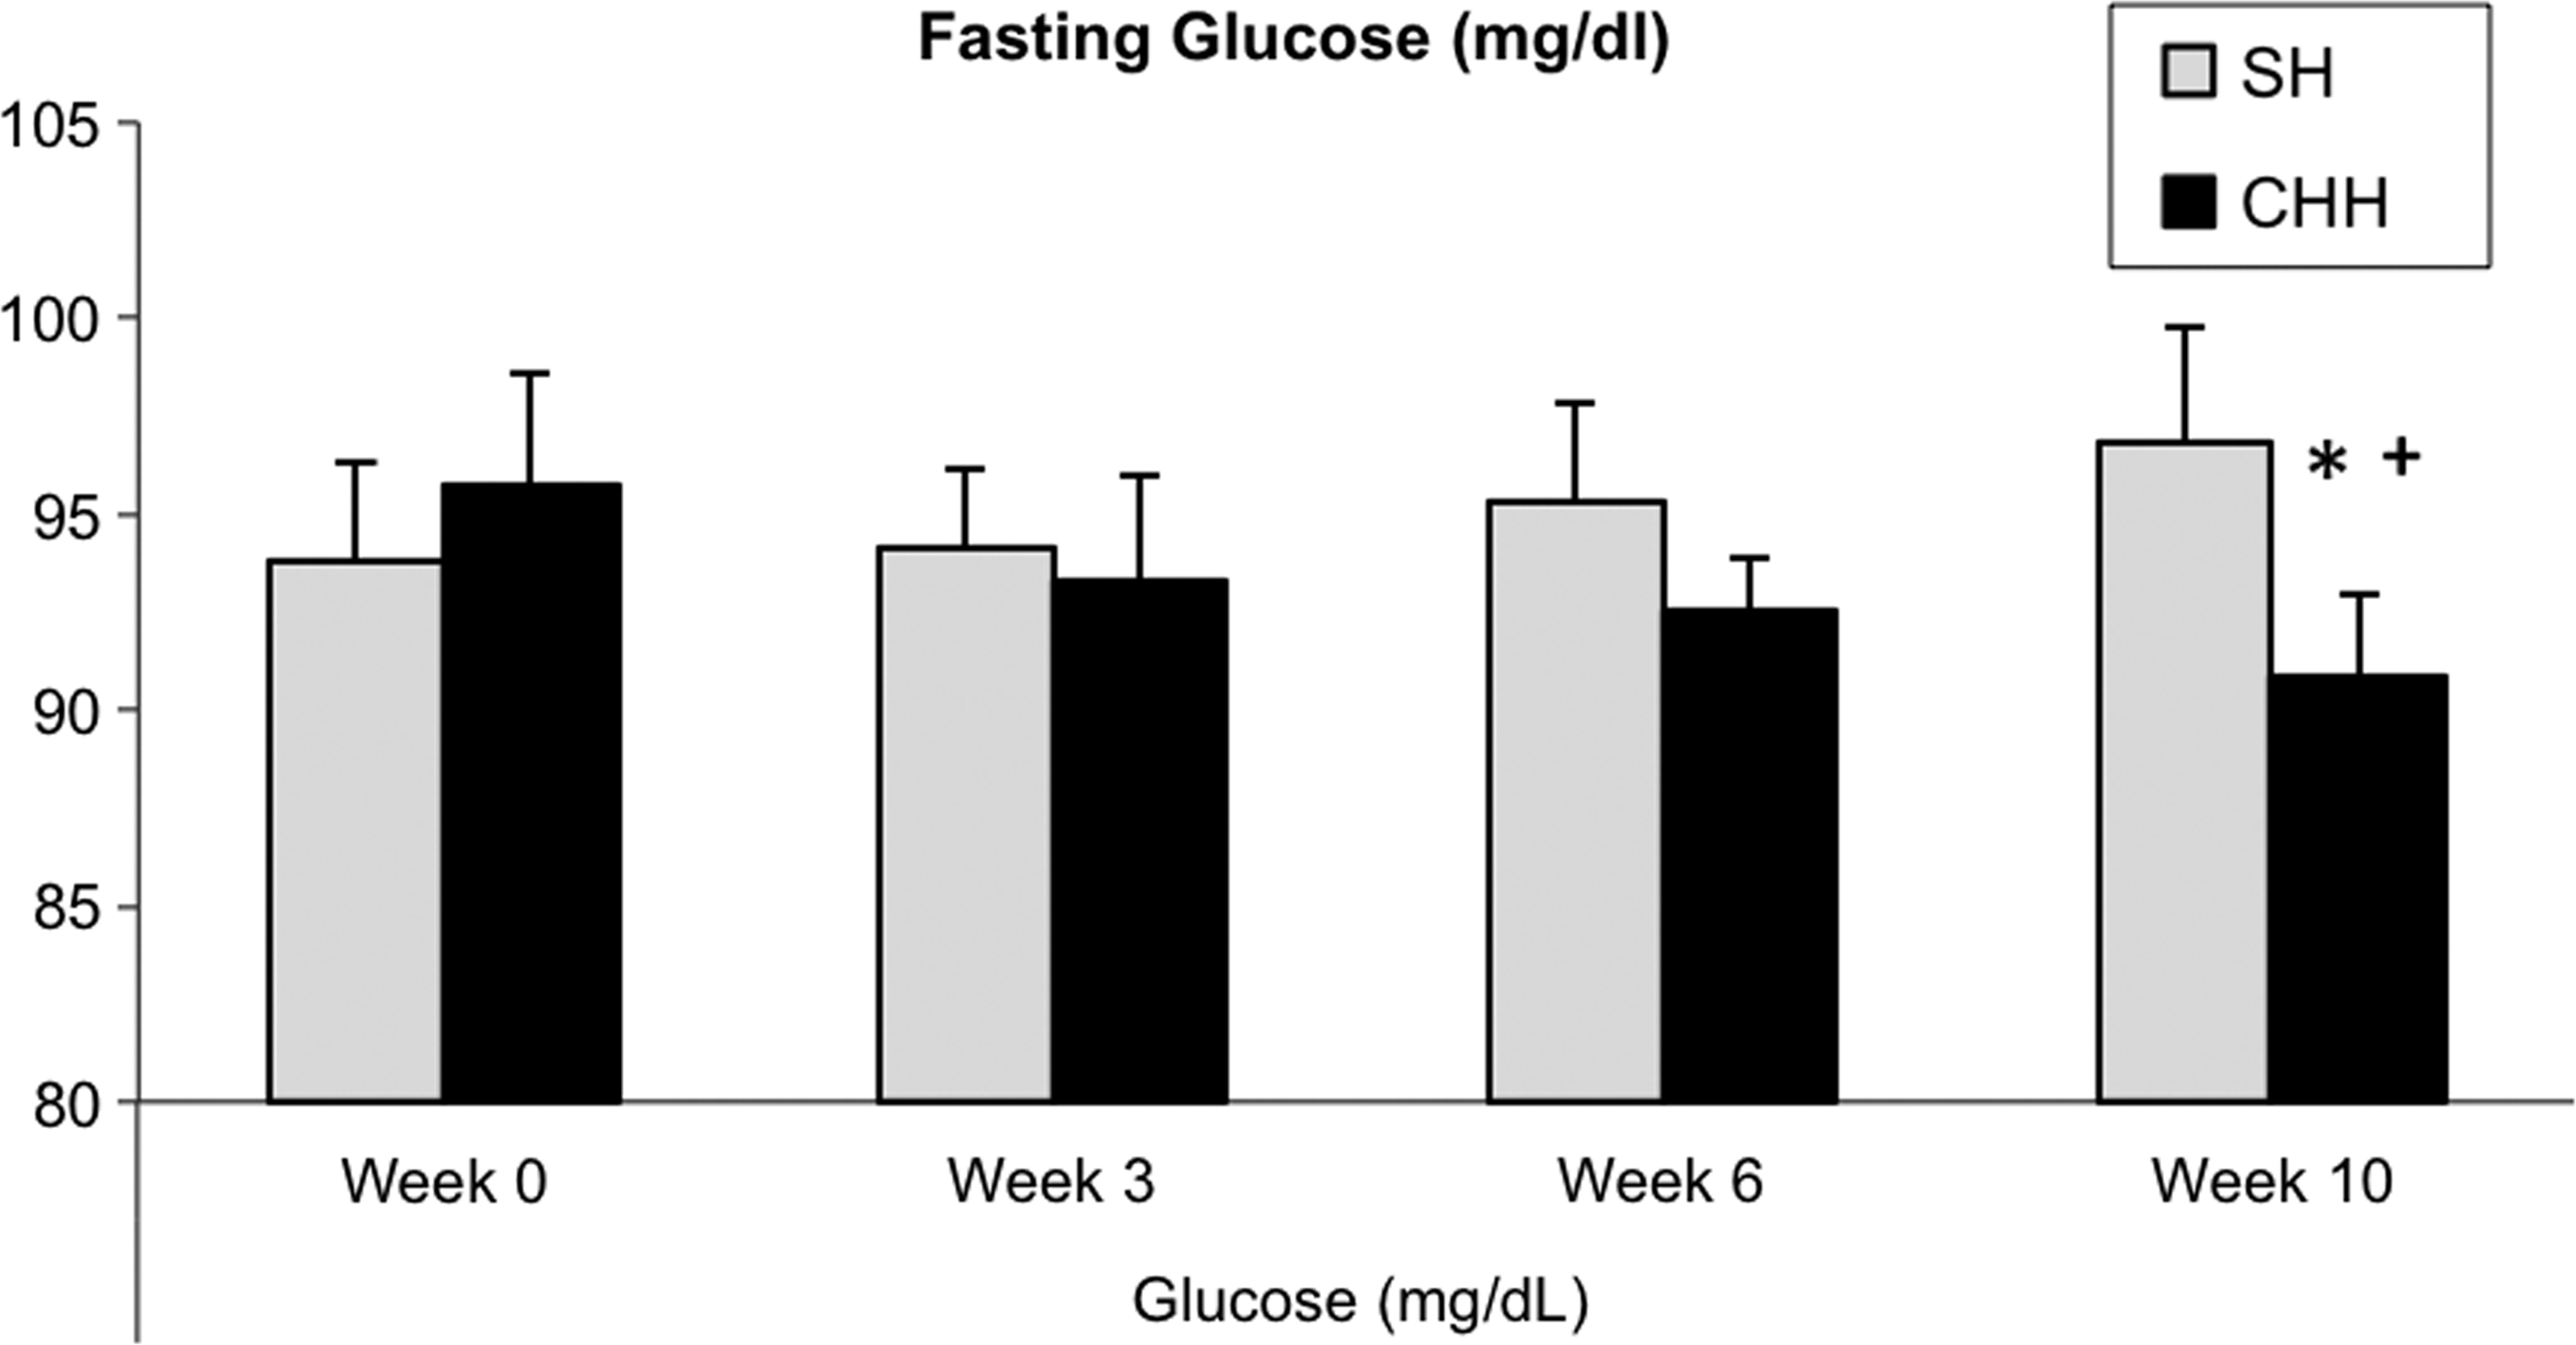
Fasting glucose levels in the sham (SH, n=10) and cyclic, hypobaric hypoxia (CHH, n=9) group over the 10 week intervention. Significant group by time interaction at p<0.02; *significantly different from SH at p<0.05;+significantly different from baseline at p<0.05.
Oral glucose tolerance test
The change in plasma glucose over time in response the OGTT test is illustrated in Figure 3 showing a difference between CHH and SH groups at 60 and 90 min of the test (p<0.05). Area under the curve was calculated for the glucose response during the OGTT and presented as a change from baseline for the two groups in Figure 4. Change in AUC was different between CHH and SH (p<0.03). Insulin values during the OGTT were not different between groups or over time, although the CHH group showed a tendency towards a decreased insulin response to the OGTT after 10 weeks as compared to the SH group (Fig. 5). Oral glucose insulin sensitivity (OGIS) index (Mari et al., 2001) did not significantly change in the CHH group but showed a small decline in the SH group (p=0.025, data not shown) between baseline and 10 weeks.
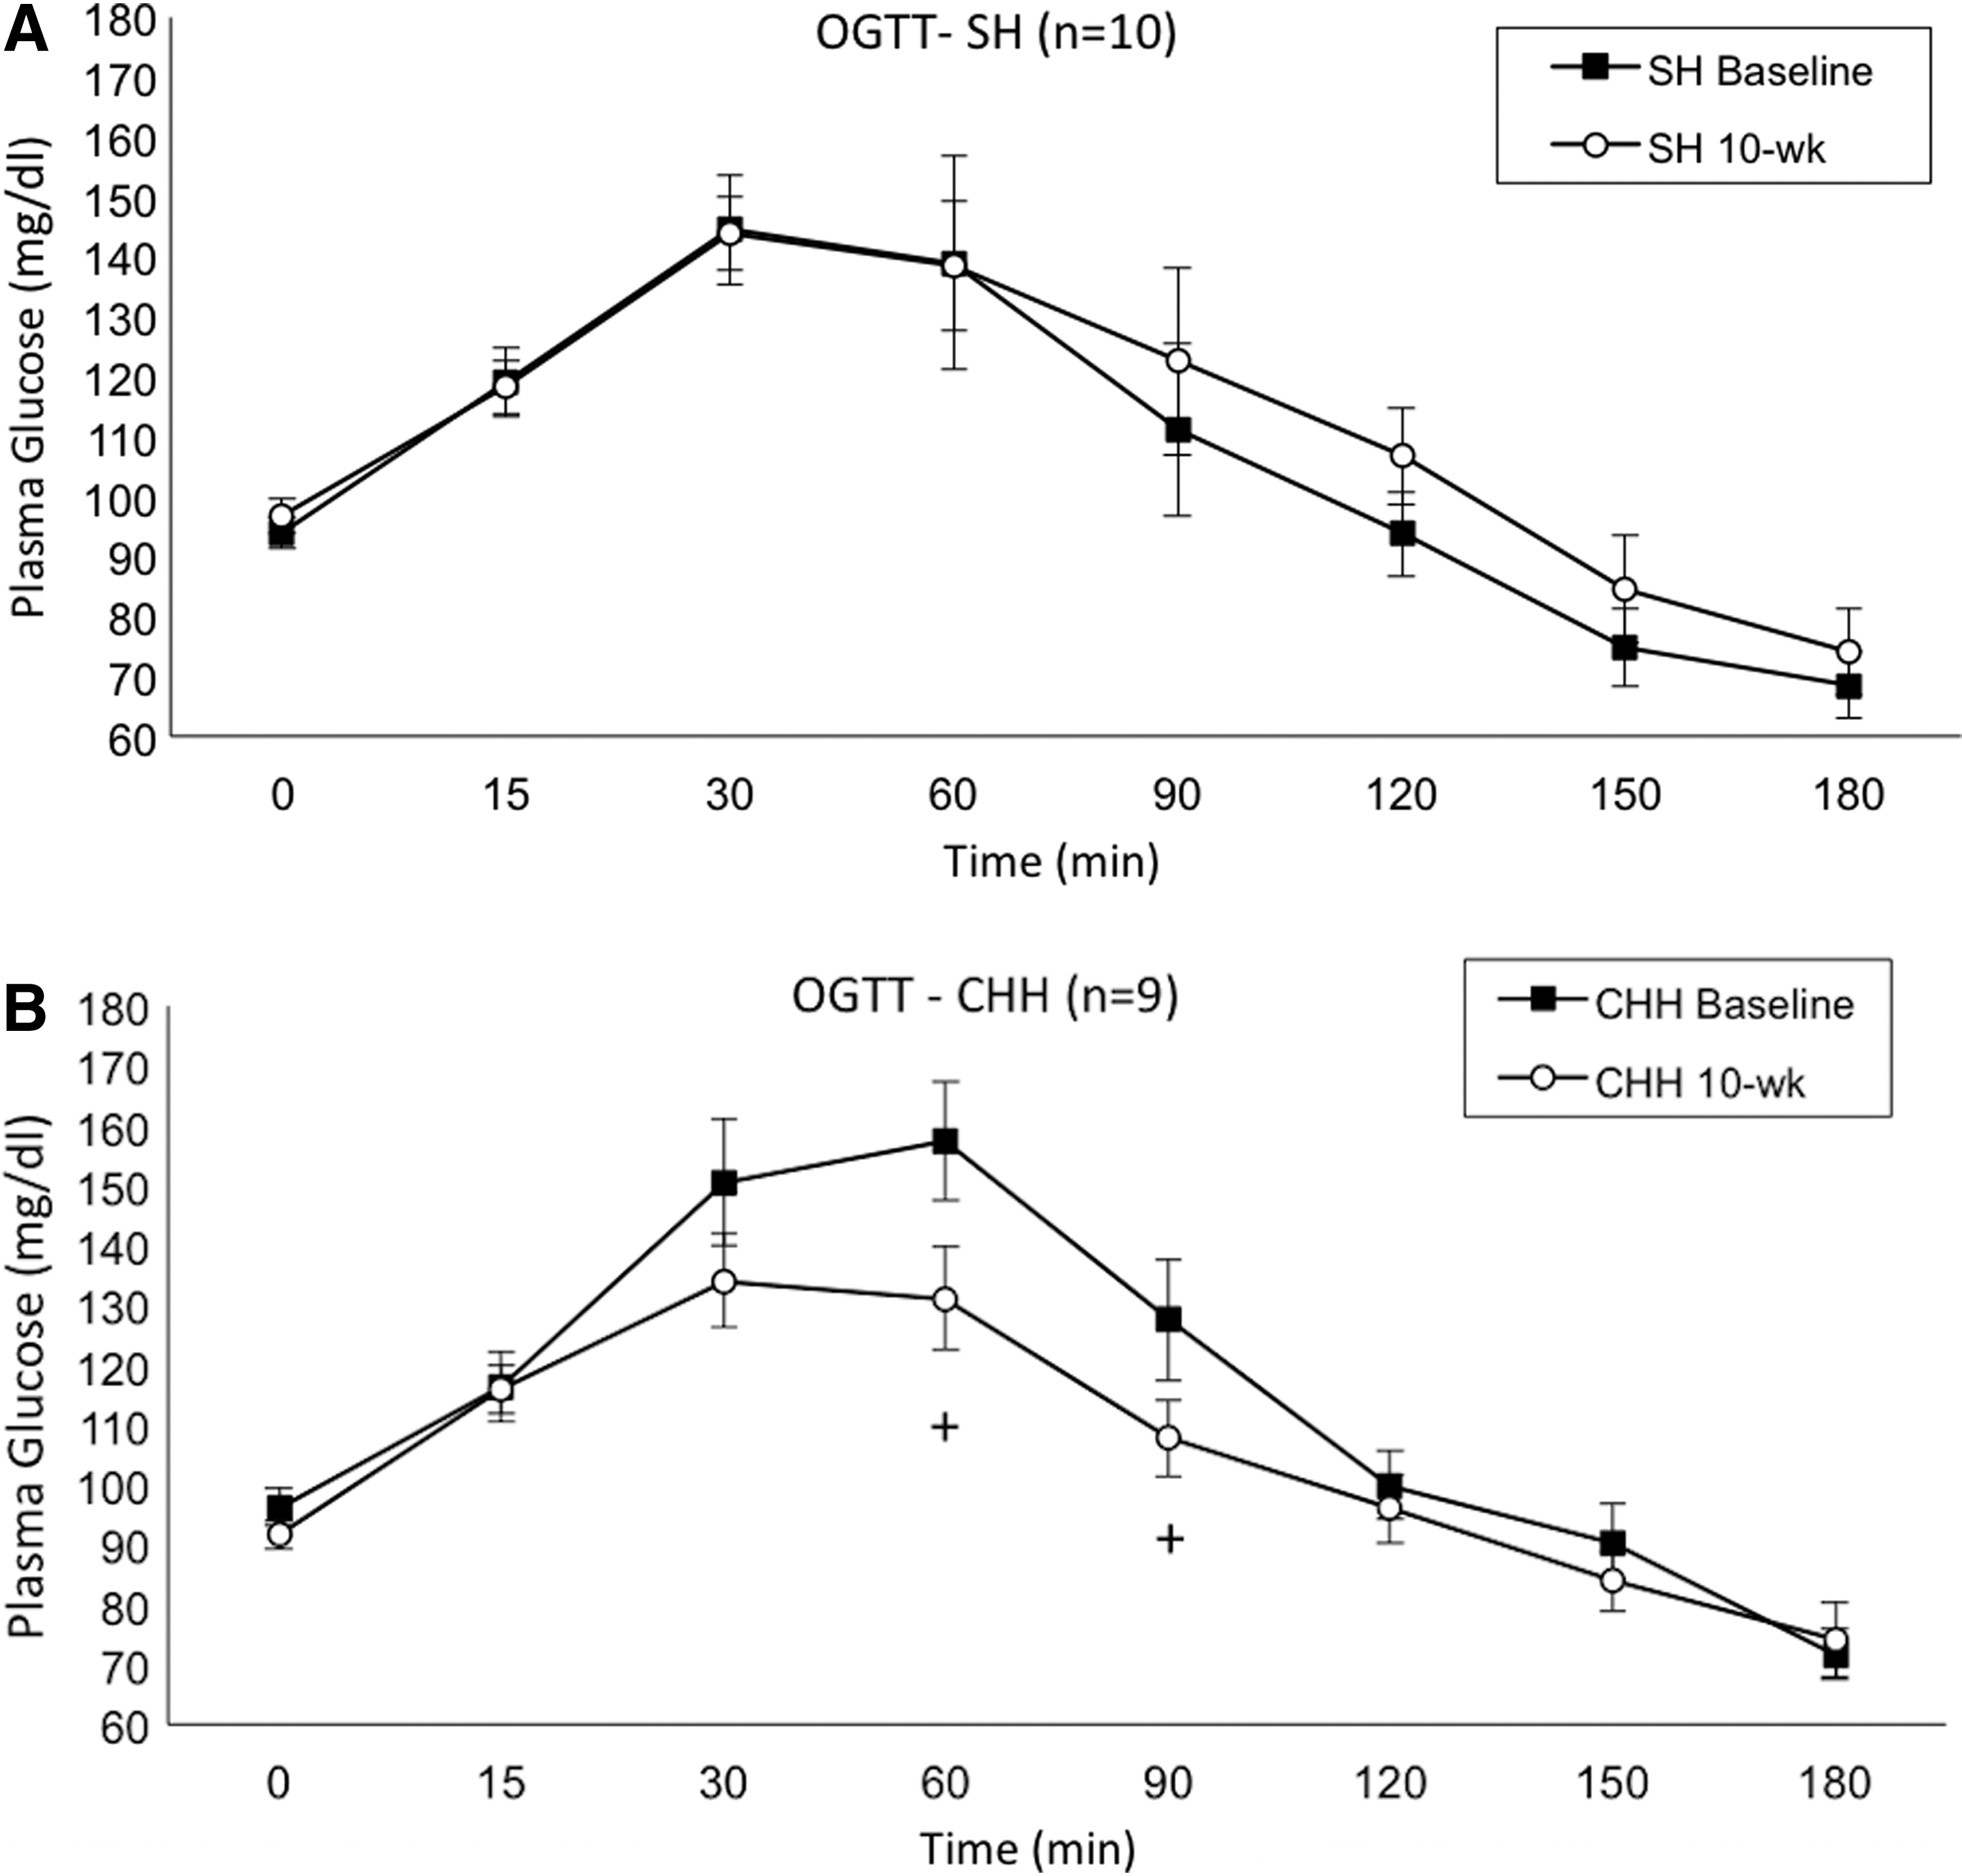
Plasma glucose response to an oral glucose tolerance test before and after the 10 week intervention for
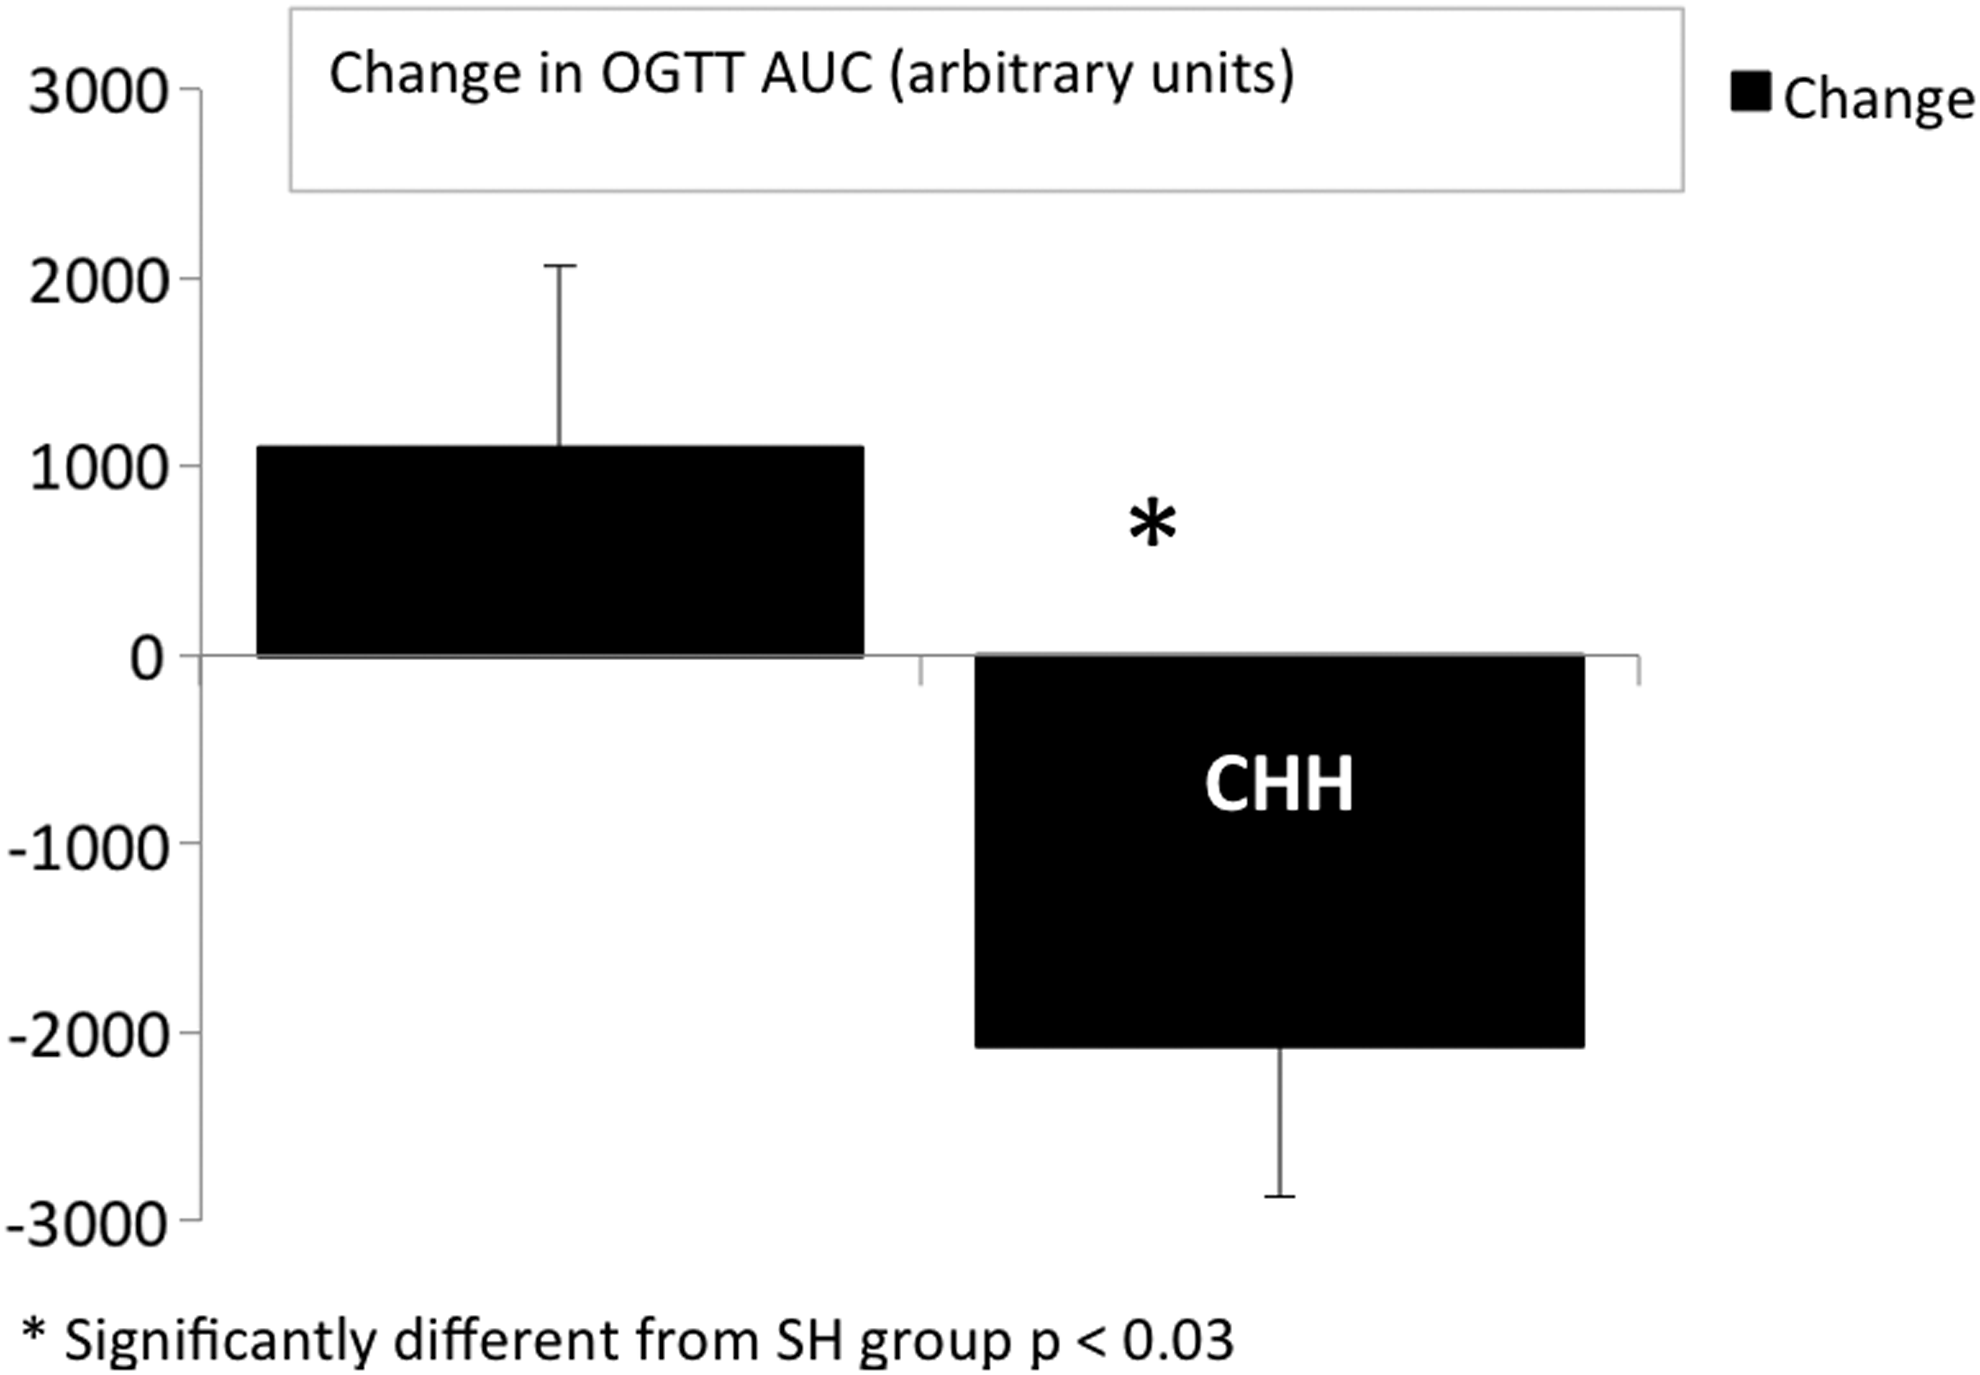
Change in area under the curve (AUC) of glucose in response to an oral glucose tolerance test before and after 10 weeks of cyclic hypobaric hypoxia (CHH, n=9) or sham control treatment (SH, n=10). *significantly different from sham at p<0.03.
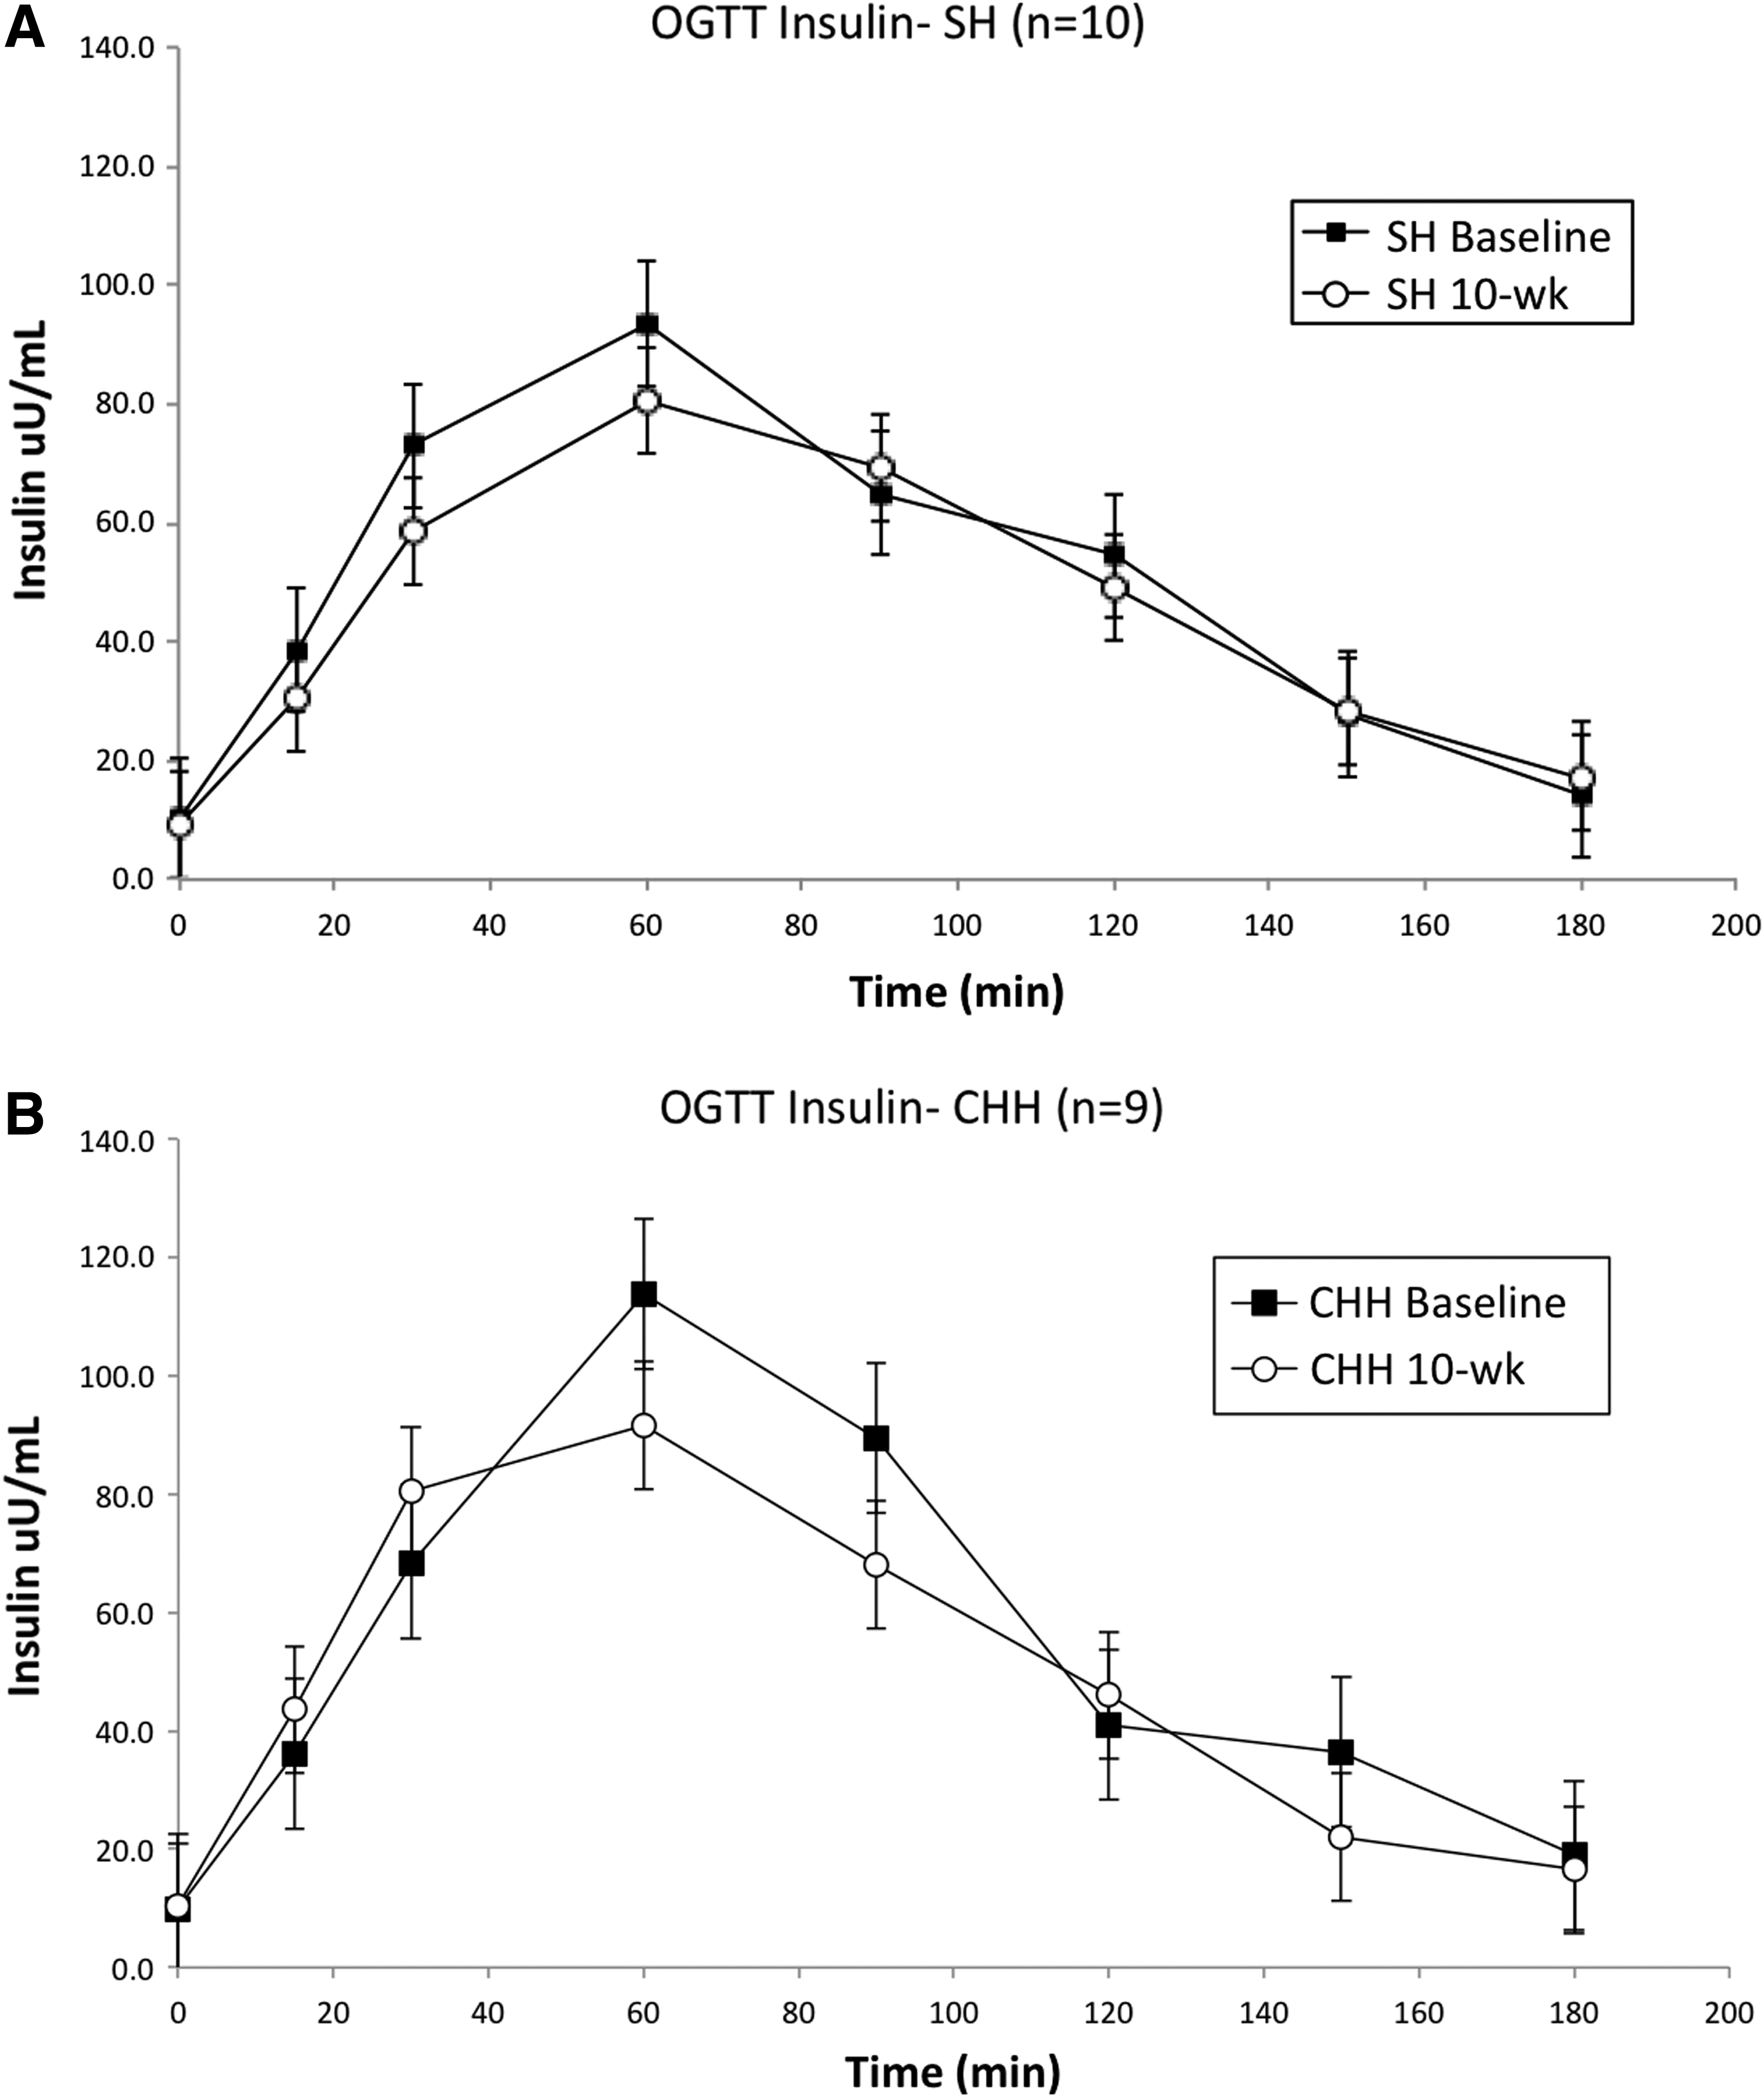
Insulin response to an oral glucose tolerance test before and after the 10 week intervention for
Other blood measures
There were no changes in the other fasting blood measures which included hematocrit, HbA1c, total cholesterol, and insulin (Table 1). Homa-B, a calculated marker of beta-cell function, also did not differ significantly over time or between groups (p=0.20 and p=0.23, respectively).
No significant differences.
Functional measures
There were no significant differences over time or between groups for the timed walk/run test (baseline to week 10: 180±17 to 174±19 sec, and 198±62 to 204±75 sec for the CHH and SH group, respectively).
Discussion
The major finding of the current investigation was that 10 weeks of exposure to cyclic, hypobaric hypoxia (CHH) reduced fasting plasma glucose concentration and decreased plasma glucose response to an oral glucose tolerance test in middle-aged men. These improvements occurred without any accompanying changes in body weight, fitness (as measured by a timed walk test), or self-reported physical activity levels. There was no change in fasting insulin, markers of β-cell function, nor the insulin response to OGTT for either group. Other blood measurements did not change over 10 weeks in CHH or SH.
Cyclic hypoxia and glucose
Most of the previous investigations of cyclic hypoxia—both in animals and humans—have used only short-term exposures to hypoxia. In agreement with our results, a study by Aouad et al. (2008) using animal models exposed to two sequential 90 min sessions of cyclic hypoxia (separated by a rest period) resulted in decreased plasma glucose and insulin levels by the end of the second hypoxic exposure. In contrast, Iiyori et al., (2007) found that a short-term (9 h) bout of cyclic hypoxia in mice led to decreases in insulin sensitivity and decreased muscle glucose utilization (in the soleus muscle) as compared to the control group that only received normoxic air. A similar result was seen in waking human subjects who demonstrated a decrease in insulin-dependent and -independent glucose uptake after 8 h of cyclic hypoxia (Louis and Punjabi, 2009). Although no human studies have been conducted to investigate possible effects of long-term cyclic hypoxia, Polotsky et al. (2003) found that 5 days of exposure to cyclic hypoxia improved fasting glucose and glucose tolerance in healthy mice. A long-term arm of that study showed decreased glucose tolerance after 12 weeks. However, this arm was confounded by the use of obese, leptin-deficient mice that the authors claimed played a key role in altering the effects of cyclic hypoxia on glucose metabolism.
The timing of the glucose measurements relative to the exposure may explain some of the conflicting results observed with cyclic hypoxia. Yokoe et al. (2008) found that while exposure to cyclic hypoxia increased blood glucose in mice during the actual hypoxic exposure, blood glucose decreased significantly within 12 h after the exposure compared to the control group. The authors coined this effect “rebound increase in insulin sensitivity” (Yokoe et al., 2008). The same study also found an increase in pancreatic beta-cells replication after 4 days of 12 h bouts of exposure to cyclic hypoxia and increases in pancreatic beta-cell mass after 4 weeks of hypoxic exposure (Yokoe et al., 2008). As with the human chronic exposure data, these findings further support that exposure to cyclic hypoxia may transiently induce insulin resistance during the hypoxic stress, but the body appears to adapt to the stress by increasing both insulin-dependent and possibly insulin-independent glucose uptake. Our measurements were made 18–24 h after the most recent hypoxic exposure, thus avoiding the possible short window of insulin resistance.
Because of the dearth of data on cyclic hypoxia and glucose metabolism, comparisons between obstructive sleep apnea (OSA) and CVAC are inevitable. As previously discussed, OSA is associated with complications and co-morbidities that may or may not be caused by intermittent hypoxic exposure during sleep. However, the hypoxic exposure delivered in our study was short in duration with a relatively long recovery period between sessions, as opposed to patients with OSA who have prolonged periods of cyclic hypoxia and less time to recover between exposures. Because of this, patients with OSA may not have adequate opportunity to adapt to the transient insulin disturbances. Long-term cyclic hypoxic studies using animal models and humans are needed to show the differences definitively between the hypoxia delivered by the CVAC device vs. during OSA.
Response time: Cyclic vs. continuous hypoxia
Given the short cumulative duration of hypoxic exposure in the current study, our observed changes in glucose markers may seem surprising. However, for certain physiological adaptations, exposure to cyclic hypoxia appears to cause a more rapid response than exposure to continuous hypoxia. In animal studies that have compared equal lengths of exposures of cyclic hypoxia and continuous hypoxia, only cyclic hypoxia augmented carotid body sensitivity to hypoxia and increased hypoxic-induced catecholamine response in the adrenal medulla (Peng and Prabhakar, 2004; Kumar et al., 2006). Some data suggest that it may be the change in tissue oxygen tension that serves as the trigger for adaption to hypoxia rather than the hypoxia per se (Peng and Prabhakar, 2004; Balestra et al., 2006). Thus, CVAC exposure, with its approximately 200 changes in simulated altitude exposure of up to 6705 m within the 40 min period, could supply a strong stimulus for adaptation. Indeed, in a previous publication investigating the time course of adaptations in SaO2 response to simulated altitudes up to 6400 m during 7 weeks of CVAC exposures, the authors suggest that the acclimatization process occurred more rapidly than was reported in other investigations using more traditional exposure regimens (Hetzler et al., 2009).
Cyclic hypoxic studies (Peng and Prabjakar, 2004; Peng et al., 2006; Kumar et al., 2006) and reperfusion injury studies (Zweier, 1988) demonstrate that rapid changes in tissue oxygen availability generate reactive oxygen species, which then mediate upregulation of HIF-1 (Peng and Prabjakar, 2004). HIF-1 is a well-documented regulator of altitude acclimatization and can also induce the transcription of GLUT-1 transport proteins (Bergeron et al., 1999; Hayashi et al., 2004). Therefore, as seen in our data, cyclic hypoxia may improve glucose metabolism rapidly and without concomitant changes in insulin concentration. Several studies have observed an increase in GLUT1 protein expression and basal glucose disposal following chronic hypoxic exposure (Xia et al., 1997; Bruckner et al., 1999), but none have yet investigated the direct connection between cyclic hypoxia and GLUT1 protein content. Further, it is unknown whether the hypobaric component of the exposure (rapidly varying pressures) contributed any additional stimulus for change beyond the tissue hypoxia per se.
Response time: Glucose metabolism versus exercise performance
Not surprisingly, response times vary between outcome measures. Most commonly cited studies using intermittent hypoxia have focused on hematological parameters and exercise performance (Ricart et al., 2000; Beidleman et al., 2003; Katayama et al., 2003; Julian et al., 2004; Rodriguez et al., 2007) rather than glucose metabolism. Although the exposure in the current study of approximately 20 h of cyclic hypoxia is substantially shorter than the stimulus theorized to be required for performance adaptation (for a complete review, see Levine et al., 2006), changes in glucose metabolism appear to occur more rapidly in response to hypoxia. In patients with type 2 diabetes, even 1 h of continuous hypoxia at rest decreased blood glucose concentrations and improved insulin sensitivity compared to normoxic conditions (Mackenzie et al., 2011). Further, changes in glucose metabolism and exercise performance were directly compared in training studies by Lecoultre et al. (2010) and Haufe et al. (2008). Although hypoxia did not affect exercise performance in either study, markers of glucose metabolism were impacted in the positive direction [Lecoulte et al. (2010); improved HOMA index, insulin area under the curve and fasting insulin] and negative direction [Haute et al. (2008); increased blood glucose and insulin concentrations] and decreased glucose metabolic clearance rate was decreased in both studies (Haufe et al., 2008; Lecoulte et al., 2010)]. Therefore, although the outcomes are variable, glucose metabolism appears to be more responsive than exercise performance to hypoxia.
Limitations
This is the first study to investigate any metabolic effects of the CVAC device. Given the novel nature of CVAC, we decided first to conduct a feasibility study to explore some of the reports associated with the device. As such, a limitation of this investigation was that no mechanistic data was collected to determine the underlying causes of the improvement in glucose markers. Similarly, as there are no data on the efficacy of different exposure protocols, the protocol used in the investigation was one currently used by the company and represented a reasonable time commitment for the chosen subject population. It is unknown whether sessions of longer duration or greater frequency would lead to more robust adaptations. More controlled and extensive studies are required in the future to determine mechanisms of action and to optimize CVAC exposure procedures.
The difficulty in controlling the overall duration of the study for each participant was another limitation. To reduce the risk of ear barotrauma that can result from the pressure fluctuations of the CVAC device, subjects with illnesses postponed their sessions until they were healthy. This ensured that the total exposure to cyclic hypoxia remained consistent among subjects. However, it is unknown whether the increase in total number of weeks required for some subjects to complete the protocol affected their results. In addition, because of ear discomfort, 3 subjects withdrew, 2 subjects were not able to ascend higher than Tier 2, and one subject was not able to ascend higher than Tier 3. This may lead to future questions on the universal applicability of this device, as some people may not be able to reach the altitude necessary to achieve the positive adaptations.
Another shortcoming of the study was that the nature of the cyclic simulated altitude exposure made it difficult to devise a perfect sham treatment. Although we believe our solution was adequate given the constraints (see methods for more detail), sham participants may have surmised they were not receiving a strong hypoxic stimulus by the end of the study. However, the markers that improved over the course of the study (fasting glucose and OGTT) are relatively objective measurements that are difficult for the participants to alter consciously in the absence of changes in diet, body weight, or physical activity.
A final limitation is that the oxygen saturation was not measured in the sham group (SH), as we did not expect to find significant changes in SH oxygen saturation at such low simulated altitude. Recent studies have shown that exposure to low altitudes result in small, clinically insignificant decreases (0.42%) in oxygen saturations (Goldberg et al., 2012). Even if a decrease occurred in oxygen saturation in SH subjects, it would have minimized, rather than exaggerate, the differences between the groups.
Future directions
In this investigation, small changes in glucose markers were observed in sedentary subjects at risk for metabolic syndrome. It is unclear whether such changes are of clinical significance, although a large population study by Nichols et al. (2008), following over 46,000 members of Kaiser Permanente's Northwest region, suggests that each 1 mg/dL increase in fasting blood glucose increases the risk of diabetes by 6% in people with normal blood glucose levels. This suggests that even small changes in glucose control can have important disease implications in later years. Although a change of HbA1c in response to the intervention would have strengthened the clinical significance of our results, a) the nondiabetic subjects, b) the short duration of the protocol, and c) the fact that the glucose changes only reached significance towards the end of the intervention, likely reduced the potential responsiveness of that measure. The current investigation used subjects who were only at risk for metabolic syndrome. In the future, it would be interesting to determine whether CVAC could elicit a similar or greater benefit in individuals who already have type 2 diabetes. Although the mechanism may or may not involve changes in insulin-mediated uptake, increases in baseline glucose uptake through GLUT1 could still have a positive impact on glucose control. In addition, as previously mentioned, future animal and human studies are needed to determine the mechanisms of the adaptation as well as the optimization of the exposure regimen.
Conclusion
In summary, exposure to cyclic, hypobaric hypoxia for 40 minutes, 3 days a week over 10 weeks improved the fasting glucose and AUC in oral glucose tolerance tests in middle-age men at risk for developing metabolic syndrome. Cyclic, hypobaric hypoxia may emerge as a useful tool for studying the clinical elements of glucose metabolism and, with supporting data from future investigations, it could emerge as an interesting option to improve glucose tolerance in people at risk for developing type 2 diabetes.
Footnotes
Acknowledgments
We are truly grateful for the assistance of Forrest Schwartz and Amanda Trotter who diligently monitored many of the CVAC sessions. We would not have been able to complete the time intensive protocol without their help. This project was supported by CVAC Systems, Inc and The Stanford Center on Longevity.
Author Disclosure Statement
None of the authors have professional relationships that might present a conflict of interest.