
Abstract
Abstract
Vats, Praveen, Koushik Ray, Dhurjati Majumadar, Amitabh, Duraisamy Arul Joseph, Susovon Bayen, Almaz Akunov, Akpav Sarbaev, Shashi Bala Singh. Changes in cardiovascular functions, lipid profile, and body composition at high altitude in two different ethnic groups. High Alt Med Biol 14:45–52, 2013.—High altitude (HA) presents inhospitable environmental conditions that adversely affects human physiology and metabolism. Changes in physiological functions are reported during high altitude exposure, but the changes vary with physical state, culture habits, geographical locations, and genetic variation of individual. The present study was carried out to explore the variation in acclimatization pattern of two different ethnic groups in relation to cardiovascular functions, lipid profile and body composition. The study was carried out on 30 human volunteers (20 Indian and 10 Kyrgyz) initially at Bishkek for basal recording and on day 3, 7, 14, and 21 of high altitude (3200 m) induction and again on day 3 of de-induction. On altitude exposure significant decrease in body weight was observed both in Indian (day 14, p<0.001) and Kyrgyz (day 3, p<0.01) subjects. Decreased levels of total body water, extra cellular and intra cellular body water were also observed in both the groups. Significant reduction in body mass index (p<0.01), fat free mass (p<0.01), body cell mass (p<0.01) and body volume (p<0.01) was also observed in Kyrgyz subjects, whereas in Indian subjects the changes were not significant in these variables on high altitude exposure. Diastolic blood pressure and heart rate increased significantly on day 3 (p<0.001 and p<0.01, respectively) of induction in Indian subjects; whereas in Kyrgyz significant increase was observed on day 14 (p<0.05) in both the cases. High density lipoprotein (HDL) cholesterol levels increased significantly on day 7 of HA exposure in both the groups. Results indicate that the Indian and Kyrgyz groups report differently, in relation to changes in cardiovascular functions, lipid profiles, and body composition, when exposed to HA. The difference observed in acclimatization pattern in the two groups may be due to ethnic/genetic variation of two populations.
Introduction
The first response to HA hypoxia is the stimulation of peripheral and central chemoreceptors. Peripheral chemoreceptor stimulation in response to decreased blood oxygenation is characteristic of an individual and is also modified by external factors such as respiratory depressant and stimulants. Chemoreceptor stimulation causes increase in ventilation and sympathetic activity (Heistad and Abboud, 1980). Acute HA exposure increases both cardiac output and heart rate at rest and during exercise (Mason, 2000).
Hypercholesterolemia along with elevated blood pressure is associated with increased coronary heart disease (CHD). It has been established that the lowering of total cholesterol and increases in high density lipoprotein cholesterol have a beneficial effect in the prevention of CHD (Stampfer et al., 1991; Shepherd et al., 1995; Sacks et al., 1996). Body mass index, smoking, physical activity, alcohol consumption, and lifestyle are most frequently related to variation in circulating cholesterol (Gordon et al., 1989; de Campos et al., 2010). Poor incidence of atherosclerosis with low mortality from CHD has been reported in HA natives (Mortimer et al., 1977; Ruiz and Penazola, 1977). It has also been reported that lipid metabolism is altered in humans during HA exposure (Klaffenbach et al., 2011).
The genetic variation that exists in different populations is a product of natural selection. Lifestyle, living conditions, social environments, eating and drinking habits, and physical activities of HA natives are different from sea level inhabitants. Extreme environmental conditions of HA, i.e., low barometric pressure, high ultraviolet (UV) radiation, intense cold, high wind velocity, and low humidity produce adaptive changes in the body as a mark of natural reaction for survival. The problem of HA exposure is to deliver enough oxygen to the human body to maintain the aerobic metabolism, but no single adaptive response is applicable universally. Beall (2000) reported that Tibetan and Andean populations differ in their phenotypic adaptive responses to HA hypoxia. These two populations behave differently in their resting ventilation, hypoxic ventilator response, oxygen saturation, and haemoglobin concentration.
In the present study, difference in adaptation to HA in relation to cardiovascular function and lipid profile along with changes in body composition of Indian and Kyrgyz residents of different geographical locations were evaluated under similar conditions of HA exposure.
Materials and Methods
Study location and subjects
The study was conducted on 20 Indian and 10 Kyrgyz healthy male volunteers of the age group 21 to 30 years (Mean±SD=25.2±3.05) and 21 to 32 years (mean±SD=24.5±4.43), respectively. All the volunteers (Indian and Kyrgyz) were low landers and none of the volunteers has been to high altitude before this study. The studies were carried out initially at Bishkek, Kyrgyzstan for basal recording; thereafter, they were moved to an altitude of 3200 m (Tuya Ashuu Pass, Kyrgyzstan) for HA studies. Subjects were moved to altitude by road, and it took about 3 h to arrive at 3200 m from Bishkek. After a stay of 21 days subjects were returned back to Bishkek for de-induction studies. Atmospheric temperature ranged from 28–35 °C at Bishkek and 5–20 °C at Tuya Ashuu, whereas inside the rooms the temperature was maintained at 22±2 °C. At HA proper winter clothing was provided to all the subjects. Subjects followed proper acclimatization schedule and engaged in indoor games, watching television, playing table tennis, billiard, etc. along with morning exercises, walking, and other galley duties at HA.
Subjects were informed of the study protocols and risk factors prior to being evaluated and gave written consent for participation in the study. Study protocol was approved by Institute's Ethics Committee. Studies were carried out on day 3 after induction to Bishkek, on day 3, 7, 14 and 21 after induction to HA, and on day 3 of de-induction to basal.
Body composition
Body mass was recorded using an electronic platform balance (Deca 770, Seca corporation, USA) and height were recorded using a calibrated height rod (Seca Ltd, Medical Scale and Measuring System, Birmingham, UK; least count 1 mm). Body composition and hydration levels were measured using bioelectrical impedance analysis (BIA). Body composition measurement includes body fat, body water, cell solids, body minerals, etc. Changes in body hydration levels were measured as changes in total water content of the body (total body water, TBW), which included both intracellular and extracellular water. Recording was performed using a Maltron BioScan 920-2 multi frequency analyser (5, 50, 100 and 200 kHz alternate current) by the same operator throughout the study using standard operation procedure of the equipment as mentioned in the operation manual. The test was performed using four surface electrodes applied to the right hand and foot. On the hand the electrode were applied directly below the third knuckle of the middle finger and the second on the crease of the wrist. On the foot the first electrode was applied directly where the second and third toe meet the foot and second at the crease of the ankle in line with shin bone. The distance between the electrodes was measured and maintained when a new test was conducted on the same person. Measurements were done between 8–10
Biochemical estimation
Blood samples were collected between 6 and 8
Statistical analysis
The data were analysed using Prism 5 software (Graph Pad, USA). To compare the changes in the same group in different phases, data were analysed using one way analysis of variance (ANOVA) with repeated measure and post hoc testing with Bonferroni multiple comparison test. A p value of <0.05 was considered significant.
Results
Body weight, body mass index, and fat free mass
In the Indian subjects body weight decreased slightly on induction to high altitude, but the changes were significant (p<0.001) on day 14 of high altitude exposure (Table 1). Whereas, in the Kyrgyz subjects body weight decreases significantly (p<0.01) on day 3 of exposure and remained almost the same up to day 14 and decreased again on day 21. On de-induction there was a significant increase in body weight in the Kyrgyz group (Table 2).
Values are mean±SEM.
HA=high altitude, D3=Day 3, D7=Day 7, D14=Day 14, D21=Day 21, DI=De-induction.
=in comparison to basal,*=p<0.05,**=p<0.01,***=p<0.001.
Values are mean±SEM.
HA=high altitude, D3=Day 3, D7=Day 7, D14=Day 14, D21=Day 21, DI=De-induction.
=in comparison to basal,*=p<0.05,**=p<0.01,***=p<0.001.
No significant changes were observed in body mass index (BMI) and body fat on induction to high altitude in the Indian group but significant decrease in body fat and increase in fat free mass (FFM) were observed on de-induction (Table 1). Kyrgyz subjects showed a significant decrease in BMI and FFM during HA exposure as compared to basal values. Lowest level of FFM was observed on Day 21, which recovered and at par with basal level on de-induction (Table 2).
Body water
There was a decrease in TBW levels on HA exposure in Indian subjects, but the decrease was significant only on day 14 (p<0.01) as compared to basal levels. Thereafter, the levels headed toward normal. No significant changes were observed in intracellular water (ICW) values on HA exposure, whereas in case of extra cellular water (ECW) significantly low levels were observed on days 3 (p<0.001) and 14 (p<0.01) of HA exposure as compared to basal levels. On de-induction body water levels raised and values of TBW, ICW and ECW levels were higher than the basal values. Nonsignificant changes were observed in ECW/ICW ratio during HA exposure, but the values were significantly higher on day 3 of de-induction (Table 1). In the Kyrgyz group, there were continuous and significant decreases in TBW levels up to day 21 (p<0.001) of HA exposure as compared to basal values. Body water level increased on de-induction as compared to HA values and was almost equal to basal values. Both ICW and ECW levels decreased significantly on HA exposure in Kyrgyz subjects, and the lowest level was observed on day 21 (p<0.001) of HA exposure; whereas the ECW/ICW ratios were significantly lower on days 7 (p<0.05) and 21 (p<0.001) only, which increased on de-induction (Table 2).
Body cell Mass
Slightly decrease in body cell mass (BCM) was observed in the Indian group up to day 14 of HA exposure and on day 14 the decrease was statistically significant (p<0.05). Thereafter, BCM started increasing and on de-induction the levels were significantly higher than basal and HA values; whereas significantly low levels of extra cellular mass (ECM) and extra cellular fluid (ECF) were observed on days 3 (p<0.01) and 14 (p<0.01), which increased on de-induction (Table 1). In Kyrgyz subjects BCM decreased significantly on day 3 (p<0.01) and that lower level was maintained up to day 14, thereafter a further decrease was observed on day 21 (p<0.001) and significantly increased on de-induction (Table 2).
Total body protein, body volume & muscle mass
No significant change was observed in total protein, body volume, and mineral mass in Indian subjects, whereas in Kyrgyz subjects significant decrease was observed in body volume on HA exposure. The Indian group showed decrease in body potassium and calcium on HA exposure up to day 14, but the decrease was significant only on day 14 (p<0.05). The Kyrgyz subjects showed a slight but significant decrease in body calcium and potassium on day 3 (p<0.01) and this remained low up to day 21. On de-induction the levels were recovered and reached basal level.
A slight decrease in muscle mass was observed on HA exposure in Indian volunteers, but the decrease was significant only on day 14 of exposure (Table 1). In the case of Kyrgyz subjects muscle mass decreased significantly on day 3 of HA exposure and remained low up to day 21. The levels were recovered only after de-induction (Table 2). Decreases in body glycogen levels were observed in both the groups on HA exposure, but the changes were significant only in case of the Kyrgyz group.
Lipid profile
A significant increase in triglyceride levels was observed in the Indian group on day 14 (p<0.05) of HA exposure. In the Kyrgyz group triglyceride levels decreased on HA exposure, but the change was significant only on de-induction (Fig 1a). Not much change was observed in total cholesterol levels in Indian subjects and Kyrgyz subjects (Fig.1a). A statistically significant increase in HDL cholesterol was observed on day 7 of exposure in both the groups. LDL cholesterol decreased on day 7 in both the groups but the changes were not significant (Fig. 1b).

Changes in lipid profile of Indian and Kyrgyz volunteers in different phases. Values are mean±SEM. HA=high altitude, D3=Day 3, D7=Day 7, D14=Day 14, D21=Day 21, DI=De-induction. *=in comparison to basal for Indian, *=p<0.05, **=p<0.01, ***=p<0.001. #=in comparison to basal for Kyrgyz, #=p<0.05, ##=p<0.01, ###=p<0.001.
Blood pressure and heart rate
Indian subjects had higher systolic blood pressure (SBP) at basal in comparison to Kyrgyz subjects. In both groups a nonsignificant increase in SBP was observed on HA exposure. The increase in SBP was significant only on day 14 of exposure in both groups, which decreased to almost basal value on de-induction. In Indian subjects the diastolic blood pressure (DBP) increased significantly on day 3 and remained significantly high during the HA tenure. In Kyrgyz subjects the increase in DBP was significant only on day 14, which returned to normal on de-induction (Fig. 2a). Heart rate (HR) also increased in both groups on HA exposure. Indian subjects showed significant increase in HR on day 3, which returned to near basal values on subsequent days of exposure, whereas in the Kyrgyz group the increase was significant on day 14 and 21 (Fig. 2b).
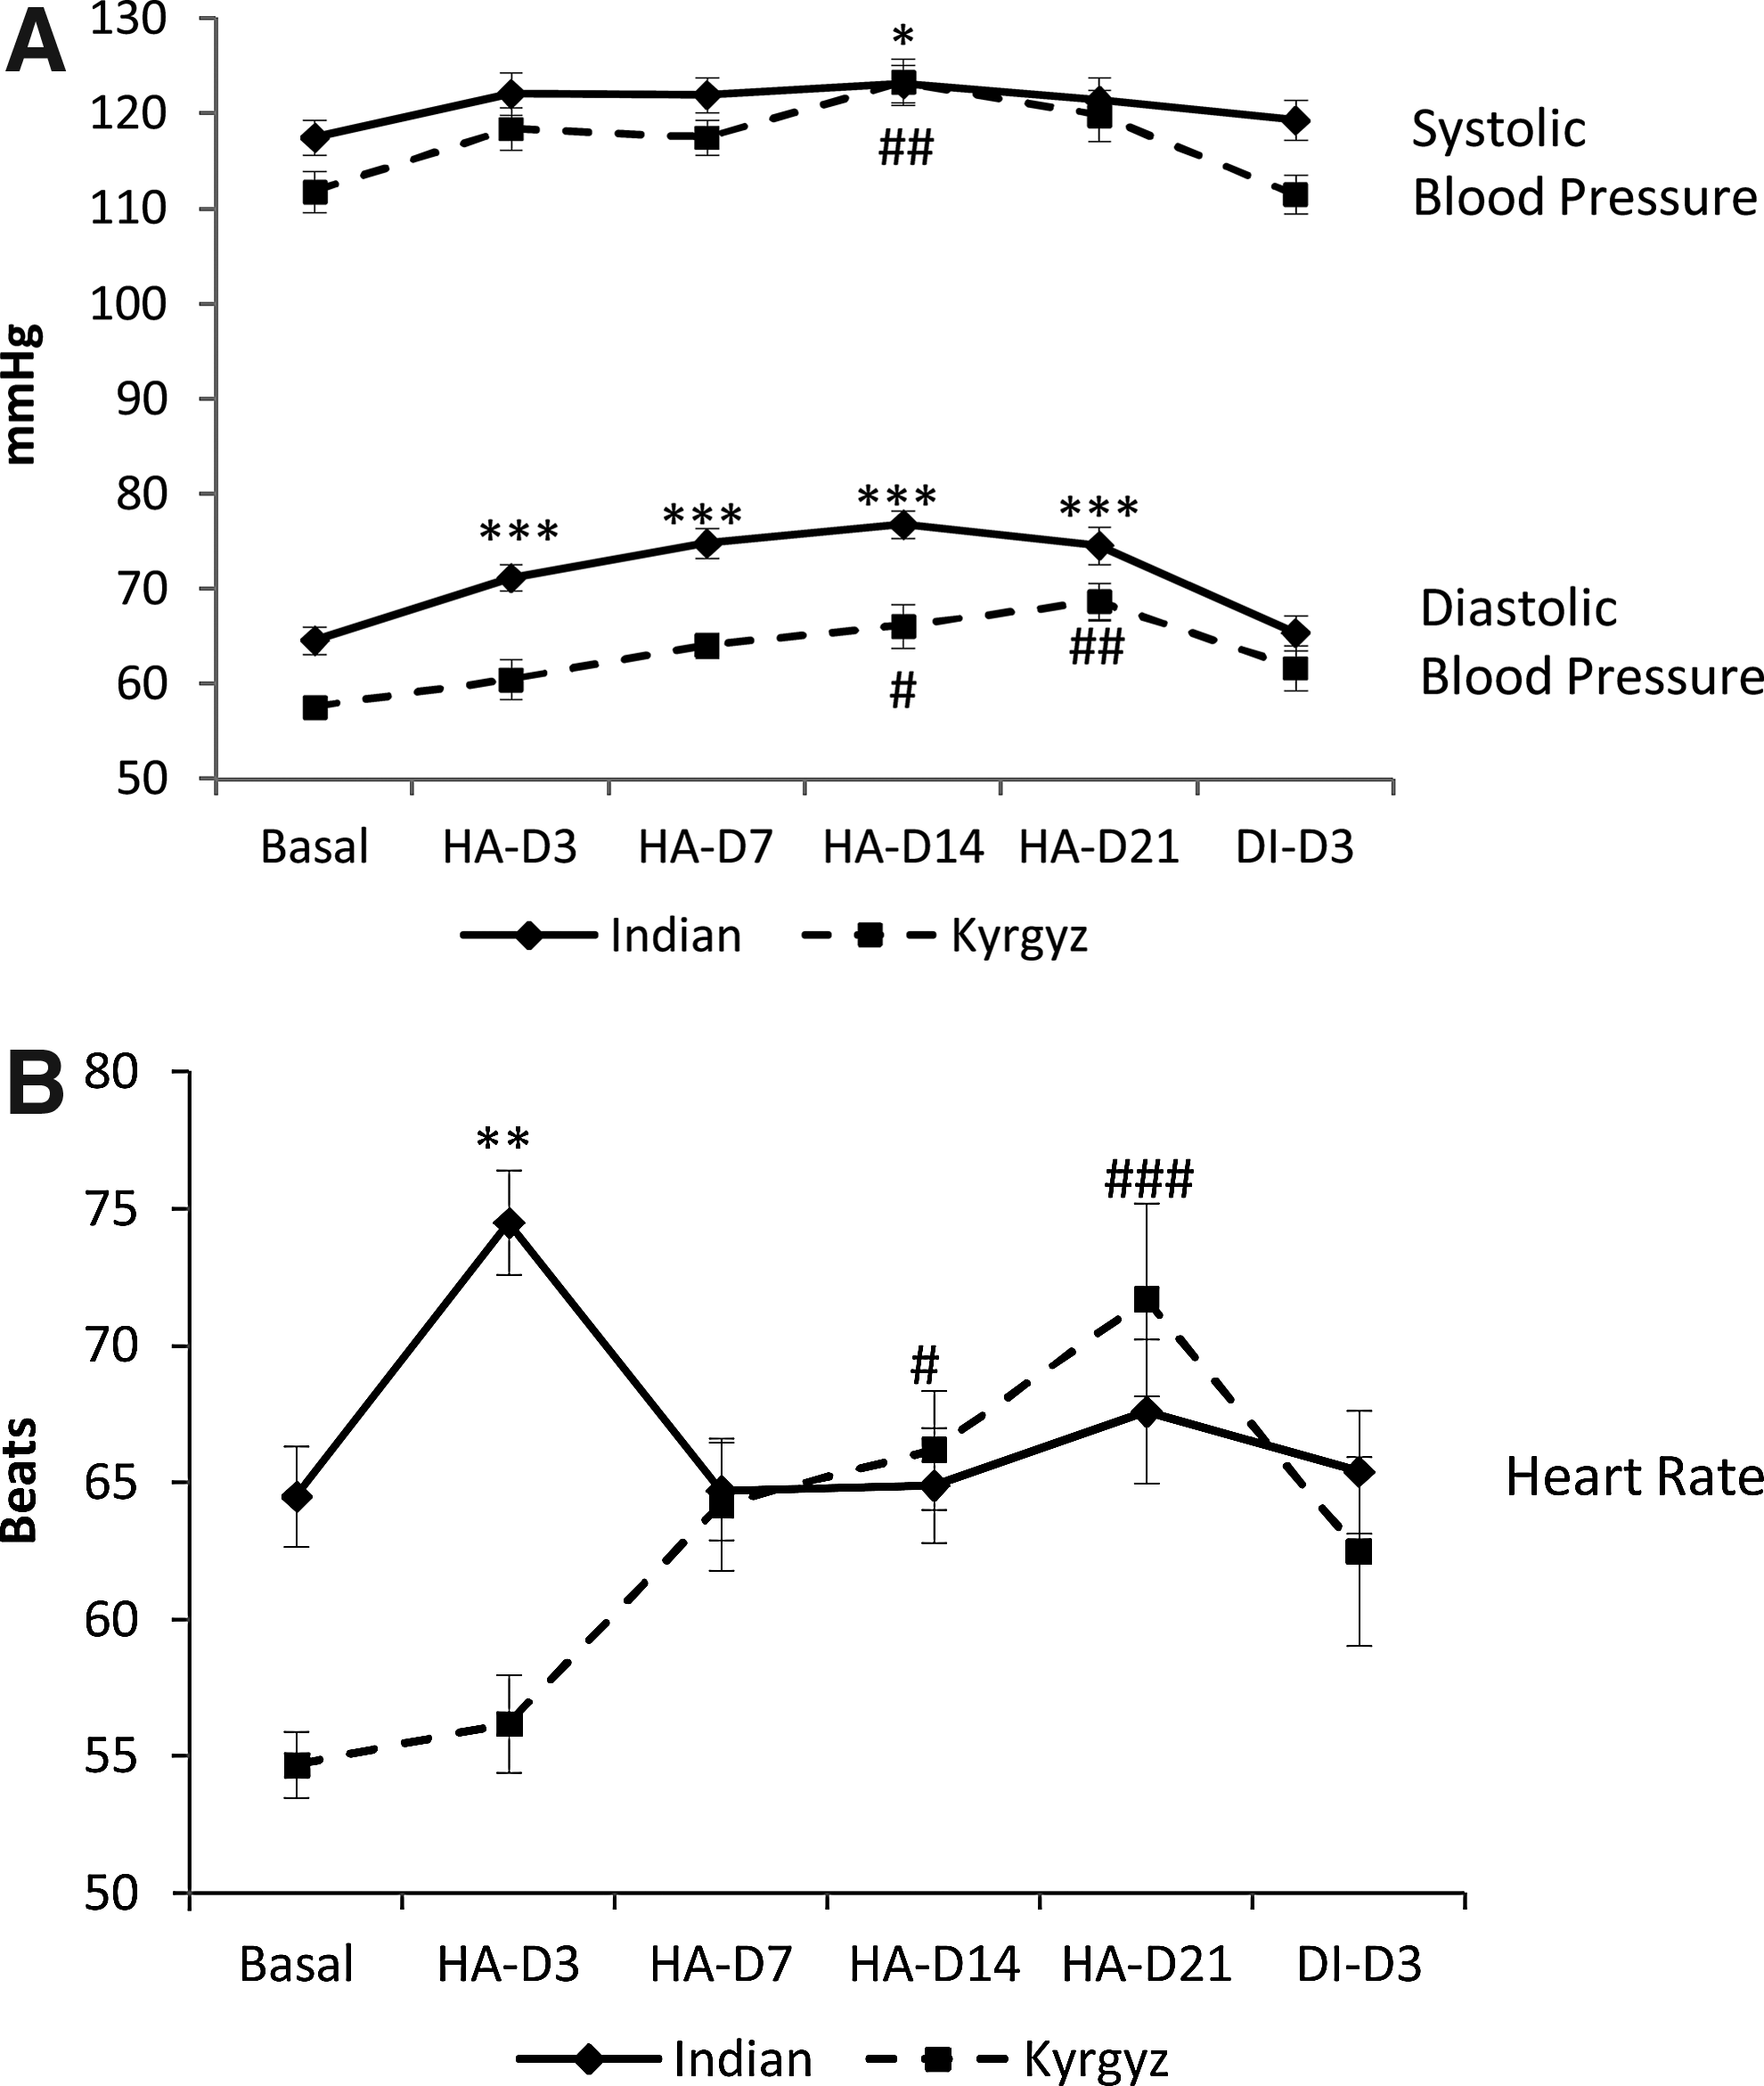
Changes in blood pressure and heart rate of Indian and Kyrgyz volunteers in different phases. Values are mean±SEM. HA=high altitude, D3=Day 3, D7=Day 7, D14=Day 14, D21=Day 21, DI=De-induction. *=in comparison to basal for Indian, *=p<0.05, **=p<0.01, ***=p<0.001. #=in comparison to basal for Kyrgyz, #=p<0.05, ##=p<0.01, ###=p<0.001.
Discussion
At HA, hypoxia and cold are the major factors that affect human physiology. Studies related to energy requirements at HA suggest that weight loss observed in most studies is due to loss of appetite or high altitude induced anorexia (Boyer and Blume, 1984; Butterfields, 1996, 1999; Vats et al., 2007). However, in initial days decrease in body weight is mainly due to the loss of body water. At HA the body loses water in both sensible and insensible ways. Sensible water losses include urination, defacation, and perspiration, whereas insensible water lose is lose due to vaporization through lungs and skin. Low relative humidity and high respiratory rate at HA results in a high rate of insensible water loss (Milledge, 1992). Westerterp and colleagues (1992) estimated a water loss of about 600 mL/d at HA. In the present study, body weight loss observed in both the groups was mainly due to loss of body water. In Indian volunteers body water changes were significant on day 14 and hence body weight loss, whereas, in Kyrgyz volunteers significant body water and body weight loss were observed on day 3 of HA exposure. HA-induced dieresis generally occurs during initial days of acclimatization when the symptoms of acute mountain sickness (AMS), high altitude pulmonary edema (HAPE) or high altitude cerebral edema (HACE) are not visible. It was reported that 3.5% of total body water decrease in the first 3 days of HA (3500 m) exposure (Anand and Chandrashekhar, 1996). In the present study water loss was 1.5% and 2.27% on day 3 in Indian and Kyrgyz volunteers, respectively, whereas, maximum water loss was 1.8% on day 14 in Indians and 4.45% on day 21 in Kyrgyz. The decrease in body weight is in proportion to decrease in body water (Jain et al., 1980, Singh et al., 1990) as observed in the present study. Hypophagia and body weight loss have been observed quite frequently at HA (Boyer and Blume, 1984; Singh et al., 1997). In the present study adequate care was taken to run the kitchen for subjects with special attention to the choice of food. Subjects themselves were part of the team in choosing the menu and working in the kitchen. They were given the opportunity to help decide on the choice of items as well as quantity of a particular item in the meal. An easy access to food in between meals might have also helped as well. Butterfield et al. (1992) showed that the weight loss in HA can be drastically diminished by increasing the quantity of food. In the present study, with the food given ad libitum and with more accessibility of the kitchen to the subjects, overall food intake might have been adequate to balance a possible increase in overall metabolism and change in taste hedonics.
Significant change in body density in Indians on Day 3 of HA induction and on de-induction may be due to changes observed in body fat and TBW. Body fat % increased on HA day 3 and decreased significantly after de-induction. In the present study subjects have free access to kitchen and food preparation of their choice. Indian subjects were new to HA and had limited mobility in the initial days. Less energy expenditure and proper food intake may be responsible for increase in body fat on day 3 of HA exposure. Macdonald et al. (2009) reported decrease in body mass on HA exposure, which is made up of 45% fat, 35% TBW and 25 % residual mass (principally protein and glycogen). The body weight loss in the present study was mainly of body water. In this study no significant change in muscle mass, body protein mass, total mineral, body glycogen contents, and BMI indicates proper caloric intake and nutritional status of subjects. This confirms the claim of some previous studies that stated body mass loss can be prevented by dietary intervention (Potera, 1986; Butterfield et al., 1992; Kayser et al., 1993; Edwards et al., 1994). In Kyrgyz subjects no significant change in body density and fat was observed during HA exposure. Maintenance of body composition during HA exposure in both the groups may be due to low fat and low residual mass (Macdonald et al. 2009), which may reduce their metabolic rate or activity level. The reduction in metabolic rate and activity levels may result in reduction in energy expenditure. The reduction in energy expenditure might compensate for a lesser energy intake due to high altitude anorexia and results maintenance of body composition.
Vascular tone of the pulmonary and systemic resistance vessels is affected by hypoxia and results in increase in ventilation and sympathetic activity. This occurs due to the effect of hypoxia on blood vessels and the chemoreceptor-mediated responses in systemic and pulmonary circulation (Bartsch and Gibbs, 2007). This increase in ventilation does not fully compensate for decrease in inspired partial pressure of oxygen and precipitate as decrease in hemoglobin saturation with oxygen. Stimulation of the sympathetic nervous system in response to HA exposure is a part of the integrated physiological response to hypoxic stimulus (Heistad and Abboud, 1980; Smith and Muenter, 2000). This increase may be responsible for many cardiovascular and metabolic changes such as increase in HR, lactate accumulation during exercise, and increase in metabolic rate. In the present study a marked difference was observed in HR response during hypoxic exposure. In Indian subjects HR increased immediately after exposure and thereafter come down to normal basal values. In Kyrgyz subjects HR increased slowly up to day 21 and on de-induction the values were higher than the basal. Increase in blood pressure and HR during HA exposure is reported by many researchers (Lanfranchi et al., 2005; Brito et al., 2007). The pattern of DBP and HR changes on HA exposure is also different in the two groups. Naeije (2010) reported that HR increased on HA exposure and remained elevated on subsequent days of exposure even though cardiac output returns to baseline levels. In the present study Kyrgyz subjects showed the same pattern whereas in Indian subjects HR increased on day 3 of exposure and came to baseline levels on subsequent days. The difference observed in blood pressure and HR may be a genetic adaptation of the two groups from two different geographic regions.
Results showed that there were some fluctuations in plasma lipids during HA exposure. In the present study significant increase in HDL cholesterol was observed in both the groups. The results are in agreement with other studies reporting an increase in HDL cholesterol on HA exposure (Ferezou et al., 1988; Wood and Haskell, 1979). Significant increase in HDL protein marker, apo A1, as indicator of elevated HDL fraction was reported during HA mountaineering (Nestel et al., 1979). Since subjects were quite active at HA, the increase in HDL cholesterol on HA exposure may be the effect of exercise/activity level (Wood and Haskell, 1979). The change in total cholesterol is in concomitance with LDL cholesterol levels. Though not significant, the total cholesterol levels decreased with a decrease in LDL cholesterol. It is not clear that the change in LDL is in response to HA exposure or the effect of dietary pattern. It was reported that during HA exposure there is change in dietary pattern/habits that leads to a progressive lack of appetite for fat and increases liking for carbohydrates (Boyer and Blume, 1984; Singh et al., 1997). Along with other factors, lipid profiles are associated with risk of cardiovascular disease. The decrease in total cholesterol and LDL cholesterol and increase in HDL cholesterol as observed in both the groups may be the effect of HA exposure. In other words subjects were protected against cardiovascular diseases in relation to lipid profile as a factor. This trend was also observed in hilly area residents and seems to have a protective effect from coronary mortality (de Leon et al, 2004).
Results of the present study demonstrate that HA exposure alters cardiovascular functions, lipid profiles, and body composition of sojourns. The response against HA stress and magnitude of response depends upon lifestyle, living conditions, social environments, eating and drinking habits, and physical activities and state of individuals. The study groups showed different pattern of changes in body weight, body water, heart rate, and blood pressure. Analysis of mitochondrial DNA and Y-Chromosome short-tandem-repeat polymorphisms reveals a marked genetic diversity in Indian and Kyrgyz population (Kivisild et al., 1999; Chaix et al., 2004; Quintana-Murci et al., 2004; Heyer et al., 2009). Thus, the difference observed in cardiovascular functions, lipid profiles and body composition during acclimatization in Indian and Kyrgyz may be due to ethnic/genetic variation of two populations.
Footnotes
Acknowledgment
The authors would like to thank the volunteers for active participation in the study.
Disclosure Statement
The authors have no competing interests or financial ties to disclose.