
Abstract
Abstract
Lou, Bih-Show, Pei-Shan Wu, Yitong Liu, and Jong-Shyan Wang. Effects of acute systematic hypoxia on human urinary metabolites using LC-MS-based metabolomics. High Alt Med Biol. 15:192–202, 2014.—
Introduction
M
Recently, the applications of LC-MS as an analytical tool have increased the discovery of potential biomarkers (Kristensen et al., 2012; Xiao et al., 2012a). The advantages of mass spectrometry (MS) or tandem mass spectrometry (MS/MS) include the high sensitivity, high-throughput capacity, and the possibility to confirm the identity of the components present in complex biological samples; furthermore, the combination of separation techniques (e.g., chromatography) and MS tremendously expands its capability to analyze highly complex biological samples (Bajad et al., 2007; Zhou et al., 2012; Xiao et al., 2012b). In metabolic profiling, an untargeted LC-MS approach is used. Metabolites are detected in the broad mass scanning mode (e.g., 50–1200 mass units) and their levels are then quantified by measuring direct mass ion intensities.
Humans have complex physiological systems and are well equipped to cope with reduced oxygenation (hypoxia) ( Jeong et al., 2009). Hypoxic states of human tissue are also frequently related to dangerous diseases of modern times as these diseases often result from insufficient oxygen supply to cells to support their metabolic demands (Mazzeo, 2005). Acute alititude illness occurs in nonacclimatized subjects shortly after ascent to alititudes higher than 2500 m and as early as 1 hour after exposure to hypoxia (Hackett et al., 2001). Other nonaltitude-related diseases such as ischemia-reperfusion, stroke, and myocardial infarction may also have etiologies related to acute hypoxia (Corbucci et al., 2005; Feala et al., 2008). Chronic hypoxic conditions resulting from living at high altitude lead to acclimatization processes such as increased pulmonary ventilation, enhanced oxygen transportation efficiency in the circulatory system, and subsequent improvement of physical fitness to minimize tissue damage (Wang, 2006). Chronic hypoxia also characterizes disease processes of cancer. Physiological responses triggered by hypoxia impact all critical aspects of cancer progression, including immortalization, metastasis, angiogenesis, metabolic adaptation, and resistance to therapy (Chiu et al., 2004; Jeong et al., 2009). Understanding cellular adaptation to hypoxia, therefore, is an important aspect of treatment design for these diseases.
The beneficial or detrimental effects of acute systematic hypoxia may depend substantially on the concentration of O2 exposure. The study of how systematic hypoxia affects the metabolic profiles may provide a basis for early detection of disease based on metabolic changes, as well as a baseline set of metabolites to look for in assessing chronic hypoxia. For this, we used an exposure time of 2 h to model an episode of acute hypoxia in our subjects; furthermore, we specifically chose 12% and 15% O2 to simulate altitudes of about 4500 m and 3000 m, respectively.
Recently, NMR-based metabolomics have enabled the study of hypoxia's effects on metabolic profiles. Metabolic profiles of animal models were used to reveal changes in energy metabolism with the use of an anti-anxiety herb formula (Liu et al., 2013) and were also used to establish a model to assess neonatal hypoxic injury (Skappak et al., 2013). Comparisons of metabolic profiles of human biofluids from diseased and control patients showed that metabolic profiles can be used in the discovery of biomarkers of disease (Luo et al., 2012) and metabolic profiles of healthy human subjects subjected to 8 h of 12% oxygenation were observed to find the changes relative to HIF-1 and oxidative pressure (Tissot van Patot et al., 2009). This article employs urinary LC-MS-based metabolomic analysis to study the systemic changes as a result of acute hypoxia. As metabolic changes associated with cellular adaptation to hypoxia are linked with various severe diseases of our time, understanding such changes may help uncover new biomarkers for these diseases.
Materials and Methods
Subjects
This study was reviewed and approved by the Ethics Committee of Chang Gung Memorial Hospital through the contract no.IRB99-3223C. Written informed consent was obtained from participants before this work. Hypoxia intervention experiments were performed in an air-conditioned normobaric hypoxia chamber (Colorado Mountain Room) (Wang et al., 2009). Healthy individuals who do not smoke or use medication/vitamins, are without disability to exercise, and free of infections and cardiopulmonary risk (with blood-pressure<140/90 mmHg, total cholesterol<200 mg/dL, triglyceride<150 mg/dL, and Glu-AC<126 mg/dL) were recruited from Chang Gung University. The basic information of the 6 subjects in this study is as follows: the average age is 21.9±0.5 year old, height is 172±1 cm, and weight is 65.8±1.8 Kg. The average level of cardiovascular parameters is 66.7±2.3 bpm, 119.9±2.4 mmHg, 68.1±1.7 mmHg for HR, SBP, and DBP, respectively. All participants were instructed to fast for 8 h and refrain from exercise at least 24 h prior to the study. In addition, they recorded their daily activity using a physical activity questionnaire. All subjects arrived at the testing center at 9:00
LCMS materials
All solvents used were LC-MS grade. Water was purchased from Fluka Analytical, Sigma-Aldrich (St. Louis, MO, USA) and acetonitrile was from J.T. Baker (Phillipsburg, NJ, USA). A 1 M ammonium formate stock solution was prepared in water using LC-MS grade ammonium formate (Fluka).
Sample preparation
All of the fresh urine samples were immediately stored at −80°C until analysis (within 4 weeks). Storage additives were not used due to the potential of interfering with downstream analysis (Bernini et al., 2011). The urine samples were thawed on ice for 30 min, then mixed on a vortex shaker and spun by centrifugation in Eppendorf tubes at 12,000 rpm for 30 min at 4°C to precipitate solids. The creatinine concentration of each urine sample was adjusted with water (Fluka) to 200 and 400 μg/mL for ESI(+) and ESI(−), respectively. These concentrations were previously determined in our laboratory to be optimal for each experiment due to masking by compounds found at higher concentrations, which are usually not metabolites of interest; therefore, the concentrations were chosen so the molecules present at smaller concentrations could be appreciated. The diluted urine samples were filtered with 0.20 μm syringe filters (mdi membrane technologies, Ambala Cantt, India) before LC-MS analysis, then stored at −20°C for further identification by LC-MS/MS analysis (Want et al., 2010). All urine sample concentrations were normalized using creatinine within the sample, which was quantified with the Creatinine Assay Kit (Cayman Chemical, Ann Arbor, MI). Creatinine was used as a reference point within the sample. Agilent 6510 LC-QTOF /MS (Agilent Technologies, Santa Clara, CA) was used to confirm and analyze the normalized urine samples, and then the Agilent MassHunter Qualitative software was used to quantify creatinine. From the analysis, the creatinine peak was extracted at m/z 114.07, and had a retention time (RT) of 1.98 min. The abundance is about 1.4×10⁶ and had a peak area of about 3.5×10⁷ for all urine samples.
LC-MS and MS/MS analysis
The on-line LC was carried out by Agilent 1200 RRLC system. The chromatography separation was achieved by a Gemini C18 column (2.0×100 mm, 3 μm particle size; phenomenex, Torrance, CA, USA) with an identical guard column (2.0×4 mm, 3 μm particle size). The diluted urine sample injection volume was 1 μL for positive mode and 10 μL for negative mode to compensate for the decreased sensitivity of negative mode. The sample was delivered at a flow rate of 0.2 mL/min and the column temperature was consistent at 40°C. The mobile phases consisted of 2 mM ammonia formate/H2O (mobile phase A) and acetonitrile (mobile phase B) and were filtered by a 0.22 μm membrane filter (Durapore Membrane, PVDF, Hydrophilic, 0.22 μm, 47 mm; Millipore, Billerica, MA, USA). The LC separation was performed with the following solvent gradient program: after a 1 min isocratic run at 1% B, a short gradient to 2% B for 2 min, a long gradient to 98% B for 10 min, and an isocratic run at 98% B for 5 min, then a linear decrease from 98% to 1% B within 3 min, and finally equilibrated with 1% B for 5 min. The total run time is 26 min. Three replicate injections were performed on each sample in both ESI(+) and ESI(−) modes.
TOF/MS scanning collected profiles form m/z 50 to 1000 in both positive-ion and negative-ion modes at a scan rate of 1.4 cycles per second. Samples were ionized by duel electro-spray ionization (ESI) and we found the optimum TOF/MS conditions to be as follows: capillary voltage of 4,000 V, nebulizer pressure of 30 psig, drying gas of 10 L per minute, gas temperature of 325°C, fragmentor voltage of 175 V, and skimmer voltage of 65 V.
For the tandem mass experiment, the precursor ion mass range was m/z 100 to 500 at a scan rate of 2.2 cycles per second, and product ions were recorded for m/z 50 to 500 at a scan rate of 1.4 cycles per second. The targeted ion m/z, RT, and collision energy for positive ion mode are as follows: m/z 282.12, 7.59 min, 20 eV; m/z 298.0, 8.04 min, 15 eV; m/z 166.07, 6.08 min, 25 eV; m/z 112.05, 5.66 min, 25 eV; m/z 137.05, 5.15 min, 25 eV; m/z 169.04, 2.00 min, 25 eV; m/z 156.16, 1.54 min, 20 eV; m/z 170.09, 2.10 min, 12 eV; m/z 170.09, 1.66 min, 20 eV; m/z 130.05, 1.40 min, 15 eV; m/z 132.10, 1.53 min, 20 eV; m/z 126.02, 1.43 min, 30 eV; m/z 176.07, 8.50 min, 20 eV; m/z 103.09, 1.47 min, 15 eV; m/z 118.08, 1.46 min, 20 eV; m/z 162.11, 1.41 min, 20 eV; m/z 218.14, 2.84 min, 15 eV; m/z 232.15, 8.07 min, 15 eV; m/z 316.25, 10.11 min, 20 eV; m/z 153.06, 5.81 min, 30 eV; and m/z 134.06, 9.61 min, 25 eV. For negative ion, they are: m/z 151.03, 3.82 min, 20 eV; m/z 112.05, 5.80 min, 20 eV; m/z 145.06, 1.42 min, 20 eV; m/z 146.12, 1.36 min, 20 eV; and m/z 117.02, 1.45 min, 20 eV. The delta RT was 2 min for each ion.
Data analysis and processing
The number of possible chemical formulas for the metabolite in question is decreased due to the high accuracy of the Agilent 6510 Q-TOF. MassHunter, a software provided by Agilent, suggests possible chemical formulas based on the m/z value of the metabolite, and then METALIN (Sana et al., 2008), a web-based database provided by UC San Diego, gives a list of possible chemical structure for the metabolite based on the suggested chemical formulas. Identification is then done by comparing the standard along with the sample using MS and MS/MS. In the initial step, automated peak detection and mass spectral deconvolution was performed by the Qualitative Analysis Software of MassHunter. For each sample, all spectra were exported with absolute intensities (peak height>5000 for positive mode;>500 for negative mode), maximum charge state≤1, and isotopes containing two or more ions. Around 1,000–2,000 features were found in each sample for both ESI(+) and ESI(−) modes. The GeneSpring MS software (Agilent Technologies, Santa Clara, CA) was used for further normalization, alignment, and statistics were used to filter out meaningless masses. The filters used were part of a protocol published by Sana et al. (2013), and filters with 75% relative frequency, 100% coefficient variation, >2-fold change calculation, and analysis of variance (ANOVA, p<0.05), a Benajamini and Hochberg False Discovery Rate of 5%, etc, and decreased the features of interest to the range between one and two hundred. Partial Least Squares Discriminant Analysis (PLS-DA) was then used to cluster and classify the metabolites in all samples (Perez-Enciso et al., 2003). Database searching by METLIN or HMDB, with a tolerance of 0.01 Da provided the initial identification and validation for the metabolites we found in the experiment (Wishart, 2007; Sana et al., 2008). Their relative pathway was then determined though the KEGG database (Shulaev, 2006).
Compounds that change significantly with respect to normalized creatinine before and after hypoxia were chosen to be further identified by MS/MS. These compounds represent metabolites of interest because they change under our experimental circumstances. Of the compounds of interest, those that could be identified were then quantified. Normalization was achieved by finding the absolute peak areas of these compounds with specific extraction m/z and RT. This is presented with relative intensity (three repeats/subject, absolute peak area/25,000) shown as a bar graph for each person, and used to quantify each person's urine sample.
Results
A typical base peak chromatogram (BPC) of human urine from LC-MS analysis is represented in Figure 1A. N in these results is an aggregation of the results from samples collected before each of the hypoxia experiments (both MH and SH). There is no obvious difference between subjects exposed to N and SH in both ESI positive and negative modes. MH is not shown in this figure. However, the validated separations between N, MH, and SH groups by PLS-DA are generated and shown in Figure. 1B. The PLS-DA shows an overall trend of shifting, which indicates change in metabolite production. PLS-DA reveals more prominent trend of change that BPC could not. The points for SH (red triangle) are more separated from those for N (black circle) than those for MH (green square), which shows the dose-dependent nature of urinary metabolites from hypoxia, that is, the difference in metabolic profiles before N and after exposure to 2 hours of SH is more prominent than exposure to MH, which reinforces the impact of dose in this study.

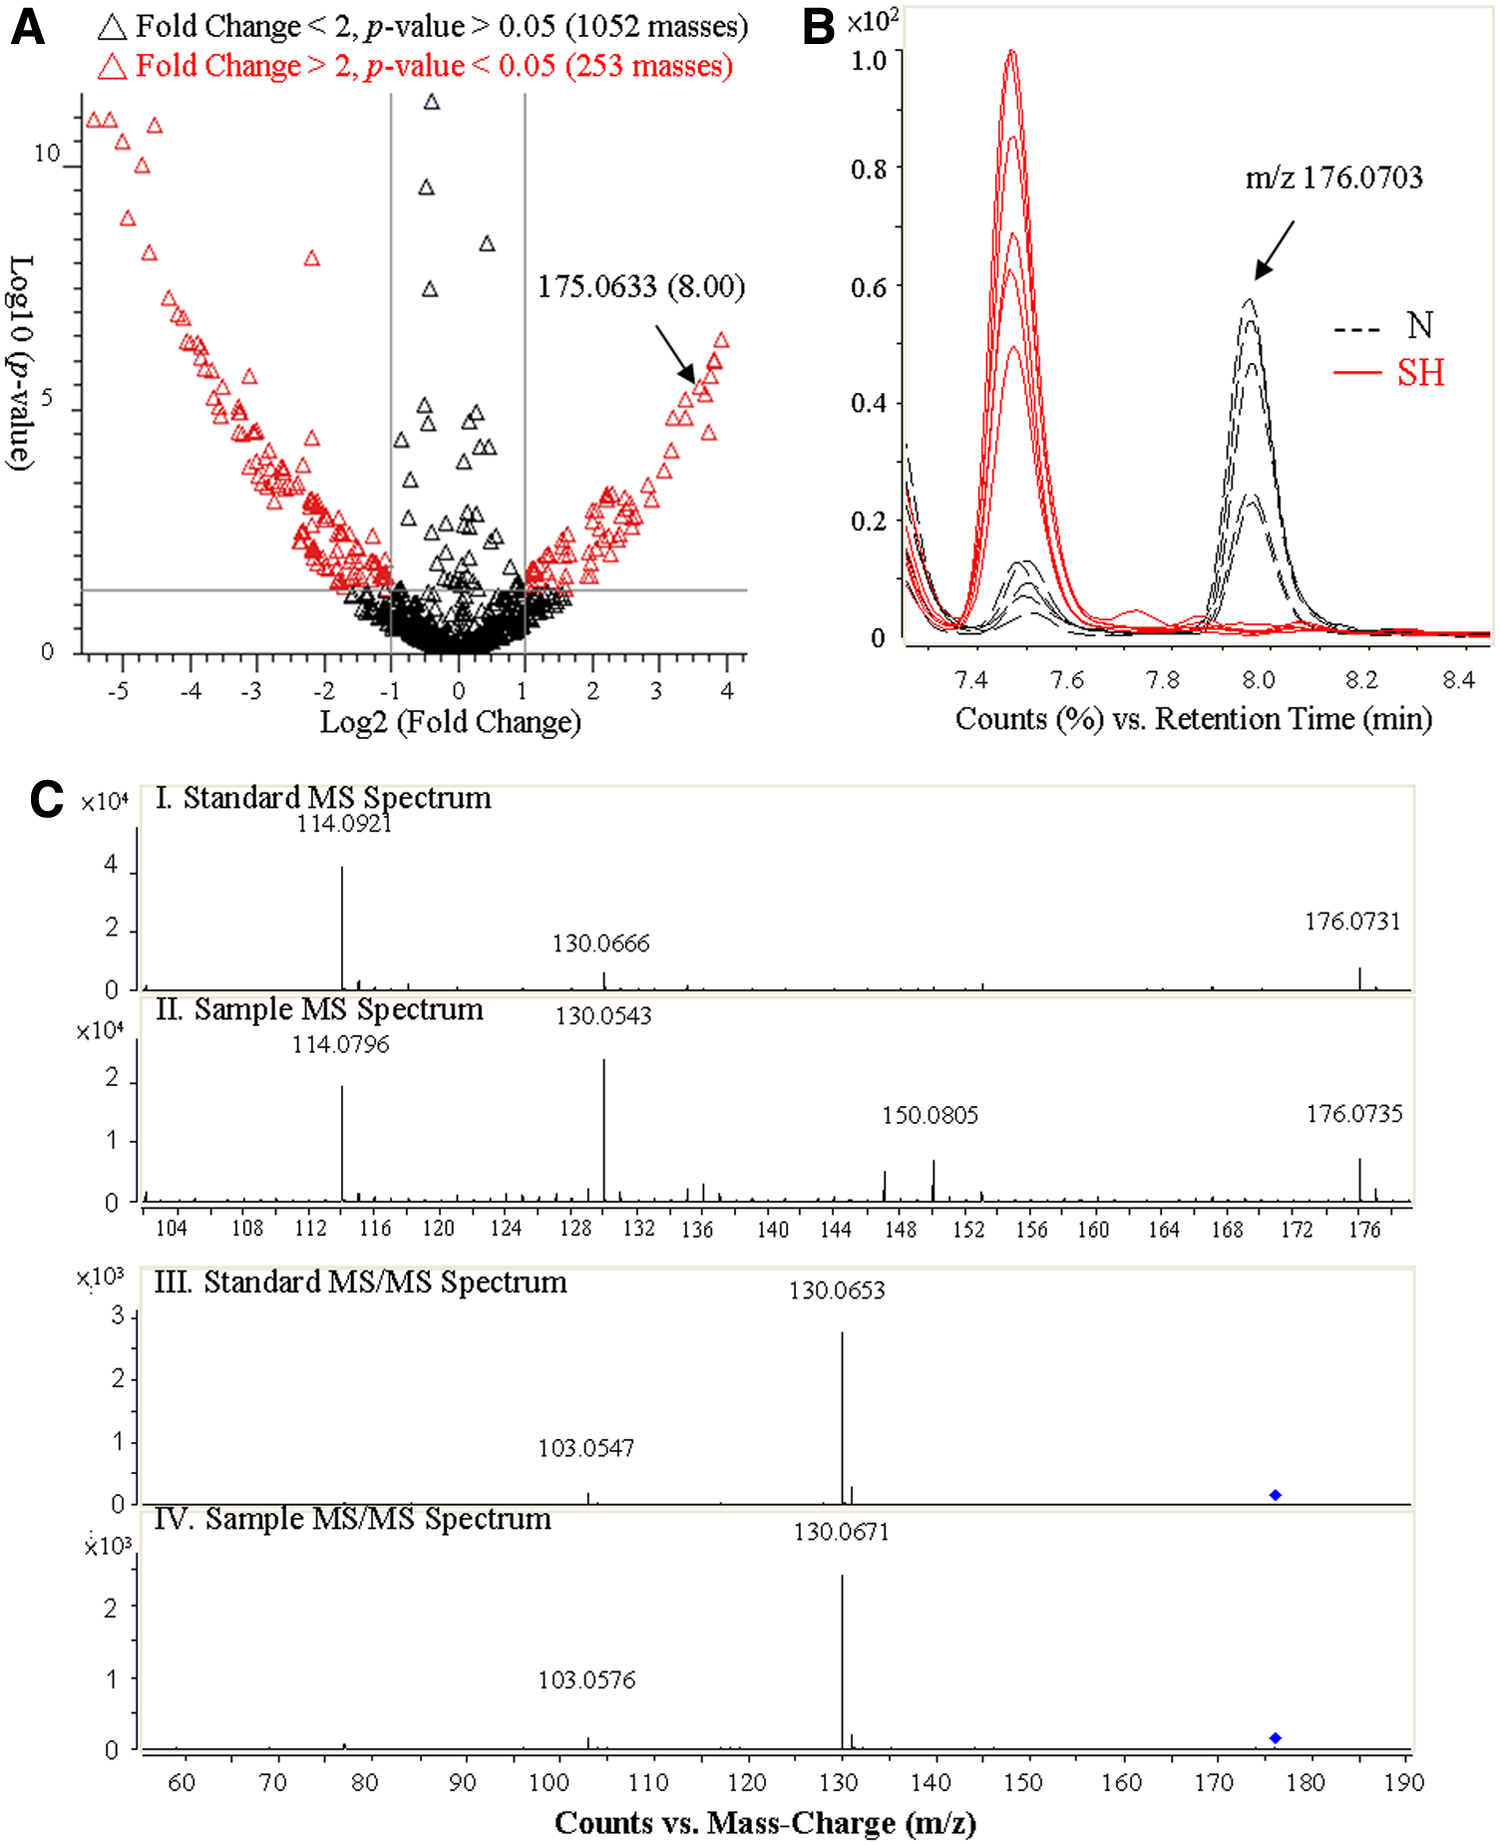
The identification process of potential biomarkers is shown in Figure 2. Metabolites with significant changes induced by hypoxia can be easily isolated with the help of the volcano plot of all masses, shown in Figure 2A. These plots compare p-value and fold change; therefore, points on the two extremes of the plot represent those that have the greatest potential as biomarkers, as these metabolites have the greatest degrees of difference as a result of hypoxia. The metabolites on the left hand side of the volcano plot are downregulated and those on the right hand side are upregulated. The degree of difference can be further confirmed and visualized by selecting the data point in the plot. For example, 3-indoleacetic acid (C10H9NO2) has m/z value and RT of 175.0633 and 8.00 min, respectively, and its extracted ion chromatogram (EIC) is represented in Figure 2B. Identification of the compound is then done by comparing the standard along with the sample using MS and MS/MS (Fig. 2C); however, if the standard is not commercially available, the Human Metabolites Database (HMDB, Canada) provides MS and MS/MS data to confirm the identity of the metabolite.
Comparison and identification of significant metabolites between N and SH in urine samples from all six subjects by LC-TOF/MS.
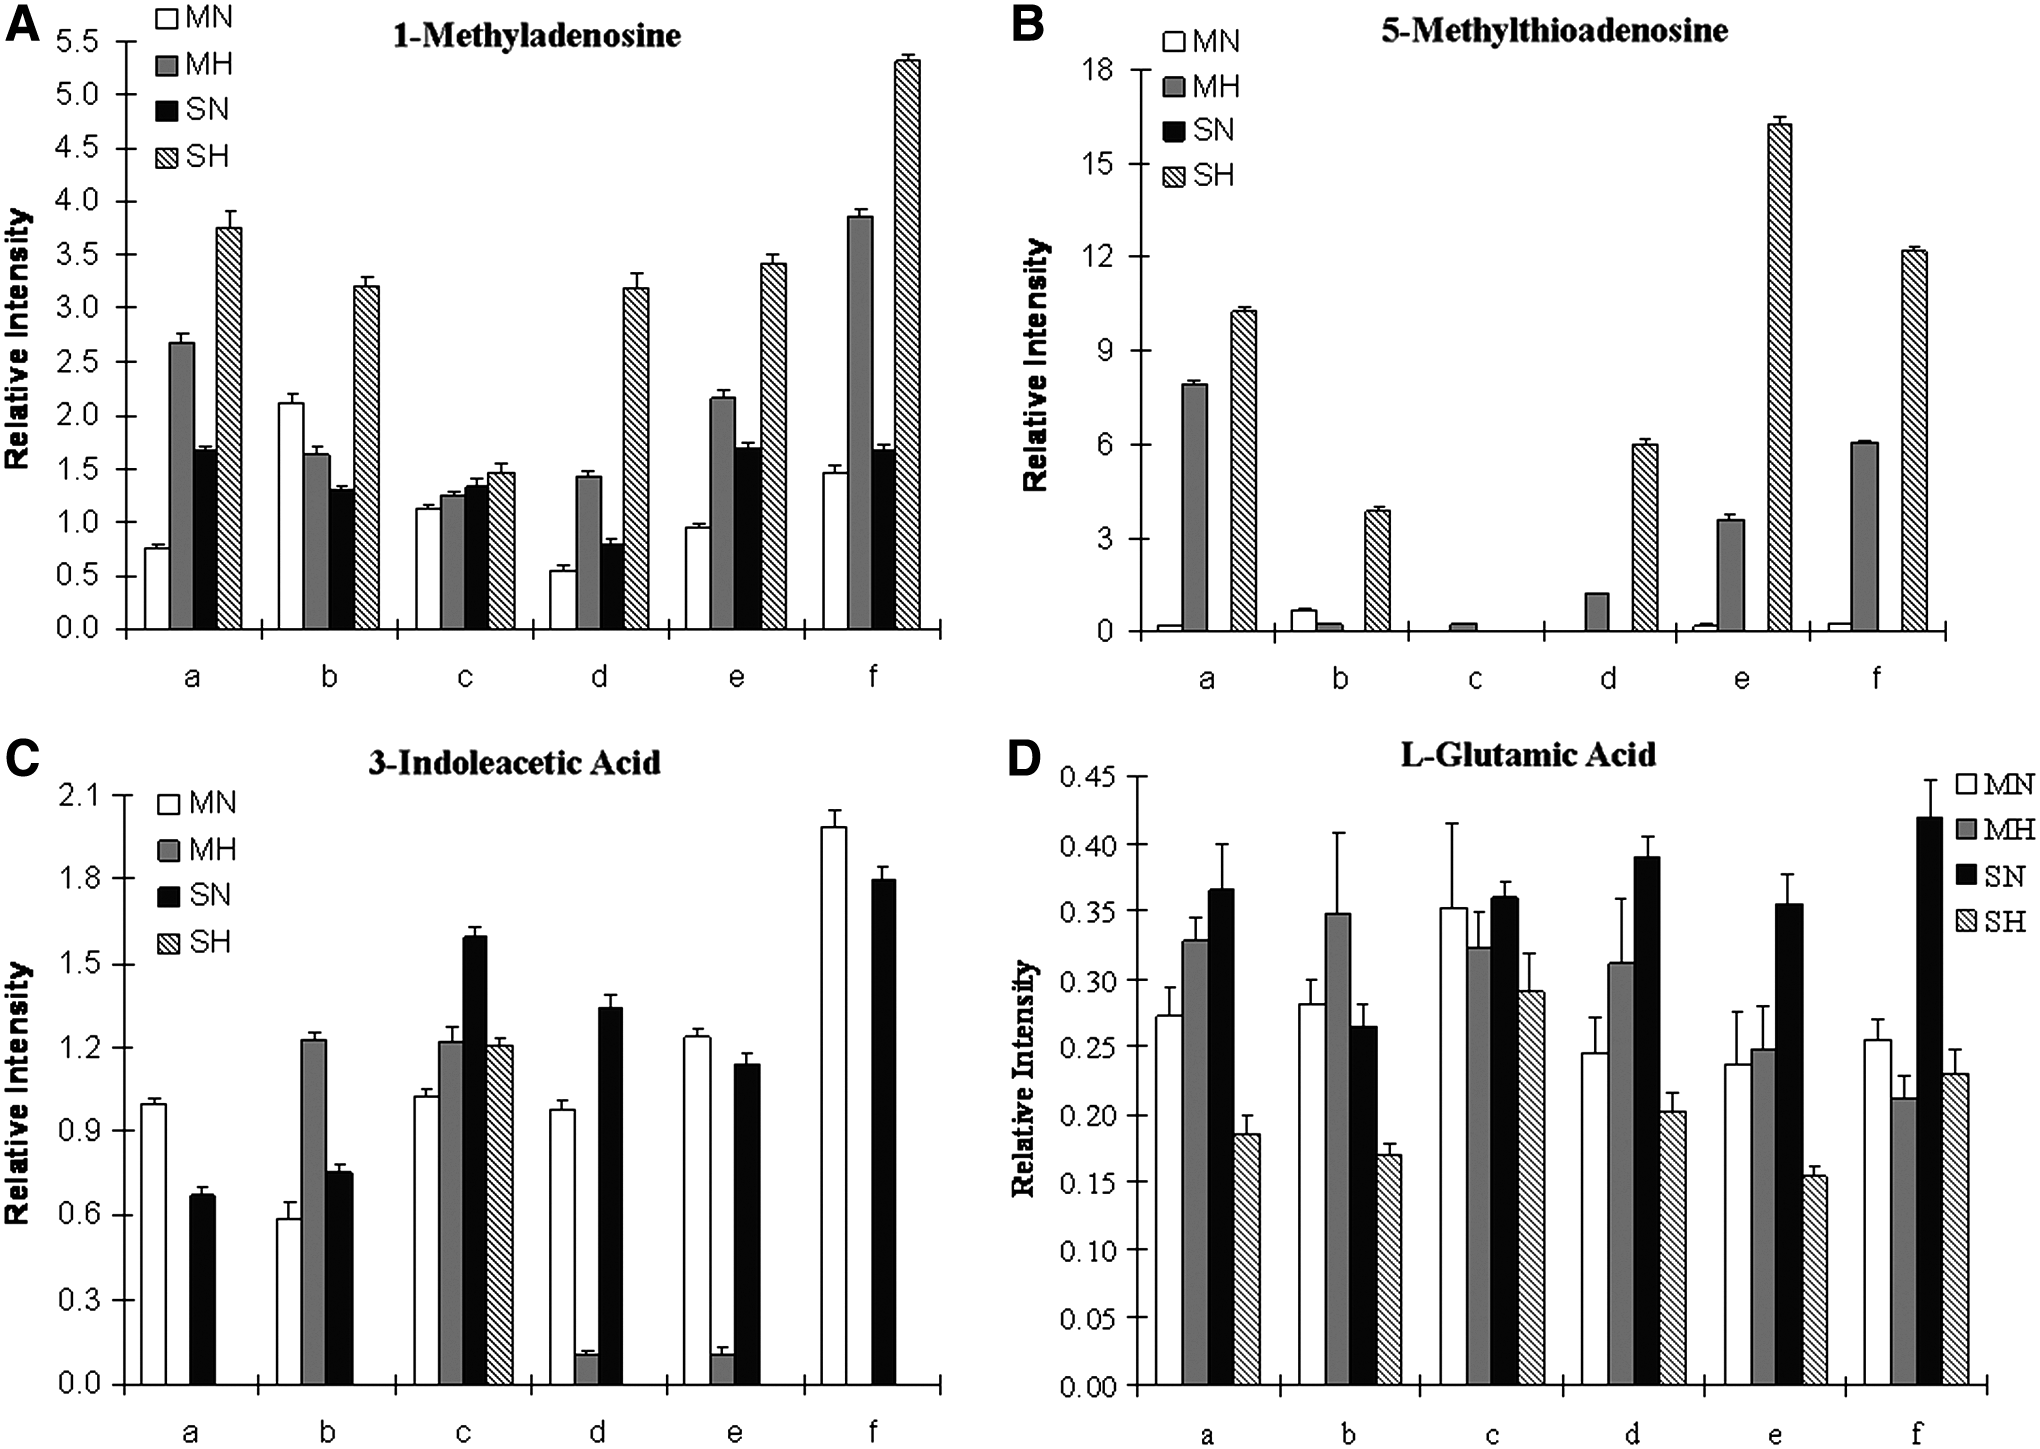
Figure 3 shows bar graphs of the average value of the integrated peak areas from the three replicates in the EIC for each individual tested, these four compounds were chosen because their changes before and after hypoxic treatment were the most prominent and consistent. Experiments for SH and MH were performed on different day, and therefore, there are two different N levels (MN and SN) of the compound for each individual. Figure 3A depicts the appearance of the metabolite 1-methyladenosine; in most of the six subjects tested except for subject b, 1-methyladenosine was observed after the subject went through MH but SH prompted the increased production of the metabolite in all the subjects. Figure 3B reveals that after MH, 5-methylthioadenosine increased from being virtually undetectable in all but subject b. Both 1-methyladenosine and 5-methylthioadenosine have observable trends of upregulation from hypoxia treatment; this trend is more pronounced after SH and was consistently observed among all subjects. In Figure 3C, 3-indoleacetic acid disappears or decreases after MH; this trend is also more obvious after the subject undergoes SH. L-glutamic acid, shown in Figure 3D, has a rather uneven trend after MH; however, after SH, it is clear that L-glutamic acid decreases in response to hypoxia. Subject c showed a different reaction to MH and SH compared to the other individuals in Figures 3A—3C.
Comparison of the average relative intensity between N and H among six individual subjects for 1-methyladenosine
Over 1000 features were found in this study, about 10% showed significant change from hypoxia treatment and 26 compounds were identified for further analysis. The fold changes from the three repeats of each of the six subjects were calculated and shown in Figure 4. The fold changes were calculated with N and H average relative intensity ratios (N/H for downregulated compounds and H/N for upregulated compounds in Table 1). The compounds are organized into four groups depending on their functional group and metabolic pathway (nucleic, acetic acid, carnitine, and organic). Compounds such as cytosine and taurine, with fold change around 1 or −1 can be thought as being unaffected by hypoxia, which may suggest that these metabolites have rather steady metabolic pathways. Two metabolites, 1-methyladenosine and 3-indoleacetic acid, have distinctly greater change (we used 100 as the maximum fold change) and are represented in the two inserts within the graph. There are several other metabolites that have significantly observable changes in response to hypoxia, especially under severe hypoxia. These compounds are xanthine and uric acid. Most compounds also exhibit dose dependence, especially L-carnitine, propanoylcarnitine, and all of the amino acid metabolites. Xanthine, hypoxanthine, and uric acid are all purine metabolites, and they all show the same increasing trend; xanthine and uric acid especially reflect this trend in response to severe hypoxia. The amino acids have various trends depending on the particular metabolite; however, all show dose dependence because the degree of up or down regulation is magnified after severe hypoxia. L-carnitine and propanoylcarnitine are both lipid metabolites, a change in these metabolites indicates an abnormality in energy metabolism.
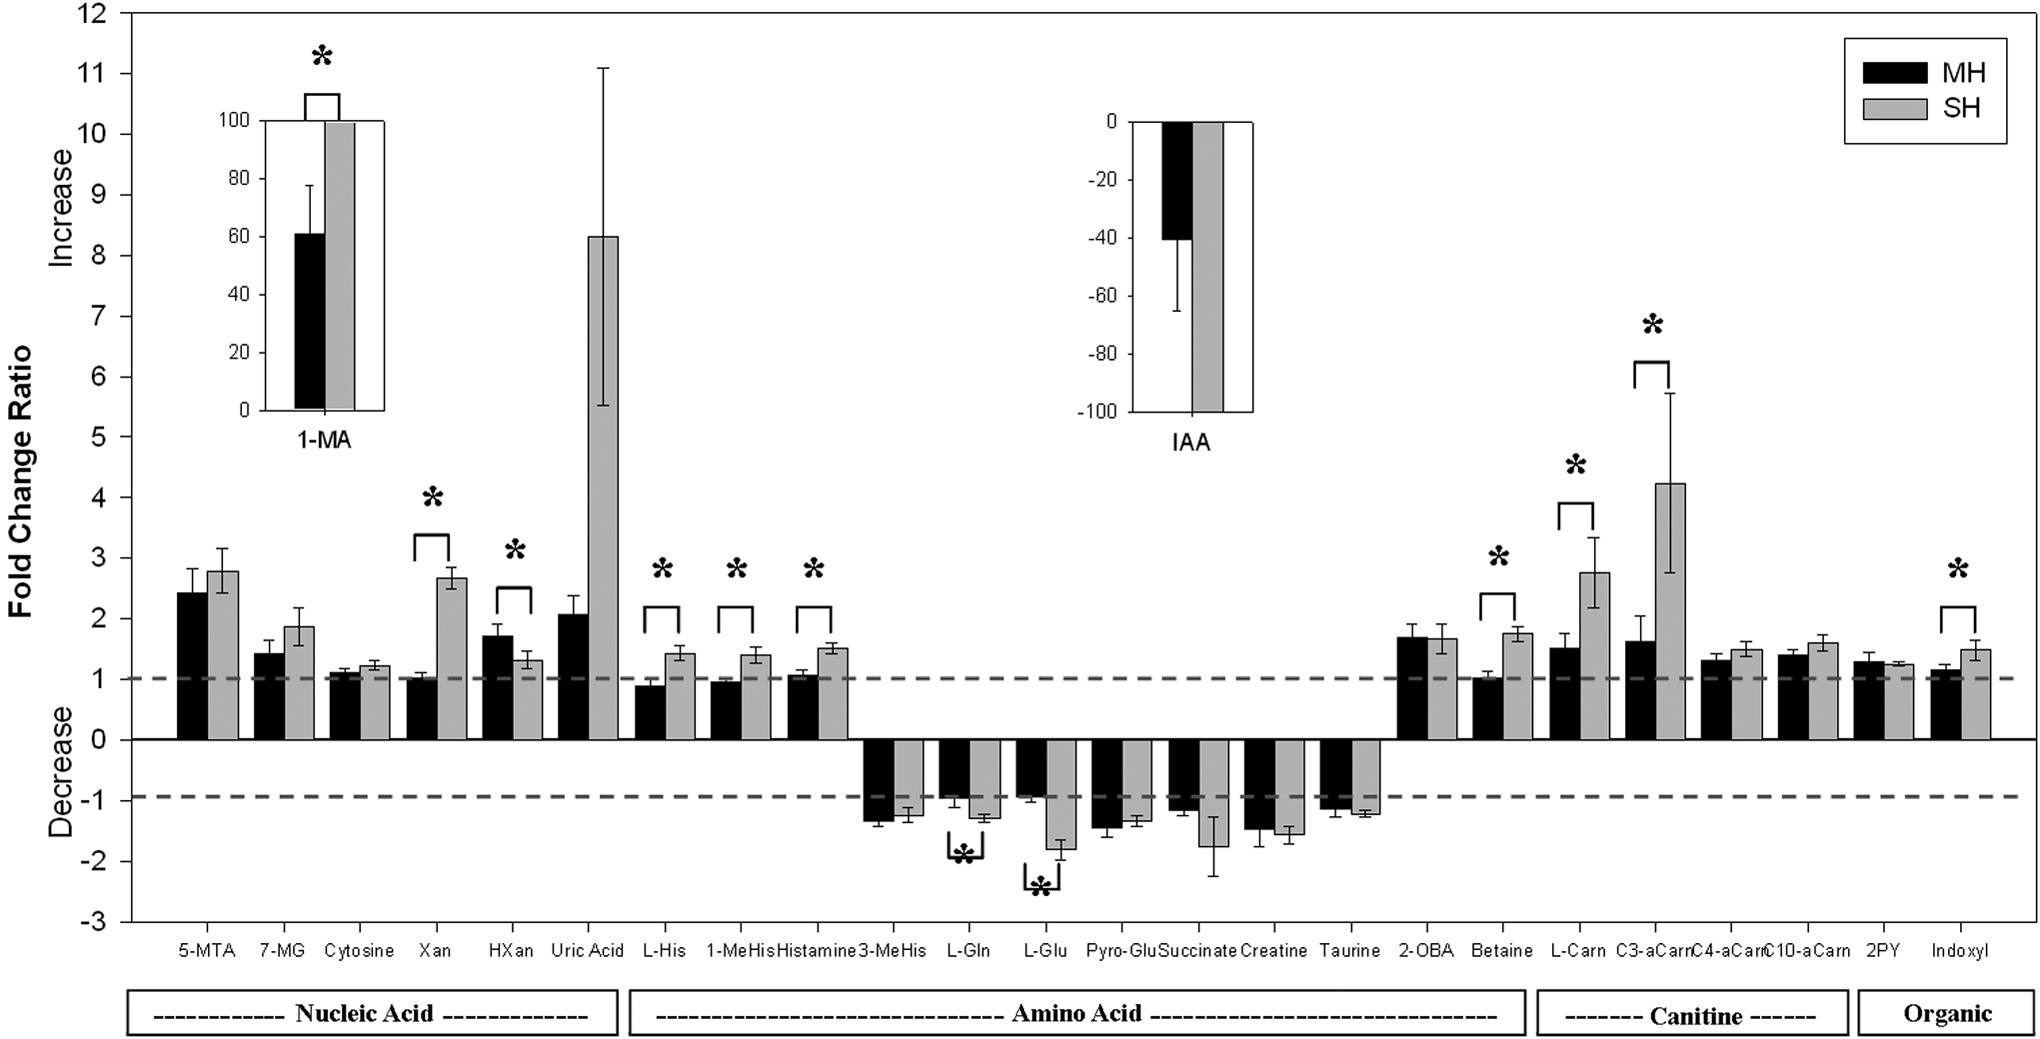
Fold change ratio bar graphs of 26 identified metabolites from 2 hours of MH and SH in urine samples. The fold change ratios were found by combining all six subjects' trials, then, depending on the type of regulation, calculating the ratio. For up regulation, the fold change ratio is found by taking the quotient of the after (H) and before (N) intensities. For downregulation, the fold change ratio is found by taking the negative value of the quotient of the N and H intensities. (i.e., upregulation: H/N, downregulation: -(N/H)). 1-MA:1-Methyladenosine, 5-MTA:5-Methylthioadenisine, Xan:Xanthine, HXan:Hypoxanthine, 7-MXan:7-Methylxanthine, L-His:L-Histidine, 1-MeHIs:1-Methylhistidine, 3-MeHis:3-Methylhistidine, L-Gln:L-Glutamine, L-Glu:L-Glutamic Acid, Pyro-Glu:Pyroglutamic Acid, 2-OBA:2-oxobutanoate, L-Carn:L-Carnitine, C3-aCarn:Propanoylcarnitine, C4-aCarn:Butanoylcarnitine, C10-aCarn:Decanoylcarnitine, 2PY:N-Methyl-2-pyridine-caboxamide, IAA:3-Indoleacetic Acid
Discussion
Diversity and variation among human subjects
In three of the four compounds shown in Figure 3, subject c had a different reaction compared to the other subjects. The diversity and variability of human subjects can further be seen in the fact that PLS-DA (Fig. 1B) yielded a scattered plot and is supported by specific compounds in Figure 3. However, we can still find general trends where, as a result of hypoxia, both 3-indoleacetic acid and L-glutamic acid decrease or disappear, which means that they are downregulated as a result of hypoxia. From the bar graphs shown in Figure 3, the variability among human individuals is evident, and because of this difference, each subject has a different reaction to their surroundings; therefore, the change as a result of moderate hypoxia is not immediately apparent.
Dose dependence
As demonstrated in Figure 4, moderate hypoxia caused changes in metabolic profiles that were not consistent between different subjects. This inconsistency was eliminated by the implementation of severe hypoxia, which generated metabolic profiles that were fairly similar regardless of individual differences of the subject. The general trend among the metabolites is clear under sever hypoxia and points to the fact that hypoxia has an effect on metabolic pathways in a dose-dependent manner. Furthermore, in all four cases presented in Figure 3, it is important to notice that all trends are particularly observable and consistent after SH. This reveals the relationship between dose and metabolite production to support the dose-dependent nature of metabolic pathways.
Metabolic pathways change with hypoxia
Metabolites, their changes associated with hypoxia, and their pathways are connected in Figure 5. The schematic diagram may provide an explanation for some of the changes in metabolites as a result of hypoxia, but an interesting result is that an upregulation in an upstream pathway due to hypoxia does not necessarily result in an increase in the production of a downstream metabolite. Our observation of significant increase levels of uric acid in both MH and SH is consistent with previous reports ( Hasday et al., 1987; Fanos et al., 2012), which suggests an increase in catabolism of the purines and probably adenosine (Pimentel et al., 2011). In hypoxia, the adenosine released during the increased degradation of ATP leads to the formation of hypoxanthine and xanthine. Once oxygen is reintroduced in the tissues during reperfusion, accumulated hypoxanthine is then oxidized to uric acid; therefore, a high level of these substances is eventually released through the circulation into urine (Papezikova et al., 2006; Zhu et al., 2007; Basu et al., 2008; Sinha et al., 2009). Similarly, subjects living at high altitude frequently have hyperuricemia due to an analogous process with constant yet low levels of hypoxia (Arestegui et al., 2011). In addition, histidine metabolites increase with the introduction of hypoxia, but glutamate metabolites decrease because of hypoxia. Carnitine and acetylcarnitines both increase with hypoxia, which suggests an increase in energy metabolism. More research is needed to connect each metabolite firmly; however, our results suggest some trend exists between closely related metabolites (those that are closer in the pathway). While the complexity of humans, and the potential involvement of hormones such as catecholamine which alter metabolic profiles (Mazzeo et al., 1991; Rostrup et al., 1998), makes a specific relationship between each metabolite difficult to establish, there is a clear difference in products when comparing the metabolites produced under normal conditions with those produced under hypoxic conditions. This difference grants our project significance because this change in metabolite can be used as an indicator of the individual's physical condition.
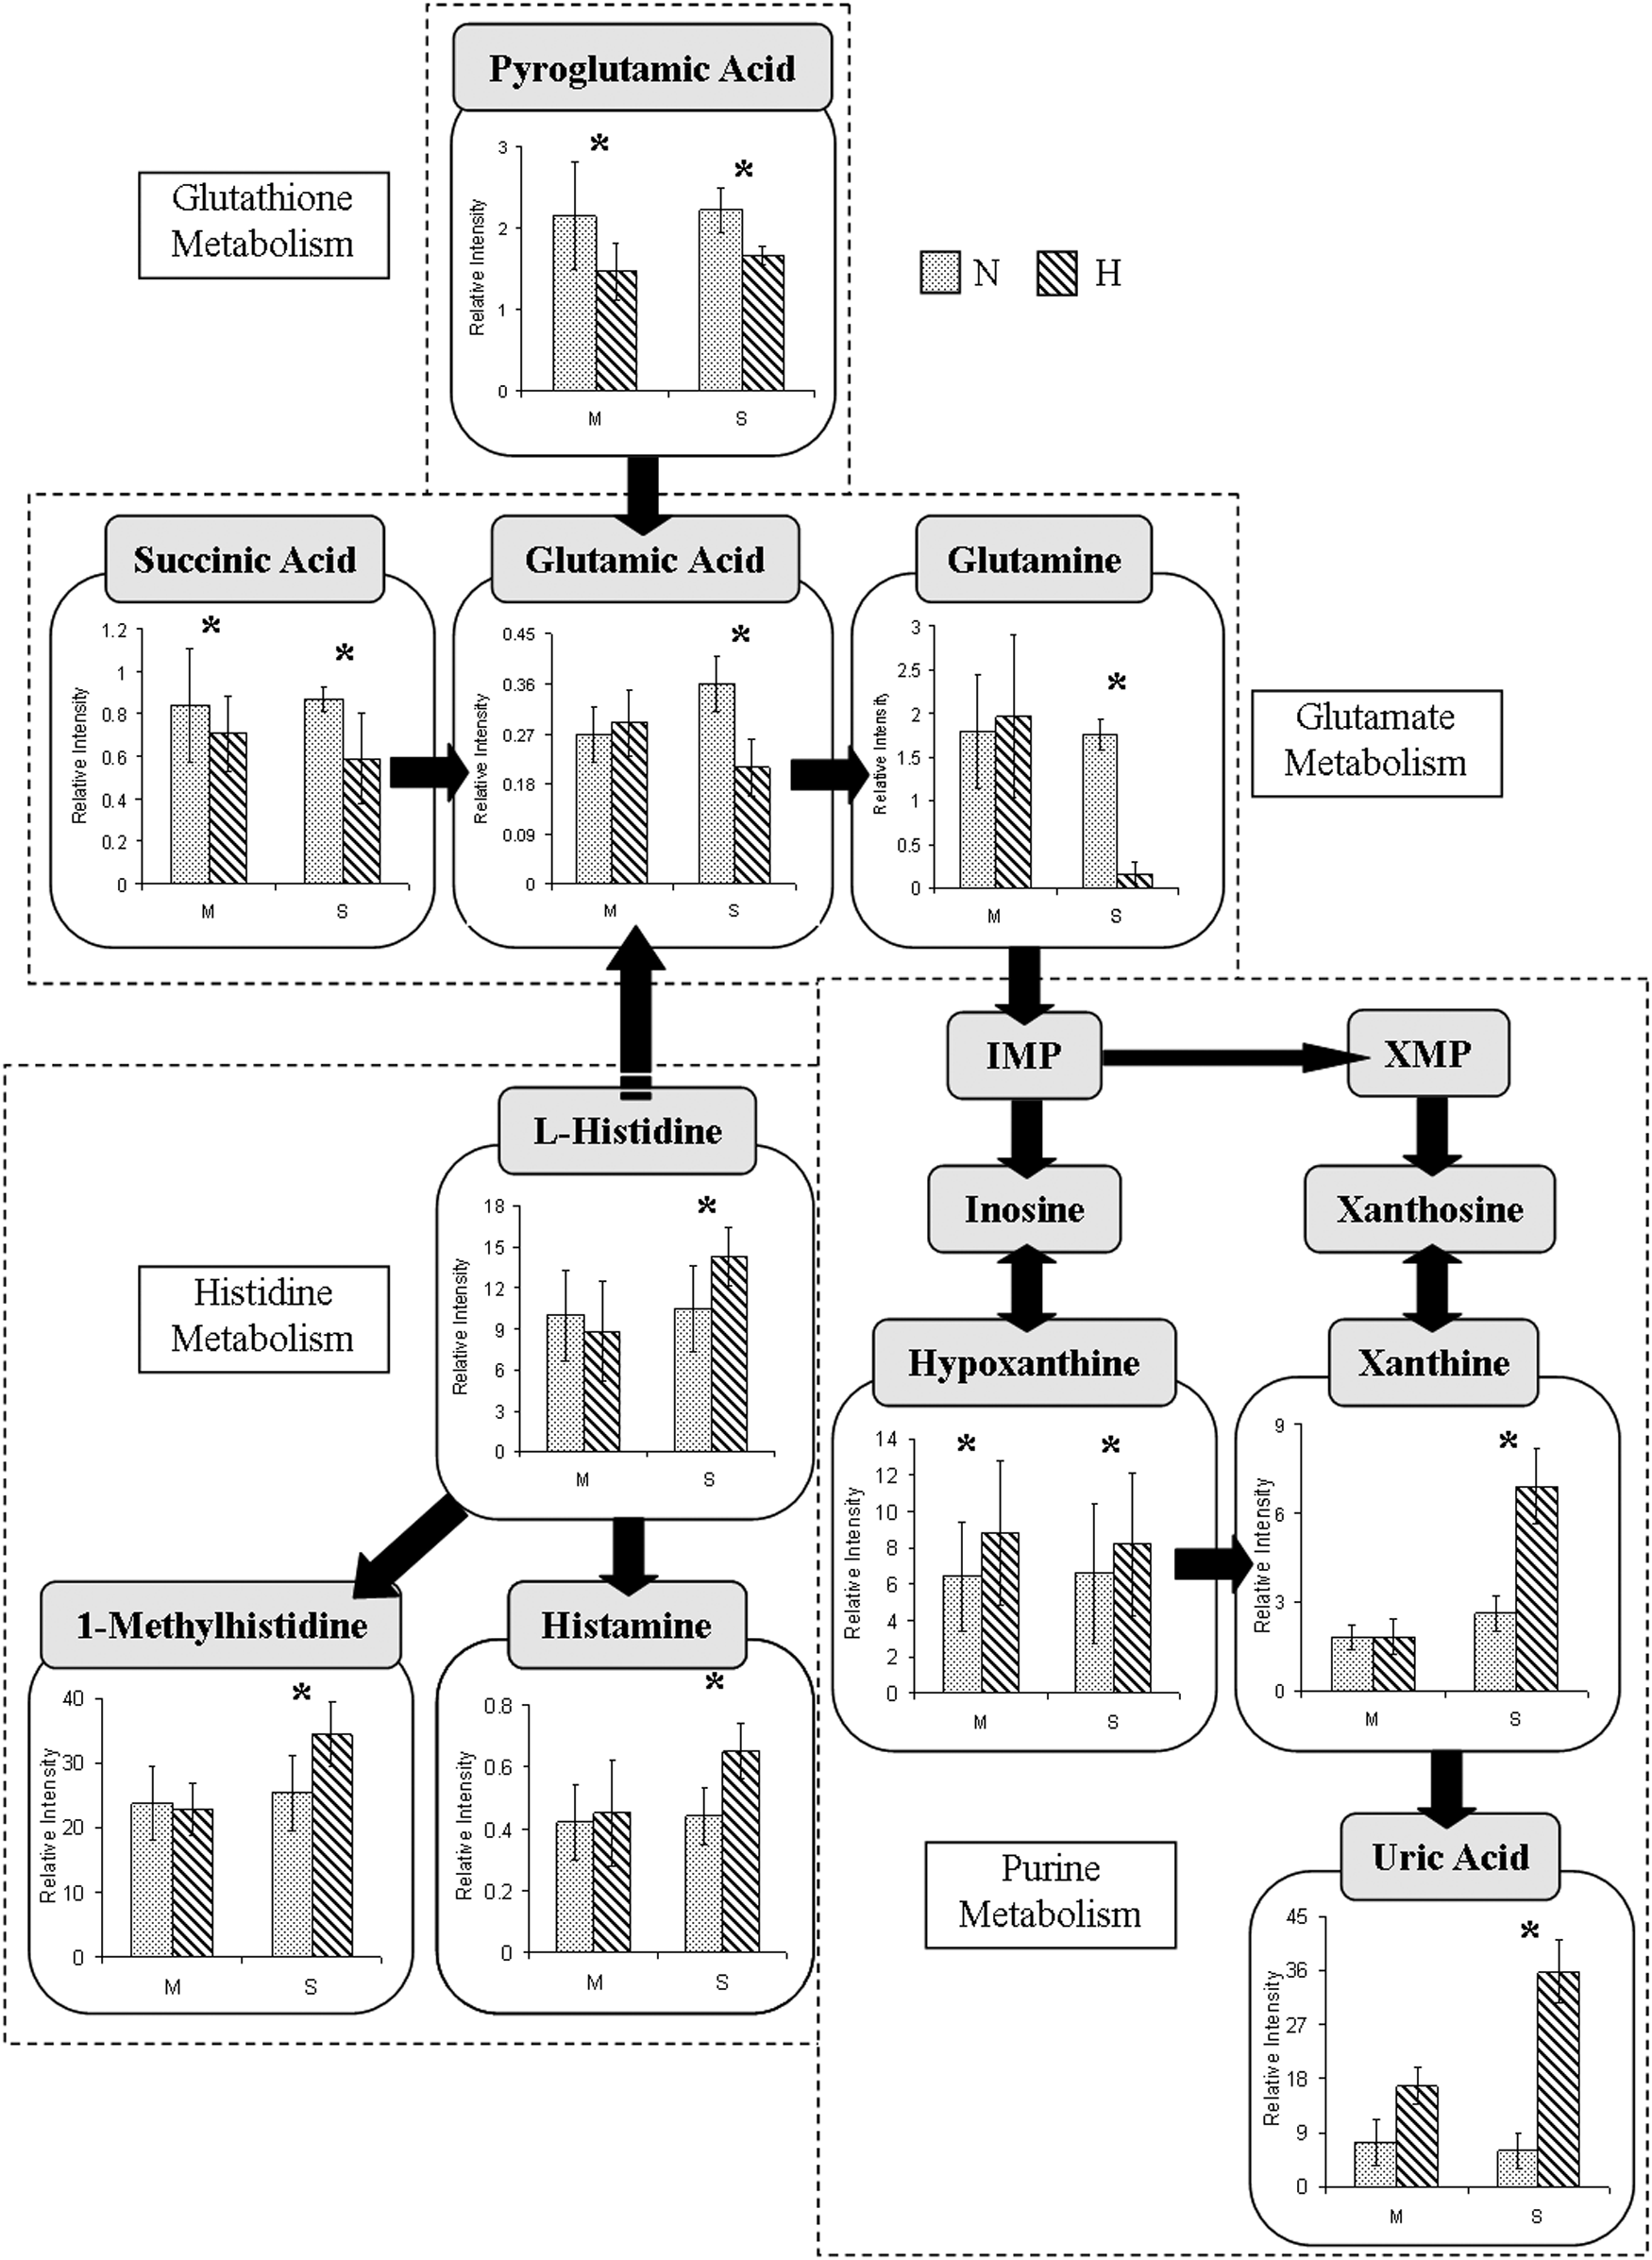
Simplified schematic trend outlining the potential metabolic pathways involving10 metabolites whose concentrations were changed after 2 hours of MH and SH.
1-Methyladenosine as a biomarker for hypoxia
1-Methyladenosine was obviously upregulated from MH to SH, suggesting the possibility of its role as a potential biomarker for hypoxia. The demethylation process of methylated DNA involves 2-oxoglutarate (2OG) and AlkB, one of four proteins involved in the adaptive response to DNA alkylation damage (Trewick et al., 2002). 2OG reacts with oxygen and is also involved in the hydroxylation of hypoxia-inducible factor-1 (HIF-1). HIF-1, an oxygen-regulated transcriptional activator, enters the nucleus of the cell to cause various pathological changes such as angiogenesis and inflammation under hypoxia. As a result, 2OG cannot function as a co-substrate in either reaction, and 1-methyladenosine accumulates from methylated DNA as well as the above-mentioned pathological changes (Welford et al., 2003). This accumulation could be the reason 1-methyladenosine was observed in the urine samples for this study. An increase in urinary 1-methyladenosine, therefore, may be a very sensitive biomarker that reflects cellular hypoxia.
Conclusion
This study observed the change in human urinary metabolites as a result of hypoxia. Six healthy, university-aged males were used in this study. Urinary analysis was chosen due to the noninvasive nature, ease, and low impact of the procedure. From the metabolic profiles collected from each subject, we were able to demonstrate the variability of humans both between subjects and within the individual subject, even before any special conditions were imposed. This reveals the sensitivity of metabolomics, as well as the diversity of humans. Due to the diversity of humans, the results from moderate hypoxia intervention are not consistent between the six subjects; however, SH intervention yields clear trends for all subjects. The differences between MH and SH reveals the dose-dependent nature of the changes induced by hypoxia intervention found in metabolic pathways. Similar to the common renal physiologic responses of hyperuricemia at high altitude, purine metabolic products (uric acid, xanthine, and hypoxathine) are increased as a result of hypoxia in this study; this increase can be used as a marker for the hypoxic condition. 1-Methyladenosine, which has been implicated in the activation of HIF-1, was also highly upregulated from MH to SH and may be a very sensitive biomarker that reflects hypoxia on the cellular level. Finding ways to detect hypoxia within a subject may help facilitate early detection and prompt treatment of the disease because hypoxia is a feature common to many diseases. With metabolomics, even small changes within the human body previously hard to discern can be detected; they have the potential for being markers for specific disease.
Footnotes
Acknowledgments
This work was supported by the Nation Science Council of Republic of China (NSC 101-2410-H-182-028) and Chang Gung University (UMRPD5A0071) to Bih-Show Lou.
Author Disclosure Statement
The authors report no conflict of interest.