
Abstract
Abstract
Wagner, Dale R., Skyler Saunders, Brady Robertson, and John E. Davis. Normobaric hypoxia effects on balance measured by computerized dynamic posturography. High Alt Med Biol. 17:222–227, 2016.—
Introduction
A
The two most commonly used assessments of acute mountain sickness (AMS), the Environmental Symptoms Questionnaire (ESQ) and the Lake Louise Score (LLS), include items related to hypoxia-induced imbalance. The 11-item ESQ includes three equilibrium-related symptoms: dizziness, lightheadedness, and loss of coordination (Sampson et al., 1983). The self-report portion of the LLS includes a self-assessment of “dizziness/lightheadedness,” and the clinical assessment specifically addresses ataxia as measured by the ability to complete a heel-to-toe walking test (Roach et al., 1993). Furthermore, the appearance of ataxia is one of the earliest signs of the life-threatening condition of high-altitude cerebral edema (HACE) (Grissom, 2011; West et al., 2013).
Studying ataxia or dysfunction in equilibrium under hypoxic conditions is meaningful for a large portion of the population that goes to altitude. Study findings are relevant not only to high-altitude trekkers and mountaineers but also to military personnel deployed rapidly to altitude and to the millions of people who recreate and work intermittently at altitude, particularly in activities and jobs that require good balance. Despite the applicability of this research and the link between ataxia and altitude illnesses, there are relatively few studies that have examined the effects of hypoxia on equilibrium. For example, combining the search terms “altitude and headache” produced 674 results in the Scopus database; comparatively, “altitude and imbalance” produced just 165 hits, and “altitude and ataxia” resulted in only 88 documents.
Several researchers have used indirect measures, such as heel-to-toe walking, wobble board, sharpened Romberg test, and the balance error scoring system in an attempt to assess ataxia in field settings with varying success (Johnson et al., 2005a, 2005b; MacInnis et al., 2012). Although these tests have some clinical value, they are not sensitive enough to detect small but meaningful changes in postural balance that can be identified using direct measures of center of pressure.
Baumgartner et al. (2002) noted that although there was no noticeable change in heel-to-toe walking when subjects went from 450 to 4559 m, sway velocities, as measured by a force platform, increased significantly at altitude. Consequently, many researchers have used force platforms to measure balance at various altitudes; however, their investigations were restricted to static posturography (Holness et al., 1982; Fraser et al., 1987; Nordahl et al., 1998; Baumgartner and Bärtsch, 2002; Baumgartner et al., 2002; Hoshikawa et al., 2010; Degache et al., 2012).
Assessing only static balance is quite limiting, as most tasks in life require dynamic balance. Computerized dynamic posturography allows for the assessment of both static balance and dynamic balance. Also, maintaining balance or postural control is complex with the central nervous system processing inputs from vision, vestibular, and somatosensory systems (Brandt and Strupp, 2005). Computerized dynamic posturography is capable of quantifying the contributions from each of these three systems in controlling equilibrium. This is achieved by multiple short tests done on a movable force platform surrounded by a screen that can tilt to challenge different combinations of vision, vestibular, and somatosensory input.
To our knowledge, only one investigation has been done using computerized dynamic posturography to measure hypoxia-induced changes in balance. These researchers gave subjects nitrogen-enriched gas to simulate altitudes of 1524, 2438, and 3048 m, and the subjects were at each simulated altitude for only 10 minutes (Wagner et al., 2011). The aim of our study was also to use computerized dynamic posturography to compare the effects of varying levels of normobaric hypoxia on equilibrium. However, the maximum simulated altitude achieved in our study was much higher (5000 m), study participants were hypoxic for much longer (80 minutes), and we also evaluated postural control before and after a 10-minute hypoxic exercise bout.
Materials and Methods
Subjects
Males deemed low risk according to the American College of Sports Medicine risk factor guidelines (ACSM, 2014) were recruited for participation by word-of-mouth and informational flyers from the university community. Furthermore, all subjects had lived in the area for at least a year; thus, they were assumed to be acclimatized to the altitude of the testing location (1425 m). The study protocol was approved in advance by the Institutional Review Board of Utah State University. Volunteers (N = 13) were informed of the purpose, procedures, and benefits and risks of participation before signing a written informed consent.
Procedures
All testing took place in the sports medicine research complex of the university (1425 m). Following a familiarization trial, each research participant completed three balance test sessions in random order. Test sessions were separated by at least 24 hours. Each test session was carried out under a different hypoxic condition, simulating altitudes of ∼1500, 3000, and 5000 m.
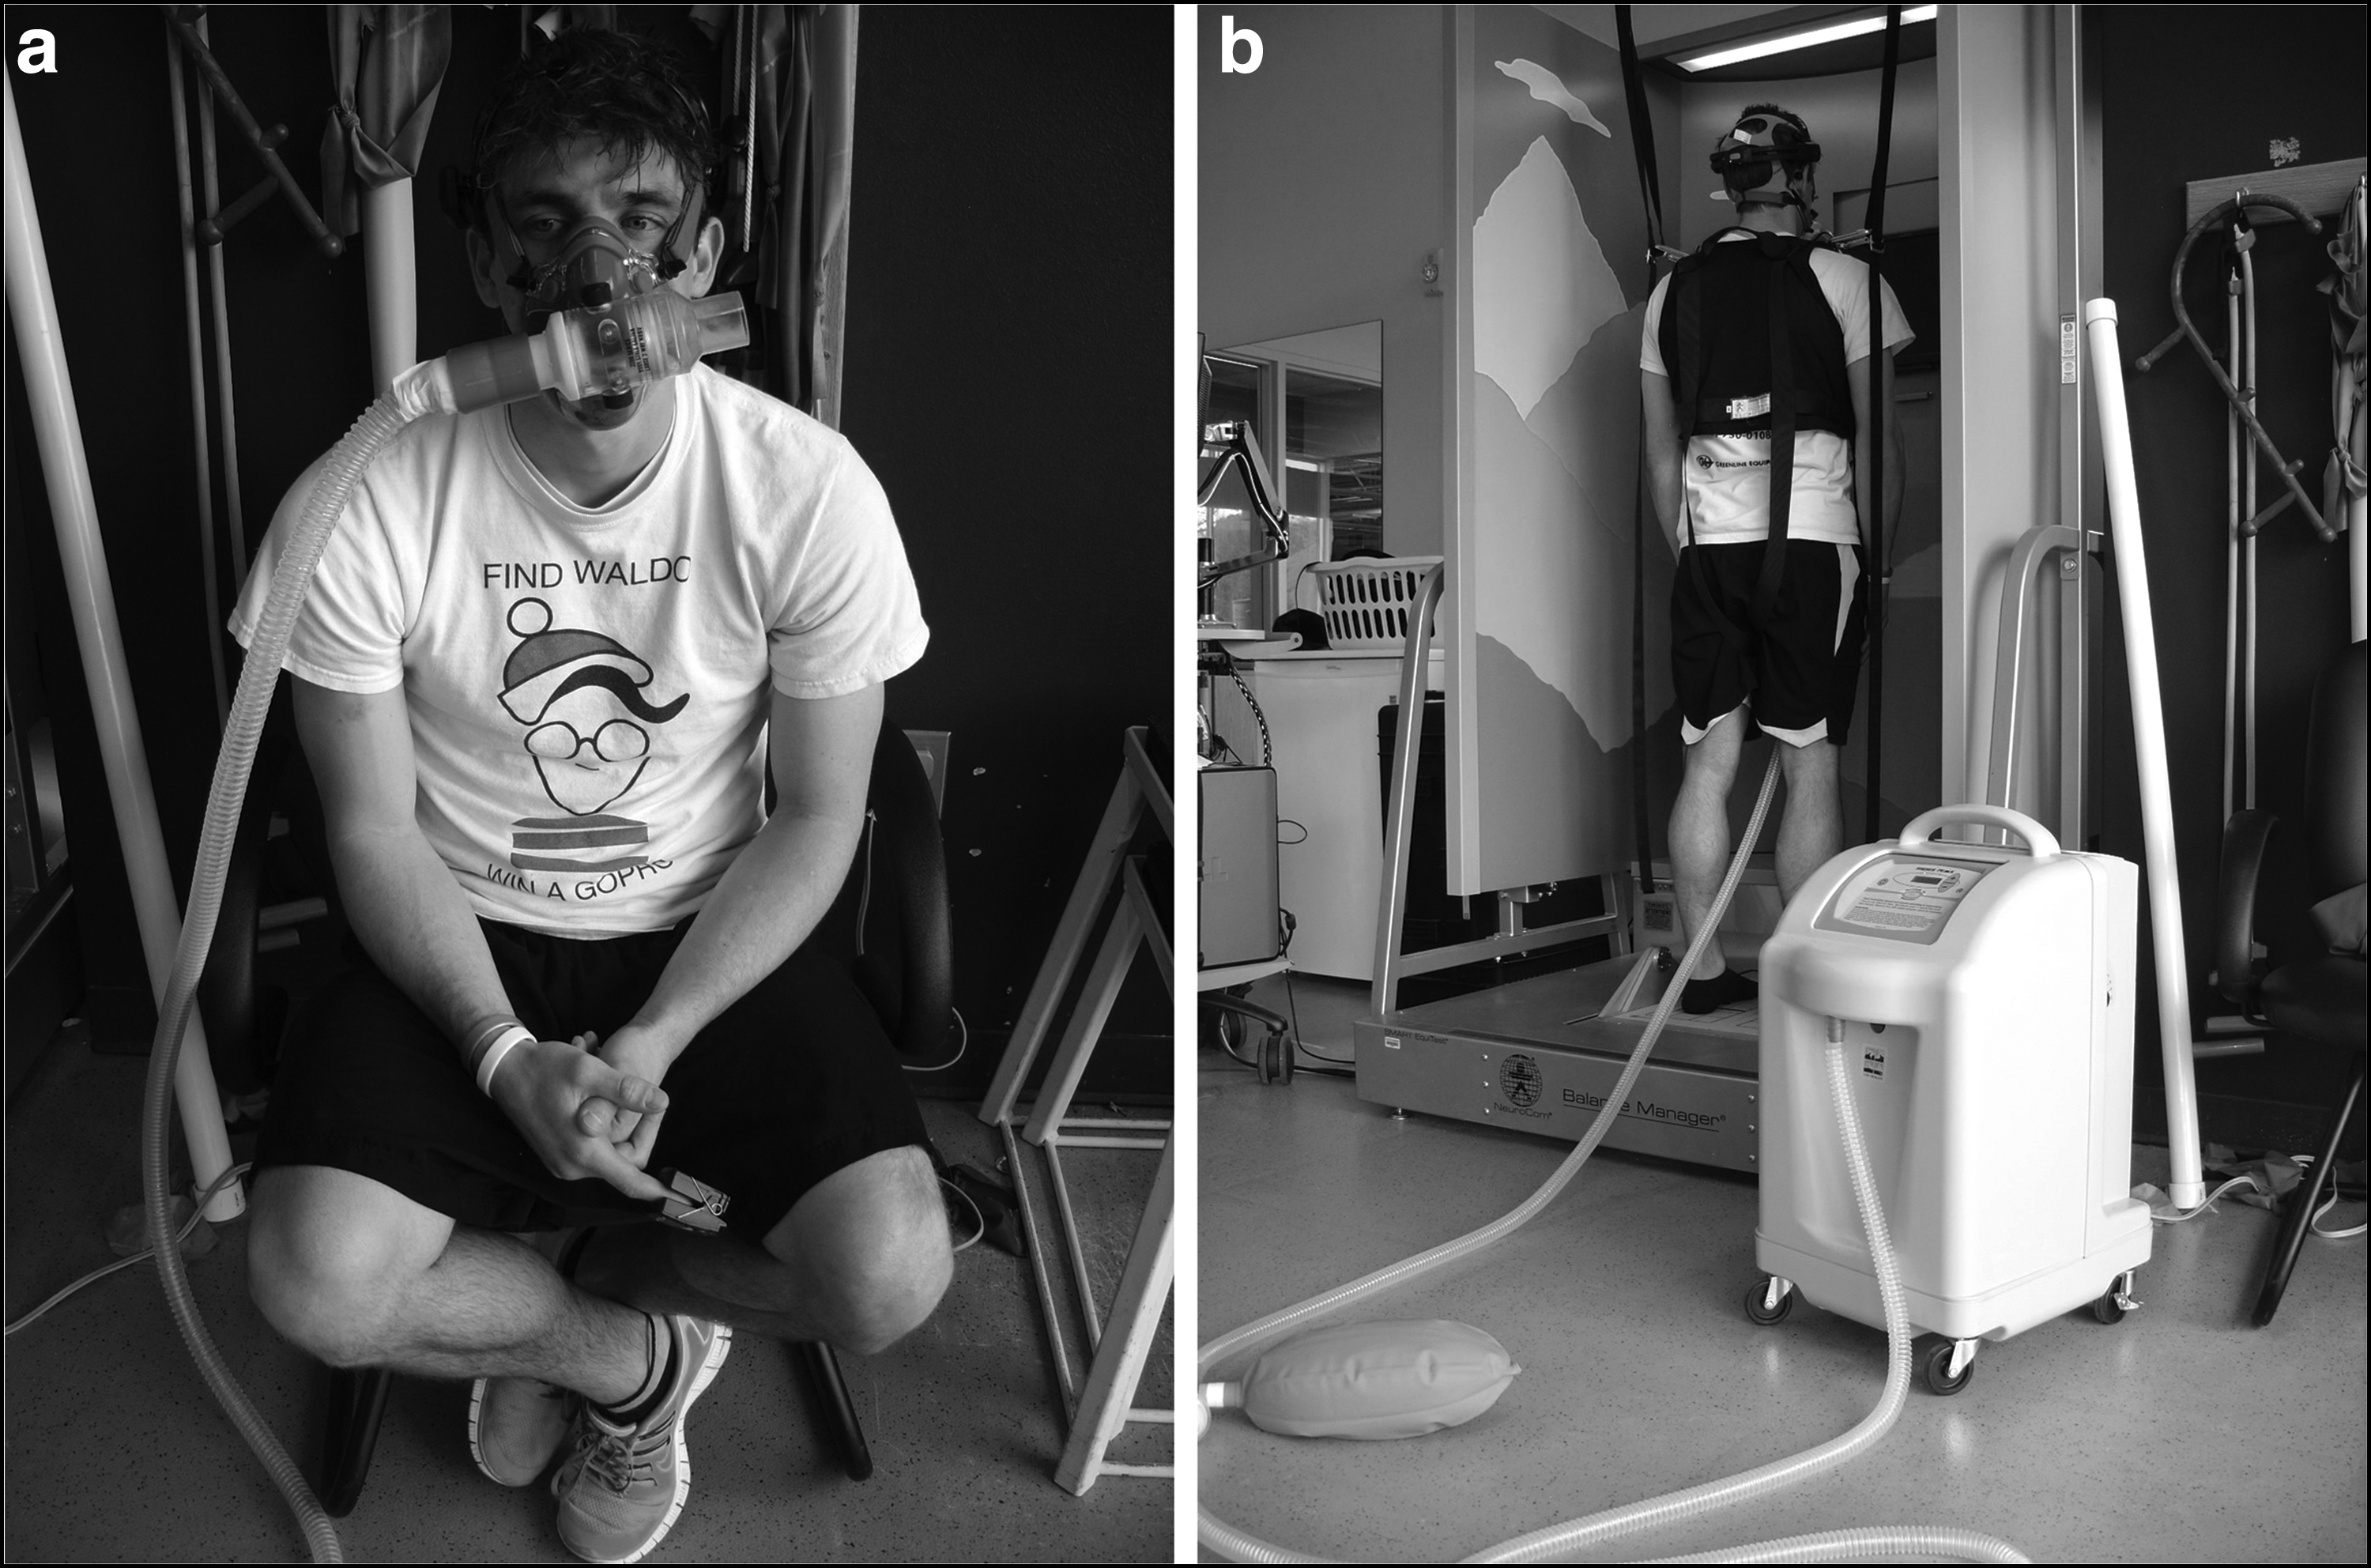
On entering the research complex, the subject was fitted with a facemask and tethered to a hypoxic generator (MAG-10, Higher Peak Altitude Training, Winchester, MA) with a flexible plastic hose (Fig. 1). Each session consisted of 20 minutes of rest followed by balance testing, then 10 minutes of exercise (5 minutes of walking at 4.84 km/h [3 miles/h] and 5 minutes running at 9.68 km/h [6 miles/h]), followed by 10 minutes of seated recovery before a second series of balance tests, all while connected to the hypoxic generator. Each test session lasted about 80 minutes.
Hypoxia
Hypoxia was created with a hypoxic generator that uses zeolite and pressure swing absorption to separate the air. A combination of the generator setting (0.5–10) and air flow (40%–100%) creates an “effective oxygen percentage.” Charts provided by the manufacturer estimate the fraction of inspired oxygen (FiO2) and simulated altitude for a given setting and air flow. For example, a generator setting of 2 at high air flow will reduce the FiO2 from 20.9% to 19.3% and simulate an altitude 700 m higher than the test location.
There is no digital read-out or meter on the generator to indicate the FiO2 that is being received; therefore, during pilot testing, we experimented with various settings and air flows while a sampling line from the inspiratory reservoir bag of the hypoxic generator was connected to an oxygen analyzer (TrueOne 2400; Parvo Medics, Sandy, UT). Thus, we were able to verify the reliability of the generator and the approximate oxygen percentage that the participants would be breathing at a given setting and air flow.
Given that the testing site was located at 1425 m, the “effective oxygen percentage” was already ∼17.7%, or 3.2% less than sea level, even without the hypoxic generator connected. Of the three trials, one session was essentially a sham trial with minimal hypoxia; the generator reduced FiO2 from 20.9% to 20.4%, making the effective oxygen percentage 17.2% (20.4–3.2 = 17.2), equivalent to ∼1500 m (Table 1). The other two trials had effective oxygen percentages of ∼14.5% and 11.3%, simulating altitudes of 3000 and 5000 m, respectively.
FiO2 for a given generator setting and air flow provided by a chart from Higher Peak.
Mean ± SD of barometric pressure (mmHg) at testing center (1425 m) for that trial.
Mean ± SD of pressure of inspired oxygen (mmHg), calculated as barometric pressure minus 47 times FiO2.
Calculated as FiO2 at sea level minus 3.2, because the FiO2 at the testing location was ∼3.2% less than sea level (645/760 = 84.9% × 20.93 = FiO2 of 17.77%; 20.93–17.77 = 3.16).
Approximate altitude from FiO2 at testing site from chart provided by Higher Peak.
FiO2, fraction of inspired oxygen; SD, standard deviation.
Participants wore a finger pulse oximeter (Onyx 9500 SportStat; Nonin Medical, Plymouth, MN) throughout the test for safety and to verify that they were hypoxic. The peripheral oxygen saturation (SpO2) was recorded each minute during exercise, and every 2 minutes during rest, recovery, and balance testing; SpO2 was averaged for each of these phases of the session for subsequent analysis.
Balance tests
While connected to the hypoxic generator, standardized protocols for balance and motor control function were performed using the SMART EquiTest system (NeuroCom, Clackamas, OR). This system utilizes a motorized force plate and moving walls. It is also known as computerized dynamic posturography and is considered the gold standard of balance testing (Yim-Chiplis and Talbot, 2000). It was deemed reliable for active young males (Dickin and Clark, 2007), our study sample.
The test battery included a sensory organization test and a motor control test. Following standardized protocol, participants were strapped into a safety harness and instructed to stand as still as possible for these tests. The sensory organization test involves six conditions designed to partition the sensory effect of vision, proprioception, and vestibular inputs. A composite equilibrium score ranging from 0 (least stable) to 100 (most stable) is generated. In addition, the sensory analysis graph was visually inspected. This graph indicates if the participant is below the expected value for somatosensory cues, visual cues, vestibular cues, or relies on visual information to maintain balance even when the information is incorrect.
For the motor control test, participants respond to unexpected platform movements in forward and backward directions. The time between the platform translation and the participant's force response is called the latency score. A composite score for these response times is generated. Details of the computerized dynamic posturography sensory organization test and motor control test have been described previously (Jones et al., 2011; Wagner et al., 2011).
Statistical analyses
The independent variables were the simulated altitude (1500, 3000, and 5000 m) and exercise status (pre- and postexercise). The dependent variables were the SpO2, the composite equilibrium score of the sensory organization test, and the latency score of the motor control test. All data were screened for outliers and preanalyzed for violations of normality using the Shapiro–Wilk test and sphericity using Mauchly's test. Subsequently, mean differences were assessed with a two-way (pre- and postexercise and hypoxia condition) repeated-measures analysis of variance on each dependent variable. Bonferroni post hoc was used to compare significant main effects. Statistical significance was accepted at p < 0.05. All analyses were done using SPSS (version 22; IBM Corp., Armonk, NY). In addition, the sensory analysis graphs were visually inspected, and the number of times participants fell below the expected values was tallied.
Results
One participant fainted after only a few minutes at the simulated 5000 m condition. He was excluded from the study. Thus, the data set was reduced to a sample of 12 (27.3 ± 7.1 years). There were no outliers. SpO2, sensory organization test, and motor control test data were normally distributed (p = 0.068–0.946), and the assumption of sphericity for the within-subjects effect of hypoxia was met for the sensory organization test (p = 0.089) and motor control test (p = 0.647). However, the assumption of sphericity was violated (p = 0.008) for SpO2; thus, the Greenhouse–Geisser correction was used for this variable. The means ± SDs for each dependent variable under each testing condition are presented in Table 2.
Significantly different from 1500 m (p < 0.05).
Significantly different from 3000 m (p < 0.05).
MCT, motor control test; SOT, sensory organization test; SpO2, peripheral oxygen saturation.
The barometric pressure at the testing site varied from 634 to 654 mmHg (645.4 ± 6.2 mmHg) over the course of the study. The difference in test site barometric pressure across trials was not significant (p = 0.511).
Throughout the test session, whether at rest, during exercise, or in recovery, the SpO2 was significantly lower (p < 0.001) for each increase in simulated altitude, indicating that the hypoxic generator was indeed having a physiological effect. Values ranged from a high of 95.2% ± 1.4% while resting at 1500 m to a low of 75.5% ± 7.6% while performing the postexercise balance test at 5000 m. Specific to the balance portion of the test, hypoxia significantly changed the SpO2 (p < 0.001, η2 = 0.873). Pairwise comparisons revealed that the SpO2 significantly dropped with each higher altitude: 5000 < 3000 < 1500 m (p < 0.001, Table 2). The main effect of exercise was also significant for SpO2 (p = 0.027, η2 = 0.475), such that postexercise SpO2 was less than pre-exercise SpO2, even after 10 minutes of recovery. The hypoxia–exercise interaction was not significant (p = 0.657).
For the sensory organization test, the hypoxia–exercise interaction was not significant (p = 0.821). The main effect of exercise was not significant (p = 0.911), but the main effect of hypoxia was significant (p < 0.001, η2 = 0.549). Pairwise comparisons revealed that the 1500 and 3000 m conditions were not significantly different (p = 0.285), but the 5000 m trial produced lower sensory organization test scores than either the 3000 m (p = 0.006) or 1500 m (p = 0.011) conditions (Table 2). The tally of the sensory analysis graphs was five incidences of visual cue errors and six incidences of relying on inaccurate visual cues to maintain balance in a situation of visual conflict during the 5000 m session. There were four vestibular errors and one somatosensory error at 5000 m. In contrast, the errors were fewer and inconsistent for the 1500 and 3000 m sessions. Finally, the motor control test was neither affected by hypoxia (p = 0.158) nor exercise (p = 0.338).
Discussion
The primary finding for this study was that the sensory organization test score was reduced at 5000 m compared to both 3000 and 1500 m, with no difference in these test scores between the lower altitudes. Furthermore, the magnitude of decrement in the sensory organization test between the 3000 and 5000 m trials, both before the exercise bout (−10.7) and after exercising (−10.0), was large enough to be clinically meaningful. Wrisley et al. (2007) determined that a change in the sensory organization test composite score greater than eight points was a meaningful change beyond the test–retest reliability of the SMART EquiTest system and beyond any difference that might be expected from a learning effect.
In the only other study known to have used the SMART EquiTest system to assess hypoxia-induced changes in balance, Wagner et al. (2011) reported a statistically significant (p = 0.05) decrement in the composite sensory organization test of males breathing hypoxic gas, simulating an altitude of just 2438 m. However, close inspection of their data reveals that the decrement in the sensory organization test at 2438 m compared to baseline was only −2.8 points. Thus, although this was deemed to be statistically significant, this small decrement that they observed at this relatively low altitude does not meet the definition of Wrisley et al. of a clinically meaningful finding when using the NeuroCom.
Other investigators have reported an increase in postural sway as measured by static posturography after only a few minutes of mild hypoxia at altitudes as low as 1521 m (Fraser et al., 1987). However, once again, the magnitude of change and the clinical significance of these statistically significant findings are in question. In contrast to these studies, our results suggest that a substantial amount of hypoxia is needed before there is a clinically significant impact on postural balance. However, the participants of the present study resided at 1425 m; thereby, they were acclimatized to moderate altitude. It is thought that acclimatization can improve hypoxia-induced impairments in postural sway (Hoshikawa et al., 2010). Thus, individuals who live at low altitudes might experience meaningful decrements in postural balance at altitudes lower than what was observed in the present study.
The inability to ignore inaccurate visual cues was the most common error at 5000 m, leading to the reduced sensory organization test score under the most hypoxic condition. The central nervous system must process inputs from vision, vestibular, and somatosensory systems to maintain balance. Based on these results, the visual component appears to be more sensitive to hypoxia than the vestibular or somatosensory systems.
Other investigators have also commented on the importance of the visual component in their investigations of static balance. Holness et al. (1982) reported that anteroposterior sway was greater when the eyes were closed, but Nordahl et al. (1998) reported that the relative increase in anteroposterior sway at altitude was greater with the eyes open than with the eyes closed. Nordahl et al. concluded that vision is the first of the special senses to be altered by hypoxia, adding support to our finding.
Inaccurate visual cue errors can occur when the individual is presented with visual stimuli, which give an inaccurate perception of the individual's orientation. This happens during conditions 3 and 6 of the NeuroCom's sensory organization test when the walls surrounding the system move proportionally to the anterior–posterior sway of the subject. We can only speculate on the practical implications of this finding in a real-life scenario, but this type of stability error is more likely to occur when visibility is low, there is not a solid visual reference point, or there is an aspect of the environment that is visibly moving. For example, if unacclimatized rescue or military personnel were rapidly deployed to 5000 m and they encountered white-out conditions with snow blowing sideways, this could give the optical illusion of movement. In this case, individuals would need to ignore the visual cue that they are moving or tipping over laterally and instead rely on ankle proprioception and vestibular cueing that they are in fact upright.
Despite a trend toward higher latency times with increasing simulated altitude, hypoxia did not significantly alter the motor control test. Responses to the motor control test rely primarily on somatosensory input (Wagner et al., 2011). Since there was only a single somatosensory error at 5000 m, it stands to reason that there would not be a significant change in the latency score. In contrast, Wagner et al. (2011) reported a significant increase (p = 0.03) in motor control test reaction times from 133.3 milliseconds at baseline to 139.6 milliseconds at 3048 m. However, their statistically significant 6.3 millisecond increase is similar in magnitude to our nonsignificant 4.6 millisecond (pre-exercise) and 6.8 millisecond (postexercise) increases between 1500 and 5000 m (Table 2), and we are unaware of any research that delineates the magnitude of change in reaction time that is clinically meaningful for the motor control test.
To our knowledge, we are the first research team to include an exercise component to the investigation of postural control while hypoxic. As expected, the exercise resulted in a slight but significant decrease in SpO2, even after 10 minutes of recovery. However, the slightly lower SpO2 did not alter sensory organization test or motor control test scores. Other researchers have reported no significant correlation between posturography measurements and SpO2 (Baumgartner et al., 2002; Johnson et al., 2005a; MacInnis et al., 2012).
The exercise bout was specifically designed to be short and not extremely vigorous to provide a moderate exercise challenge and to ensure that subjects were able to complete the exercise at the greatest hypoxia level. A more fatiguing exercise bout might have resulted in lower postexercise scores. Degache et al. (2014) investigated the postural control of 18 ultramarathon runners before and after a 330 km trail run. They found that, due to muscle fatigue, the runners took longer to stabilize their body after the run compared to the pre-exercise measurement.
Participants were hypoxic for a total duration of about 80 minutes each session. This is a substantially longer duration of hypoxic exposure than several previous posturography studies (Fraser et al., 1987; Nordahl et al., 1998; Wagner et al., 2011; Degache et al., 2012), however, it is not long enough for AMS to develop. The development of AMS takes several hours, and AMS reaches peak severity between 18 and 22 hours of exposure (Beidleman et al., 2013).
Cymerman et al. (2001) noted that both quantifiable AMS symptoms and increases in postural instability were present within 3 hours of exposure to 4300 m in a hypobaric chamber, but AMS and postural instability were not correlated. Several research teams have concluded that ataxia and mild to moderate AMS are not related, and ataxia becomes a problem only with severe AMS or HACE (Cymerman et al., 2001; Baumgartner and Bärtsch, 2002; Baumgartner et al., 2002). However, MacInnis et al. (2012) reported that trekkers who had AMS at 4380 m also scored worse on the Balance Error Scoring System field test of balance than those who did not have AMS.
Given the limited duration of hypoxic exposure, the purpose of our study was not AMS; thus, we did not formally assess it with ESQ or LLS. Nevertheless, none of the participants complained of symptoms consistent with AMS. A computerized dynamic posturography study with a longer duration of hypoxic exposure might help to clarify the relationship or lack of relationship between AMS and ataxia.
The results of the present study are somewhat confounded by the combination of hypobaric hypoxia (testing site at 1425 m) and normobaric hypoxia (reduced FiO2 via hypoxic generator). Millet et al. (2012) identified numerous differences in physiological responses between hypobaric hypoxia and normobaric hypoxia. Notably, ventilation is lower in hypobaric hypoxia than normobaric hypoxia. We did not measure ventilation in the present study. If the normobaric hypoxia caused excessive hyperventilation, resulting in respiratory alkalosis and cerebral vasoconstriction, vision could have been affected (Petrassi et al., 2012).
Degache et al. (2012) studied hypoxia-induced postural instability at 400, 1700, and 3000 m in both normobaric and hypobaric environments. They found that postural instability was increased with hypobaric hypoxia but not normobaric hypoxia, and they concluded that postural instability is influenced more by barometric pressure than by changes in the FiO2. However, other researchers have reported increases in postural instability with study designs that have used normobaric hypoxia (Holness et al., 1982; Wagner et al., 2011).
The hypoxia delivery system is also a potential study limitation. It is possible that the facemask and tube (Fig. 1) could have impaired vision or otherwise affected balance in a manner that being unequipped would not have. However, the testing conditions were the same for all trials, including the sham trial. Also, the simulated altitudes created by the hypoxic generator are approximations. Given slight day-to-day variability in barometric pressure, it is likely that the assumed altitudes were not exact or consistent across all participants. Furthermore, there were slight differences between the oxygen levels measured during pilot testing and the manufacturer's oxygen level tables. For example, the theoretical effective oxygen percentage with a generator setting of 6.0 at 50% air flow at our testing altitude of 1425 m was 11.3%, but measurements from an oxygen analyzer varied from 10.7% to 11.0%. Thus, it is likely that our simulated 5000 m trial exceeded 5000 m. Nevertheless, we are confident that the subjects received three distinct levels of hypoxic exposure: low, moderate, and high.
Conclusion
In summary, in participants acclimatized to 1425 m, normobaric hypoxia simulating 3000 m did not affect balance as measured by computerized dynamic posturography. A normobaric hypoxia simulation of 5000 m resulted in a statistically and clinically significant decrease in the sensory organization test composite score without a significant change in the motor control test reaction time. Impairments in visual function, more than vestibular or somatosensory, appear to be the limiting factor for maintaining balance while hypoxic. A modest exercise bout while hypoxic further decreased SpO2, but this did not have any additional effect on the computerized dynamic posturography measurements.
Study findings are specific to acute hypoxic exposure and do not pertain to individuals who are acclimatized to altitudes above 1500 m. Furthermore, no relationship between instability and altitude illness can be made from this investigation. Nevertheless, this study provides some additional insight into hypoxia-induced equilibrium impairment and may serve to lay the groundwork for additional research in this area.
Footnotes
Acknowledgments
We thank the study participants for their time and the Kinesiology and Health Science Department at Utah State University for the purchase of the hypoxic generator.
Author Disclosure Statement
No competing financial interests exist.