
Abstract

W
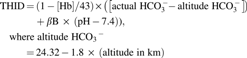
Using this formula, at an altitude of 2500, 3500, and 4500 m, the mean altitude HCO3− was 19.8, 18, and 16.2 mM, respectively (Paulev and Zubieta-Calleja, 2005), which were similar to our results (Ramirez-Sandoval et al., 2016).
Although the TIHD approach or an alternative approach as proposed by Stewart—also known as the “strong ion model”—is intellectually interesting, these approaches are not intuitive, require the use of charts or complex calculations for a busy clinician, and they do not outperform the traditional approach at the bedside (Rastegar, 2013).
In everyday practice, clinicians take decisions according to HCO3− or CO2 values and they should better make them with altitude expected values. For the majority of them, who diagnose acid–base disorders with the traditional approach, HCO3− concentration expected for altitude is very important and not misleading.
In reply to other comments, we acknowledge that all values presented in our tables, including those values near the summit of Everest, represent theoretical estimates calculated using two linear regression models and should be taken with caution; as it appears in table 5, empirical observations on the systematic review in nonacclimatized humans have reported a considerable variation in PCO2 values, for example, the PCO2 ± 2 standard deviation in 20 healthy subjects with acute exposure to 4120 m was between 19.3 and 30.1 mmHg (Wright et al., 2004). There is a clear need for further studies to clarify whether this is an inadequate ventilatory response to altitude as Zubieta-Calleja et al. have inquired in their letter. The slopes for change in pCO2 according to altitude were not statistically significant when we compare the theoretical model and the reported pCO2 values of the literature (data not shown in our article), but may be a problem related to the small amount of studies.
We discuss in our article that the use of total CO2 values may have differences as compared with the use of real HCO3− values; nevertheless, in clinical practice, total CO2 values are most often employed interchangeably with HCO3− values, especially in outpatient clinics, where blood gas analysis is not routinely used.
Finally, we would note that in the footnote of table 1, it is clearly indicated that “Lima is located on mostly flat terrain close to sea level, but the city has slopes into mountain that can be as 1550 m (5090 ft) above sea level,” all data of altitude were taken from United Nations Statistics Division (United Nations Demographic Year Book, 2013). We appreciate the note about the variation of altitude within the city of La Paz, Bolivia, which can be as high as 4100 m above sea level at “El Alto” and as low as 3600 m above sea level.
Footnotes
Author Disclosure Statement
No competing financial interests exist.