Rossetti, Gabriella M.K., Jamie H. Macdonald, Matthew Smith, Anna R. Jackson, Nigel Callender, Hannah K. Newcombe, Heather M. Storey, Sebastian Willis, Jojanneke van den Beukel, Jonathan Woodward, James Pollard, Benjamin Wood, Victoria Newton, Jana Virian, Owen Haswell, and Samuel J. Oliver. MEDEX2015: Greater sea-level fitness is associated with lower sense of effort during Himalayan trekking without worse acute mountain sickness. High Alt Med Biol. 18:152–162, 2017.—This study examined the complex relationships of fitness and hypoxic sensitivity with submaximal exercise responses and acute mountain sickness (AMS) at altitude. Determining these relationships is necessary before fitness or hypoxic sensitivity tests can be recommended to appraise individuals' readiness for altitude. Forty-four trekkers (26 men; 18 women; 20–67 years) completed a loaded walking test and a fitness questionnaire in normoxia to measure and estimate sea-level maximal aerobic capacity (maximum oxygen consumption [\documentclass{aastex}\usepackage{amsbsy}\usepackage{amsfonts}\usepackage{amssymb}\usepackage{bm}\usepackage{mathrsfs}\usepackage{pifont}\usepackage{stmaryrd}\usepackage{textcomp}\usepackage{portland, xspace}\usepackage{amsmath, amsxtra}\usepackage{upgreek}\pagestyle{empty}\DeclareMathSizes{10}{9}{7}{6}\begin{document}
$$\dot{{\rm V}}$$
\end{document}O2max]), respectively. Participants also completed a hypoxic exercise test to determine hypoxic sensitivity (cardiac, ventilatory, and arterial oxygen saturation responses to acute hypoxia, fraction of inspired oxygen [Fio2] = 0.112). One month later, all participants completed a 3-week trek to 5085 m with the same ascent profile. On ascent to 5085 m, ratings of perceived exertion (RPEascent), fatigue by Brunel Mood Scale, and AMS were recorded daily. At 5085 m, RPE during a fixed workload step test (RPEfixed) and step rate during perceptually regulated exercise (STEPRPE35) were recorded. Greater sea-level \documentclass{aastex}\usepackage{amsbsy}\usepackage{amsfonts}\usepackage{amssymb}\usepackage{bm}\usepackage{mathrsfs}\usepackage{pifont}\usepackage{stmaryrd}\usepackage{textcomp}\usepackage{portland, xspace}\usepackage{amsmath, amsxtra}\usepackage{upgreek}\pagestyle{empty}\DeclareMathSizes{10}{9}{7}{6}\begin{document}
$$\dot{{\rm V}}$$
\end{document}O2max was associated with, and predicted, lower sense of effort (RPEascent; r = −0.43; p < 0.001; RPEfixed; r = −0.69; p < 0.001) and higher step rate (STEPRPE35; r = 0.62; p < 0.01), but not worse AMS (r = 0.13; p = 0.4) or arterial oxygen desaturation (r = 0.07; p = 0.7). Lower RPEascent was also associated with better mood, including less fatigue (r = 0.57; p < 0.001). Hypoxic sensitivity was not associated with, and did not add to the prediction of submaximal exercise responses or AMS. In conclusion, participants with greater sea-level fitness reported less effort during simulated and actual trekking activities, had better mood (less fatigue), and chose a higher step rate during perceptually regulated exercise, but did not suffer from worse AMS or arterial oxygen desaturation. Simple sea-level fitness tests may be used to aid preparation for high-altitude travel.
Introduction
Many people travel to altitude for work and leisure, including trekkers, military personnel, and miners (Government of Nepal, 2013). As well as high-altitude illness, fatigue presents a major psychophysiological risk factor for summit failure, injury, and fatality at altitude (Firth et al., 2008; Oliver et al., 2012). Recent commentaries in this and other journals highlight the potential importance of adequate sea-level fitness to reduce fatigue and, therefore, enhance altitude exercise performance, including trekking times and summit success (Bärtsch and Swenson, 2013; Burtscher et al., 2015). However, the relationships between sea-level fitness, submaximal exercise responses at altitude, and acute mountain sickness (AMS) are complex (MacInnis et al., 2015), and as yet unknown.
Numerous studies indicate that individuals with high sea-level maximal aerobic capacity (maximum oxygen consumption [\documentclass{aastex}\usepackage{amsbsy}\usepackage{amsfonts}\usepackage{amssymb}\usepackage{bm}\usepackage{mathrsfs}\usepackage{pifont}\usepackage{stmaryrd}\usepackage{textcomp}\usepackage{portland, xspace}\usepackage{amsmath, amsxtra}\usepackage{upgreek}\pagestyle{empty}\DeclareMathSizes{10}{9}{7}{6}\begin{document}
$$\dot{{\rm V}}$$
\end{document}O2max]) have high altitude \documentclass{aastex}\usepackage{amsbsy}\usepackage{amsfonts}\usepackage{amssymb}\usepackage{bm}\usepackage{mathrsfs}\usepackage{pifont}\usepackage{stmaryrd}\usepackage{textcomp}\usepackage{portland, xspace}\usepackage{amsmath, amsxtra}\usepackage{upgreek}\pagestyle{empty}\DeclareMathSizes{10}{9}{7}{6}\begin{document}
$$\dot{{\rm V}}$$
\end{document}O2max (Fulco et al., 1998). Yet there is evidence that the absolute loss of \documentclass{aastex}\usepackage{amsbsy}\usepackage{amsfonts}\usepackage{amssymb}\usepackage{bm}\usepackage{mathrsfs}\usepackage{pifont}\usepackage{stmaryrd}\usepackage{textcomp}\usepackage{portland, xspace}\usepackage{amsmath, amsxtra}\usepackage{upgreek}\pagestyle{empty}\DeclareMathSizes{10}{9}{7}{6}\begin{document}
$$\dot{{\rm V}}$$
\end{document}O2max in high-fit individuals is greater at high altitudes than their less-fit counterparts (Ferretti et al., 1997; Marconi et al., 2004; Mollard et al., 2007). In fact, the decline in very high-fit individuals is so great at high altitude that their \documentclass{aastex}\usepackage{amsbsy}\usepackage{amsfonts}\usepackage{amssymb}\usepackage{bm}\usepackage{mathrsfs}\usepackage{pifont}\usepackage{stmaryrd}\usepackage{textcomp}\usepackage{portland, xspace}\usepackage{amsmath, amsxtra}\usepackage{upgreek}\pagestyle{empty}\DeclareMathSizes{10}{9}{7}{6}\begin{document}
$$\dot{{\rm V}}$$
\end{document}O2max is no different or even lower than their less-fit counterparts (MacInnis et al., 2015). Furthermore, it is often assumed that individuals with high sea-level \documentclass{aastex}\usepackage{amsbsy}\usepackage{amsfonts}\usepackage{amssymb}\usepackage{bm}\usepackage{mathrsfs}\usepackage{pifont}\usepackage{stmaryrd}\usepackage{textcomp}\usepackage{portland, xspace}\usepackage{amsmath, amsxtra}\usepackage{upgreek}\pagestyle{empty}\DeclareMathSizes{10}{9}{7}{6}\begin{document}
$$\dot{{\rm V}}$$
\end{document}O2max have greater exercise performance. However, \documentclass{aastex}\usepackage{amsbsy}\usepackage{amsfonts}\usepackage{amssymb}\usepackage{bm}\usepackage{mathrsfs}\usepackage{pifont}\usepackage{stmaryrd}\usepackage{textcomp}\usepackage{portland, xspace}\usepackage{amsmath, amsxtra}\usepackage{upgreek}\pagestyle{empty}\DeclareMathSizes{10}{9}{7}{6}\begin{document}
$$\dot{{\rm V}}$$
\end{document}O2max is not the only determinant of long-duration submaximal exercise responses, and other measures of fitness, such as fractional utilization of \documentclass{aastex}\usepackage{amsbsy}\usepackage{amsfonts}\usepackage{amssymb}\usepackage{bm}\usepackage{mathrsfs}\usepackage{pifont}\usepackage{stmaryrd}\usepackage{textcomp}\usepackage{portland, xspace}\usepackage{amsmath, amsxtra}\usepackage{upgreek}\pagestyle{empty}\DeclareMathSizes{10}{9}{7}{6}\begin{document}
$$\dot{{\rm V}}$$
\end{document}O2max (e.g., ventilatory threshold) and economy, are potentially as important (Coyle et al., 1988; Bassett and Howley, 2000). For trekking activities, which are typically submaximal, sense of effort during exercise (most often assessed by rating of perceived exertion; RPE) is also functionally important because it appraises the individual's comfort level. Sense of effort is also an essential component of general fatigue (Enoka and Stuart, 1992). Despite the well-documented relationship between fitness and exercise performance at sea level, the relationship between sea-level fitness and sense of effort during submaximal exercise at altitude is unclear.
Even if high sea-level fitness is associated with greater exercise capacity and reduced sense of effort, this may be at the cost of exacerbating AMS. Indeed, regular endurance training has been identified as a risk factor for altitude illness (Karinen et al., 2010; Richalet et al., 2012). A possible explanation for this is that fitter individuals experience greater arterial desaturation with acute hypoxia even during submaximal exercise (Lhuissier et al., 2012), which is likely a result of greater cardiac output (Richalet and Lhuissier, 2015), or an indirect effect of greater oxygen extraction in the muscle (Van Thienen and Hespel, 2016). Alternatively, worse AMS may occur because fitter individuals exercise at a greater intensity at altitude and/or gain altitude quicker. These arguments provide possible reasons for the common anecdotal field observation of poorer-than-expected exercise performance and AMS in high-fit persons at high altitudes. Despite the anecdotes and plausible physiological responses, evidence is lacking to explain the complex relationship between sea-level fitness, exercise, and AMS.
Some authors further advocate that hypoxic sensitivity is an important physiological factor determining altitude exercise performance (Schoene et al., 1984) and illness risk (Richalet and Canouï-Poitrine, 2014). This has led to the development of various resting and exercising hypoxic sensitivity tests to predict altitude exercise performance and illness susceptibility (Rathat et al., 1992; Lazio et al., 2010). However, these are not routinely implemented, perhaps due to a lack of clinically relevant discrimination at an individual level (Bärtsch, 2014), or due to their complexity and requirement for specialist equipment, including a method to simulate a high-altitude environment.
In summary, the relationships of fitness and hypoxic sensitivity with a sense of effort during submaximal exercise and AMS at altitude are complex and unknown. Determining these relationships is necessary before fitness or hypoxic sensitivity tests can be recommended to appraise individuals' readiness for altitude. Therefore, the first aim of this study was to explain the relationship of sea-level fitness with submaximal exercise responses (sense of effort during submaximal exercise and step rate during perceptually regulated exercise) and AMS during chronic altitude exposure. The second aim was to determine the utility of sea-level fitness (as assessed by \documentclass{aastex}\usepackage{amsbsy}\usepackage{amsfonts}\usepackage{amssymb}\usepackage{bm}\usepackage{mathrsfs}\usepackage{pifont}\usepackage{stmaryrd}\usepackage{textcomp}\usepackage{portland, xspace}\usepackage{amsmath, amsxtra}\usepackage{upgreek}\pagestyle{empty}\DeclareMathSizes{10}{9}{7}{6}\begin{document}
$$\dot{{\rm V}}$$
\end{document}O2max, ventilatory threshold, economy, and a simple questionnaire-based estimation of \documentclass{aastex}\usepackage{amsbsy}\usepackage{amsfonts}\usepackage{amssymb}\usepackage{bm}\usepackage{mathrsfs}\usepackage{pifont}\usepackage{stmaryrd}\usepackage{textcomp}\usepackage{portland, xspace}\usepackage{amsmath, amsxtra}\usepackage{upgreek}\pagestyle{empty}\DeclareMathSizes{10}{9}{7}{6}\begin{document}
$$\dot{{\rm V}}$$
\end{document}O2max) and hypoxic exercise testing to predict submaximal exercise responses and AMS at altitude. Finally, we aimed to determine whether physiological responses to hypoxia could explain the relationship between fitness and submaximal exercise responses. To this end, we assessed sea-level fitness and acute physiological responses to hypoxia (fraction of inspired oxygen [Fio2] = 0.112; equivalent 5000 m) 1 month before a 3-week trek to the Manaslu Circuit in the Nepal Himalaya. On the trek, sense of effort during submaximal exercise was assessed during simulated and actual trekking activities and physiological responses to chronic hypoxia were assessed at Base Camp (5058 m). AMS was assessed daily. We hypothesized that high sea-level fitness would be associated with submaximal exercise responses (lower sense of effort during submaximal exercise and higher step rate during perceptually regulated exercise) at altitude, without increased AMS. Second, we hypothesized that sea-level and hypoxic exercise tests would be significant predictors of submaximal exercise responses. Third, we hypothesized that hypoxic exercise tests would be significant predictors of AMS at altitude.
Materials and Methods
Participants and study design
Forty-four trekkers, 26 men and 18 women (mean [standard deviation, SD]: age 39 [14] years, body mass 69.0 [14.5] kg, height 172 [10] cm) from the MEDEX Manaslu trek volunteered for this observational cohort study. All participants were lowlanders, with an altitude of residence below 500 m. Forty-one participants (93%) had previously travelled to high altitude (>1500 m), and of these 41 participants, 32 (78%) reported previous AMS, one (2%) had a history of HACE, and none (0%) had a history of HAPE. Nine (20%) participants had a history of migraine (confirmed by a physician), three (7%) were smokers, and average alcohol consumption was 81.0 (63.4) g·week−1. Self-report physical activity was assessed on a scale developed by Jackson et al. (1990), which ranged from 0—Avoids walking or exercise (e.g., always uses elevators, drives whenever possible instead of walking), to 7—Runs more than 10 miles per week or spends more than 3 hours per week in comparable physical activity. Self-report physical activity ranged from 1 to 7, with mean of 5 (2), and \documentclass{aastex}\usepackage{amsbsy}\usepackage{amsfonts}\usepackage{amssymb}\usepackage{bm}\usepackage{mathrsfs}\usepackage{pifont}\usepackage{stmaryrd}\usepackage{textcomp}\usepackage{portland, xspace}\usepackage{amsmath, amsxtra}\usepackage{upgreek}\pagestyle{empty}\DeclareMathSizes{10}{9}{7}{6}\begin{document}
$$\dot{{\rm V}}$$
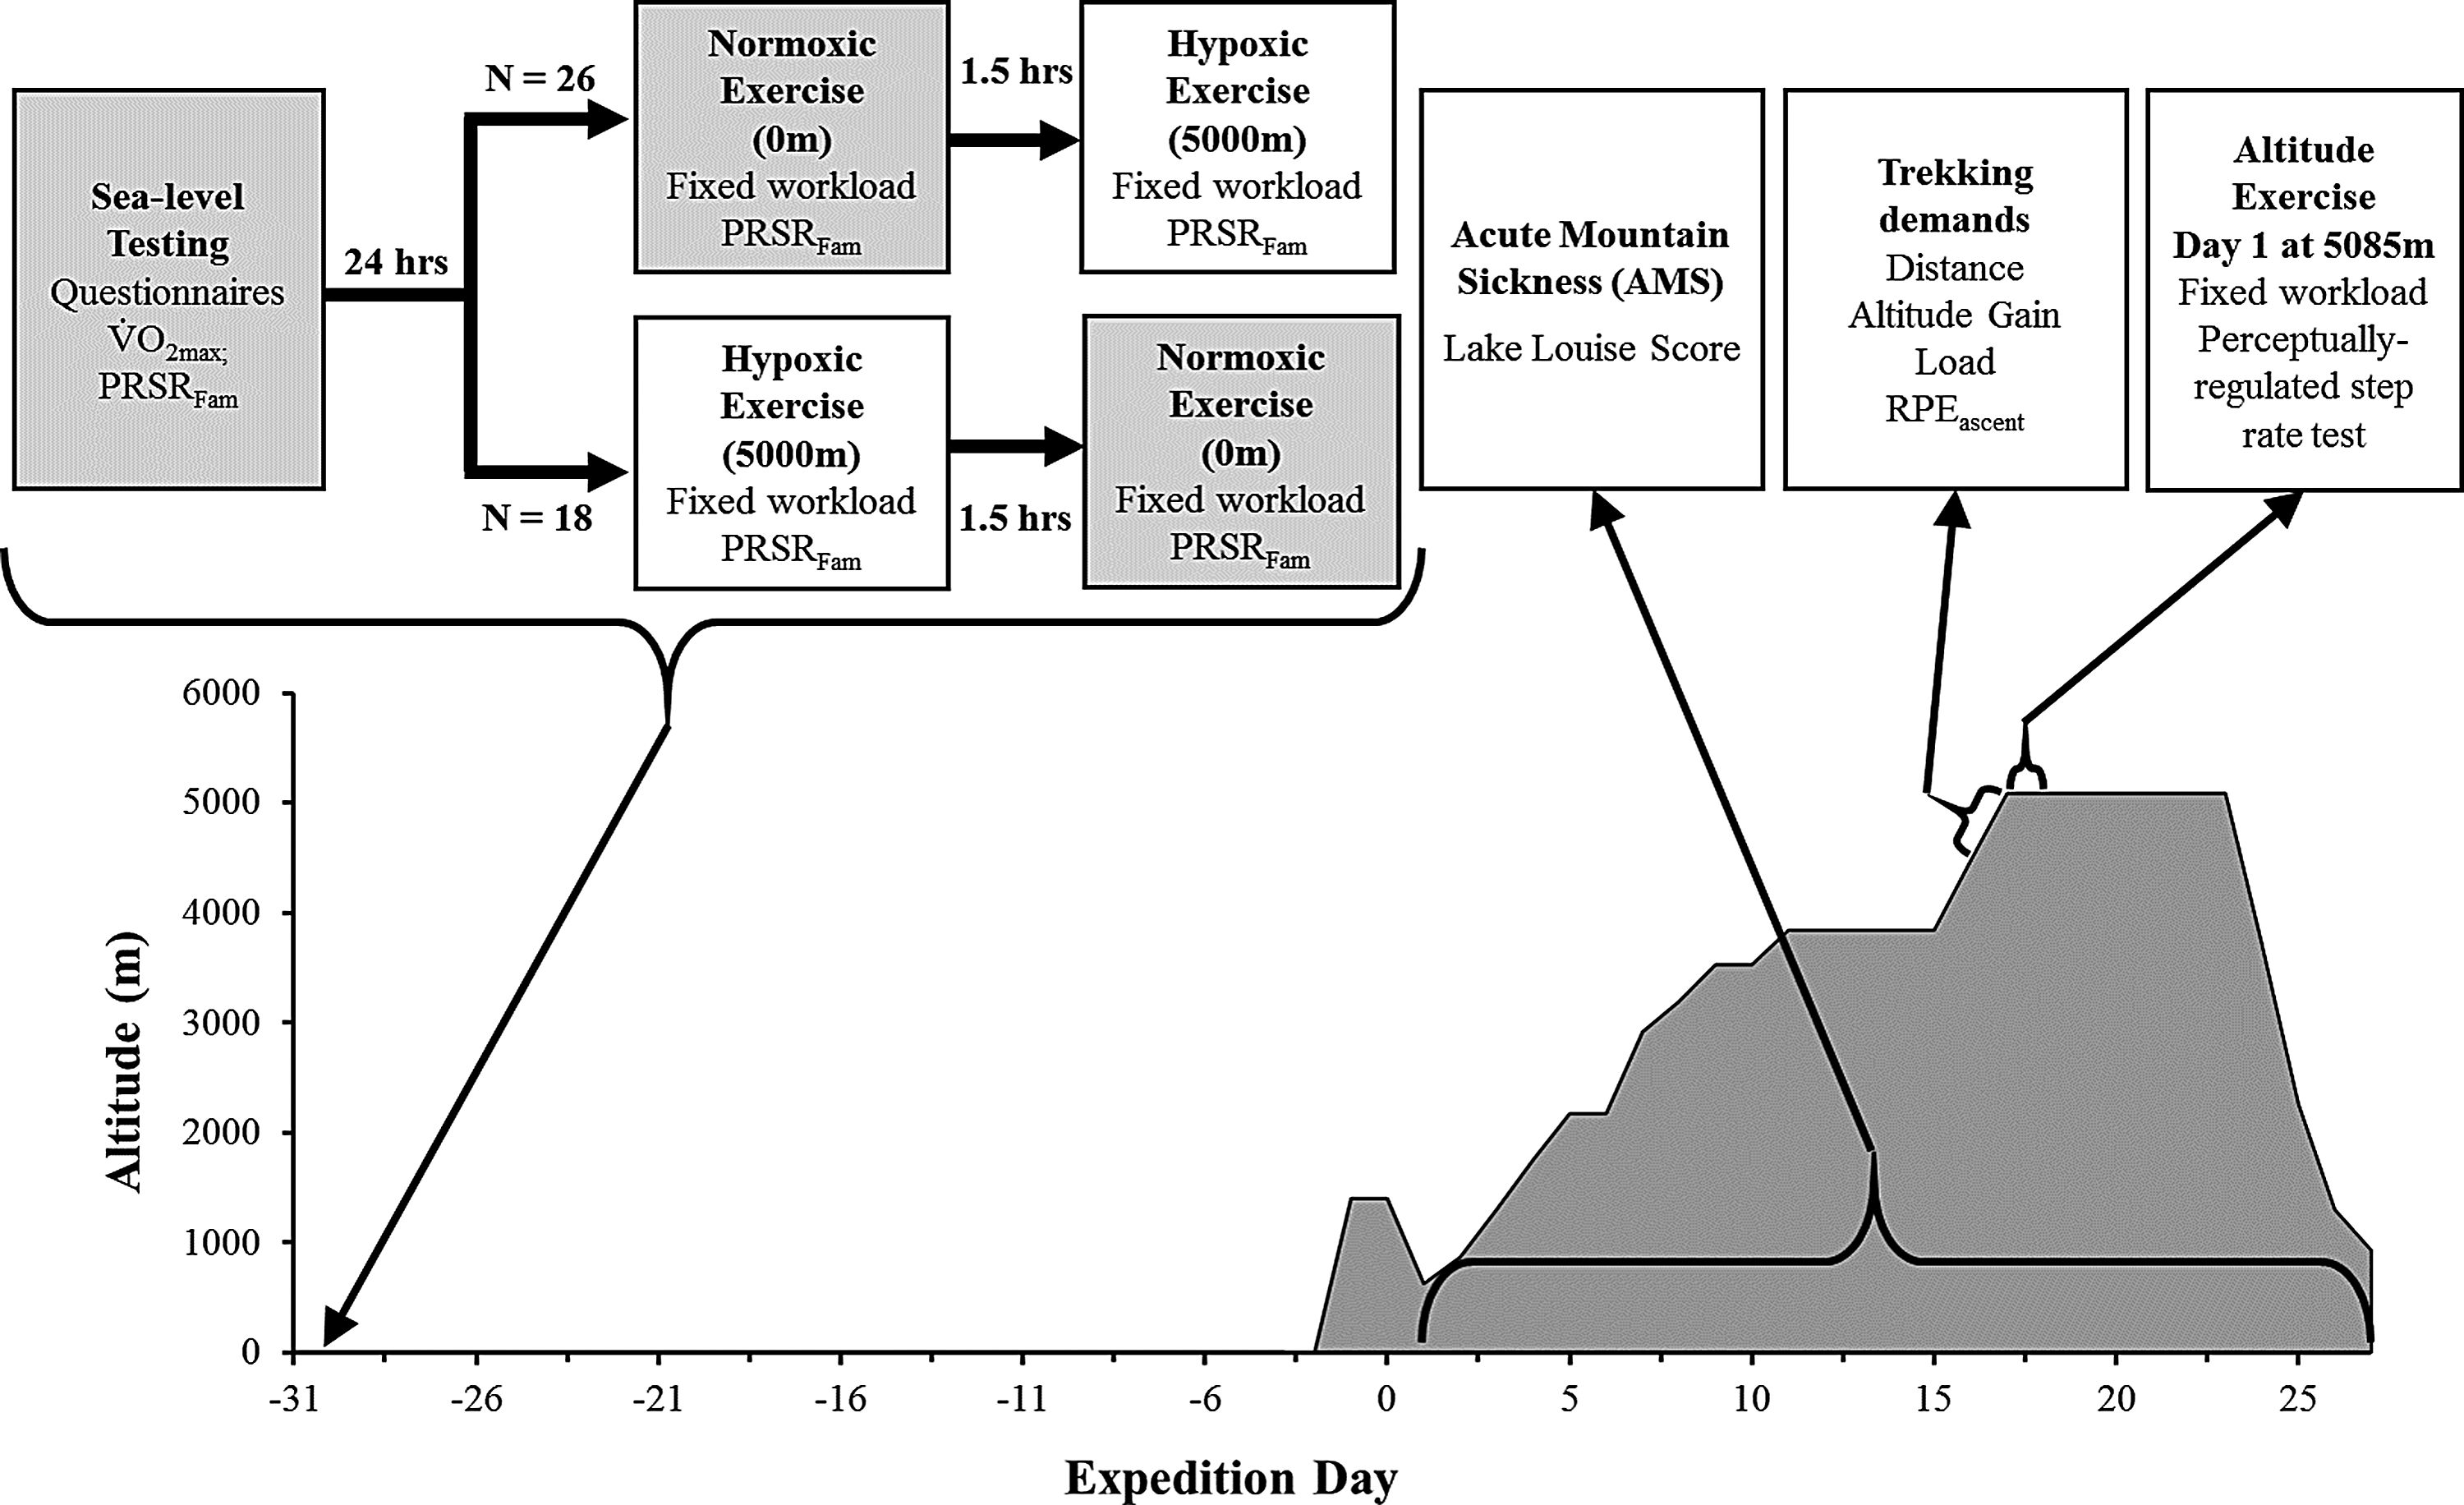
\end{document}O2max, ranged from 29 to 62 with mean 45 (8) mL·min−1·kg−1. The study received ethical approval from the North West Wales Research Ethics Committee and was conducted in accordance with the Declaration of Helsinki 2008. All volunteers provided written informed consent. Data were collected between February and April 2015. An overview of the study is depicted in Figure 1.
Schematic representation of study protocol. Gray boxes indicate procedures undertaken in normoxia, white boxes indicate procedures undertaken in hypoxia. LLS, Lake Louise Score; Load, external load for the trekking session (kg); PRSRFam, perceptually regulated step rate test familiarization; RPEascent, rating of perceived exertion on ascent to Base Camp.
Pretrek experimental procedures
One month before the trek, participants completed assessments of sea-level fitness and hypoxic sensitivity. Participants were asked to refrain from exhaustive exercise, caffeine, and alcohol for 12 hours before all tests.
Sea-level fitness (\documentclass{aastex}\usepackage{amsbsy}\usepackage{amsfonts}\usepackage{amssymb}\usepackage{bm}\usepackage{mathrsfs}\usepackage{pifont}\usepackage{stmaryrd}\usepackage{textcomp}\usepackage{portland, xspace}\usepackage{amsmath, amsxtra}\usepackage{upgreek}\pagestyle{empty}\DeclareMathSizes{10}{9}{7}{6}\begin{document}
$$\dot{{\rm V}}$$
\end{document}O2max, ventilatory threshold, and economy) was determined during a walking test to exhaustion on a motorized treadmill (H-P-Cosmos, Sports & Medical GmbH, Nussdorf, Germany) with simultaneous gas analysis (CORTEX Metalyzer, Biophysik GmbH, Leipzig, Germany). Participants wore a weighted rucksack (15 kg for men and 12.5 kg for women). The test consisted of 5 km·h−1 walking with a ramped increase in gradient from 5% to 25% over 18 minutes (1.11%·min−1), followed by a ramped increase in speed [0.67 km·h−1·min−1] thereafter. RPE was recorded each minute of the test using the Borg CR100 (Borg and Borg, 2001). \documentclass{aastex}\usepackage{amsbsy}\usepackage{amsfonts}\usepackage{amssymb}\usepackage{bm}\usepackage{mathrsfs}\usepackage{pifont}\usepackage{stmaryrd}\usepackage{textcomp}\usepackage{portland, xspace}\usepackage{amsmath, amsxtra}\usepackage{upgreek}\pagestyle{empty}\DeclareMathSizes{10}{9}{7}{6}\begin{document}
$$\dot{{\rm V}}$$
\end{document}O2max was identified by two or more of the following criteria (Pescatello et al., 2013): volitional fatigue, a plateau in \documentclass{aastex}\usepackage{amsbsy}\usepackage{amsfonts}\usepackage{amssymb}\usepackage{bm}\usepackage{mathrsfs}\usepackage{pifont}\usepackage{stmaryrd}\usepackage{textcomp}\usepackage{portland, xspace}\usepackage{amsmath, amsxtra}\usepackage{upgreek}\pagestyle{empty}\DeclareMathSizes{10}{9}{7}{6}\begin{document}
$$\dot{{\rm V}}$$
\end{document}O2 despite an increase in workload, respiratory exchange ratio ≥1.15, and heart rate ≥95% age-predicted heart rate maximum (220-age). \documentclass{aastex}\usepackage{amsbsy}\usepackage{amsfonts}\usepackage{amssymb}\usepackage{bm}\usepackage{mathrsfs}\usepackage{pifont}\usepackage{stmaryrd}\usepackage{textcomp}\usepackage{portland, xspace}\usepackage{amsmath, amsxtra}\usepackage{upgreek}\pagestyle{empty}\DeclareMathSizes{10}{9}{7}{6}\begin{document}
$$\dot{{\rm V}}$$
\end{document}O2max was also predicted using the equation provided in Matthews et al. (1999). Ventilatory threshold was determined using the method outlined by Gaskill et al. (2001) and economy as \documentclass{aastex}\usepackage{amsbsy}\usepackage{amsfonts}\usepackage{amssymb}\usepackage{bm}\usepackage{mathrsfs}\usepackage{pifont}\usepackage{stmaryrd}\usepackage{textcomp}\usepackage{portland, xspace}\usepackage{amsmath, amsxtra}\usepackage{upgreek}\pagestyle{empty}\DeclareMathSizes{10}{9}{7}{6}\begin{document}
$$\dot{{\rm V}}$$
\end{document}O2 [in ml·kg−1·min−1] at a gradient of 6%.
Hypoxic sensitivity was determined using a modified version of the Richalet test (Richalet et al., 2012; Canouï-Poitrine et al., 2014), with the exercise modality changed from cycling on an ergometer to stepping in time to a metronome, and the Fio2 chosen to match the specific demands of the expedition. Participants completed fixed-workload step tests in normoxia and hypoxia (Fio2 = 0.112; 5000 m). Step tests were conducted in an environmental chamber (Hypoxico, Inc.), separated by 1.5–3 hours. Each step test included 4 minutes 30 seconds of seated rest and 4 minutes 30 seconds of exercise. During the exercise, participants wore a 7 kg rucksack while stepping at 24 steps·min−1 on a 21 cm step. Ventilation (\documentclass{aastex}\usepackage{amsbsy}\usepackage{amsfonts}\usepackage{amssymb}\usepackage{bm}\usepackage{mathrsfs}\usepackage{pifont}\usepackage{stmaryrd}\usepackage{textcomp}\usepackage{portland, xspace}\usepackage{amsmath, amsxtra}\usepackage{upgreek}\pagestyle{empty}\DeclareMathSizes{10}{9}{7}{6}\begin{document}
$$\dot{{\rm V}}$$
\end{document}E) was determined by collection of expired gases (Douglas Bag System; Cranlea Ltd., Birmingham, United Kingdom) for the final minute of exercise, and oxygen saturation as measured by pulse oximetry (SpO2) and heart rate were measured by a pulse oximeter (9550 OnyxII; Nonin Medical, Inc.) and a heart rate monitor (RS800CX; Polar, Warwick, United Kingdom), and recorded in the final 30 seconds of exercise. RPE was recorded in the final 30 seconds for familiarization.
where SpO2, oxygen saturation; HR, heart rate; \documentclass{aastex}\usepackage{amsbsy}\usepackage{amsfonts}\usepackage{amssymb}\usepackage{bm}\usepackage{mathrsfs}\usepackage{pifont}\usepackage{stmaryrd}\usepackage{textcomp}\usepackage{portland, xspace}\usepackage{amsmath, amsxtra}\usepackage{upgreek}\pagestyle{empty}\DeclareMathSizes{10}{9}{7}{6}\begin{document}
$$\dot{{\rm V}}$$
\end{document}E, minute ventilation (L·min); EH, exercise in hypoxia (baseline); EN, exercise in normoxia (baseline); and BM, body mass (kg).
Trek experimental procedures
Participants arrived in Kathmandu (1300 m) and were transported to Arughat (518 m) by bus to begin the trek. The 44 participants travelled in five groups of mixed age, sex, and sea-level fitness. Each group completed the Manaslu trekking itinerary and, therefore, the same altitude profile, an ascent profile that is typical of other high-altitude treks (e.g., Dhaulagiri circuit). The ascent profile included 4 days trekking above 3000 m, with 2 days of ∼300 m ascent per day, and 2 days with ∼600 m ascent per day. They all completed the ascent to Base Camp (5085 m) in 15–17 days trekking. This variation in ascent was due to limited overnight accommodation at some locations. Participants abstained from prophylactic medication, and all other medications taken were recorded, but not restricted.
Trekking demands
On each day of the trek physical and physiological demands were assessed, but for the benefit of clarity only data from the final day of trekking on ascent to Base Camp are presented. To assess physical demands, after breakfast, body mass was assessed by weighing participants in base layers using mechanical scales (Salter Housewares, Kent, United Kingdom); loaded weight was assessed by weighing participants in full trekking attire, including boots and rucksack; and external weight was calculated by subtracting the body mass from the loaded mass. Participants were able to walk at their chosen pace and the start and end times of each individual's trekking day was recorded. The trekking route was tracked using a global satellite positioning system (GPS; inReach SE; Delorme, Yarmouth, ME). Energy expenditure (EE) was then calculated using an equation validated previously (Pandolf et al., 1977). Relative trekking intensity for the ascent to Base Camp was calculated as:
\documentclass{aastex}\usepackage{amsbsy}\usepackage{amsfonts}\usepackage{amssymb}\usepackage{bm}\usepackage{mathrsfs}\usepackage{pifont}\usepackage{stmaryrd}\usepackage{textcomp}\usepackage{portland, xspace}\usepackage{amsmath, amsxtra}\usepackage{upgreek}\pagestyle{empty}\DeclareMathSizes{10}{9}{7}{6}\begin{document}
\begin{align*}
{ \rm{Relative}} \;{ \rm{trekking}} \;{ \rm{intensity}}\; = \;{ \rm{RP}}{{ \rm{E}}_{{ \rm{ascent}}}} / { \rm{EE}} \ \left( {{ \rm{kJ^{- 1}}} \cdot { \rm{min^{- 1}}}} \right) ,
\end{align*}
\end{document}
where RPEascent, Session RPE (Fanchini et al., 2016) recorded 30 minutes after trekkers completed 6.3 km walking exercise from 4472 to 5085 m; EE, energy expenditure (calculated from the equation provided in Pandolf et al., 1977).
To assess physiological demands, participants wore heart rate monitors (RS800CX; Polar) throughout the day's trek, and heart rate was averaged for the trekking session.
Sense of effort during submaximal exercise
To determine the relationship between sea-level fitness and sense of effort during submaximal exercise at altitude, we assessed sense of effort during submaximal exercise by recording RPE. RPE was recorded using the Borg CR100 (Borg and Borg, 2001), which asks participants to rate the intensity of the exercise sensation using numbers from 0 to 100+ and verbal descriptors (e.g., “moderate,” equivalent to 25). Extensive evidence supports the use of RPE as a valid and appropriate method to record sense of effort and perceptual responses to exercise (Eston, 2012). Sense of effort was determined from session RPE (Fanchini et al., 2016) recorded 30 minutes after trekkers completed 6.3 km walking exercise from 4472 to 5085 m (RPEascent). Session RPE has been validated as a quantitative measure of exercise load (Foster et al., 2001). Participants also completed the Brunel Mood Scale (BRUMS; Terry et al., 1999) on arrival at Base Camp to determine the psychological effects of the exercise, including self-reported fatigue. To further determine sense of effort during submaximal exercise at altitude, all participants completed the fixed-workload step test the day after arriving at 5085 m (day 16–18 of the expedition), breathing altitude ambient air (549 [1] mbar), but otherwise using the same protocol as completed at sea level. Specifically, participants wore a 7 kg rucksack while stepping at 24 steps·min−1 on a 21 cm step. The primary outcome variable for this test was RPE at 4 minutes 30 seconds of stepping (RPEfixed). In addition, SpO2, heart rate, and minute ventilation (\documentclass{aastex}\usepackage{amsbsy}\usepackage{amsfonts}\usepackage{amssymb}\usepackage{bm}\usepackage{mathrsfs}\usepackage{pifont}\usepackage{stmaryrd}\usepackage{textcomp}\usepackage{portland, xspace}\usepackage{amsmath, amsxtra}\usepackage{upgreek}\pagestyle{empty}\DeclareMathSizes{10}{9}{7}{6}\begin{document}
$$\dot{{\rm V}}$$
\end{document}E) were determined using methods as described for the sea-level step tests. Exercise ventilation reserve and ventilatory efficiency were calculated using equations adapted from Bernardi et al. (2006):
\documentclass{aastex}\usepackage{amsbsy}\usepackage{amsfonts}\usepackage{amssymb}\usepackage{bm}\usepackage{mathrsfs}\usepackage{pifont}\usepackage{stmaryrd}\usepackage{textcomp}\usepackage{portland, xspace}\usepackage{amsmath, amsxtra}\usepackage{upgreek}\pagestyle{empty}\DeclareMathSizes{10}{9}{7}{6}\begin{document}
\begin{align*}
& {\rm {Exercise}} \;{ \rm{ventilation}} \;{ \rm{reserve}} \;
\left( \% \right) \;
\\ & \quad = \; ( [ { {\rm \dot{V}}{{ \rm{E}}_{{
\rm{max}}}} - { {\rm \dot{V}}{{ \rm{E}}_{{ \rm{alt}}}} }}] / {
{\rm \dot{V}}{{ \rm{E}}_{{\rm{max}}}}} ) \times 100
\end{align*}
\end{document}\documentclass{aastex}\usepackage{amsbsy}\usepackage{amsfonts}\usepackage{amssymb}\usepackage{bm}\usepackage{mathrsfs}\usepackage{pifont}\usepackage{stmaryrd}\usepackage{textcomp}\usepackage{portland, xspace}\usepackage{amsmath, amsxtra}\usepackage{upgreek}\pagestyle{empty}\DeclareMathSizes{10}{9}{7}{6}\begin{document}
\begin{align*}
{ \rm{Ventilatory}} \;{ \rm{efficiency }} \ ( \% \cdot {{
\rm{L}}^{ - 1}} \cdot{ \rm{mi}}{{ \rm{n}}^{ - 1}} ) \; = { \rm{
\;Sp}}{{ \rm{O}}_2} / { {\rm \dot{V}}{{ \rm{E}}_{{ \rm{alt}}}}}
\end{align*}
\end{document}
where \documentclass{aastex}\usepackage{amsbsy}\usepackage{amsfonts}\usepackage{amssymb}\usepackage{bm}\usepackage{mathrsfs}\usepackage{pifont}\usepackage{stmaryrd}\usepackage{textcomp}\usepackage{portland, xspace}\usepackage{amsmath, amsxtra}\usepackage{upgreek}\pagestyle{empty}\DeclareMathSizes{10}{9}{7}{6}\begin{document}
$$\dot{{\rm V}}{\rm E}_{\rm max}$$
\end{document}, maximal exercising ventilation from sea-level \documentclass{aastex}\usepackage{amsbsy}\usepackage{amsfonts}\usepackage{amssymb}\usepackage{bm}\usepackage{mathrsfs}\usepackage{pifont}\usepackage{stmaryrd}\usepackage{textcomp}\usepackage{portland, xspace}\usepackage{amsmath, amsxtra}\usepackage{upgreek}\pagestyle{empty}\DeclareMathSizes{10}{9}{7}{6}\begin{document}
$$\dot{{\rm V}}{\rm O}_{ 2 \rm max}$$
\end{document} test; \documentclass{aastex}\usepackage{amsbsy}\usepackage{amsfonts}\usepackage{amssymb}\usepackage{bm}\usepackage{mathrsfs}\usepackage{pifont}\usepackage{stmaryrd}\usepackage{textcomp}\usepackage{portland, xspace}\usepackage{amsmath, amsxtra}\usepackage{upgreek}\pagestyle{empty}\DeclareMathSizes{10}{9}{7}{6}\begin{document}
$$\dot{{\rm V}}$$
\end{document}Ealt, exercising ventilation during fixed-workload step test at altitude; and SpO2, oxygen saturation during fixed-workload step test at altitude.
where HREN, heart rate during fixed-workload exercise in normoxia (baseline); and HREA, heart rate during fixed-workload step test at altitude (Base Camp, 5085 m).
Immediately after the fixed-workload step test, submaximal exercise capacity was determined by assessing step rate during perceptually regulated exercise (STEPRPE35). This perceptually regulated step rate test provided assessment of exercise production at a relative workload. Clamping RPE to produce self-paced exercise in this manner is a validated tool for determining functional and endurance exercise capacity (Eston, 2012; Coquart et al., 2016). Each participant was asked to complete stepping exercise for 4 minutes at a step rate that was equivalent to an RPE of 35 (described on the RPE scale as “somewhat strong”). An RPE of 35 was chosen because it has been previously reported as the typical sensed effort of mountain walkers and workers (Ainslie et al., 2002; Callender et al., 2012). During this exercise, participants were free to alter their step rate. In the final minute, step rate (STEPRPE35), HR, and SpO2 were recorded. For the purpose of familiarization, participants completed three practice trials (two in normoxia, one in acute hypoxia) that included familiarization with the CR100 scale and completing the entire stepping exercise. In a separate pilot study (n = 6), we showed that with three practice sessions this perceptually regulated step rate test has good reliability, with intraclass correlation coefficient of 0.94, coefficient of variation of 2.4%, and limits of agreement bias and 95% confidence intervals (lower limit; upper limit) of 1.0 (−1.5; 3.5) steps·min−1. The perceptually regulated step rate test also has good face validity, with trekkers and expedition leaders reporting that it was representative of their normal trekking pace.
Both step tests were repeated 2 days later (on the 3rd day at Base Camp), in a sub-sample of 21 participants. The sub-sample was representative of whole study sample, with no difference in age, height, body mass, \documentclass{aastex}\usepackage{amsbsy}\usepackage{amsfonts}\usepackage{amssymb}\usepackage{bm}\usepackage{mathrsfs}\usepackage{pifont}\usepackage{stmaryrd}\usepackage{textcomp}\usepackage{portland, xspace}\usepackage{amsmath, amsxtra}\usepackage{upgreek}\pagestyle{empty}\DeclareMathSizes{10}{9}{7}{6}\begin{document}
$$\dot{{\rm V}}$$
\end{document}O2max, or sex ratio (all p ≥ 0.5).
Acute mountain sickness
Each morning on the trek, participants recorded AMS symptoms using the Lake Louise Score (LLS; Roach et al., 1993) under the supervision of a researcher. From these symptoms, clinically defined AMS was identified when the participant was higher than 2500 m, LLS total exceeded three or more, and headache with at least one other symptom was present. An individual with AMS at any point over the expedition was classified as AMS susceptible (AMS+); and individuals without AMS over the expedition were classified as AMS resistant (AMS−). Percentage of days with AMS and peak LLS were also calculated.
Statistical analysis
The primary independent variable of fitness was sea-level \documentclass{aastex}\usepackage{amsbsy}\usepackage{amsfonts}\usepackage{amssymb}\usepackage{bm}\usepackage{mathrsfs}\usepackage{pifont}\usepackage{stmaryrd}\usepackage{textcomp}\usepackage{portland, xspace}\usepackage{amsmath, amsxtra}\usepackage{upgreek}\pagestyle{empty}\DeclareMathSizes{10}{9}{7}{6}\begin{document}
$$\dot{{\rm V}}$$
\end{document}O2max (extensive exploratory analyses revealed no additional benefit of the fitness variables ventilatory threshold or economy). The primary outcome variable of sense of effort during submaximal exercise was RPE recorded during the fixed workload test performed at high altitude (RPEfixed).
To determine the relationships between sea-level fitness with (1) submaximal exercise responses at altitude (RPEfixed, RPEascent, and STEPRPE35); (2) acute physiological responses to hypoxia (HVRe, HCRe, ΔSpO2e); (3) chronic physiological responses to hypoxia (exercise ventilation reserve, ventilatory efficiency, chronic change in heart rate, and SpO2 at altitude); (4) the percentage of trekking days with AMS, and peak AMS score, Pearson's correlations were used. For all correlational analyses, the strength of a relationship was determined by the r value.
To determine whether hypoxic exercise testing significantly adds to sea-level fitness testing to predict sense of effort during submaximal exercise at altitude and AMS, hierarchical regression was used and r2 change was reported. To determine the utility of \documentclass{aastex}\usepackage{amsbsy}\usepackage{amsfonts}\usepackage{amssymb}\usepackage{bm}\usepackage{mathrsfs}\usepackage{pifont}\usepackage{stmaryrd}\usepackage{textcomp}\usepackage{portland, xspace}\usepackage{amsmath, amsxtra}\usepackage{upgreek}\pagestyle{empty}\DeclareMathSizes{10}{9}{7}{6}\begin{document}
$$\dot{{\rm V}}$$
\end{document}O2max and hypoxic sensitivity for predicting AMS susceptibility, Receiver Operating Characteristic curves were calculated and comparison of area under the curves (AUC) was completed.
To investigate whether classical physiological responses to hypoxia mechanistically explain the relationship between fitness and sense of effort during submaximal exercise at altitude, ventilatory and cardiac responses to acute normobaric hypoxia (HVRe, HCRe) and chronic high-altitude exposure (chronic change in heart rate, exercise ventilation reserve, ventilatory efficiency), were investigated using a mediation analysis. Analysis was completed using the SPSS macro PROCESS (Hayes, 2013) with 5000 bootstrap samples. An indirect effect (evidence of a mechanistic explanation) was deemed significant if the upper and lower 95% confidence interval limits of the size of the indirect path did not include zero.
A sample size estimation for the correlation between sea-level \documentclass{aastex}\usepackage{amsbsy}\usepackage{amsfonts}\usepackage{amssymb}\usepackage{bm}\usepackage{mathrsfs}\usepackage{pifont}\usepackage{stmaryrd}\usepackage{textcomp}\usepackage{portland, xspace}\usepackage{amsmath, amsxtra}\usepackage{upgreek}\pagestyle{empty}\DeclareMathSizes{10}{9}{7}{6}\begin{document}
$$\dot{{\rm V}}$$
\end{document}O2max and RPEfixed indicated that 37 participants would be needed to produce a 90% chance of obtaining statistical significance at the 0.05 level for a minimum important effect size of r = 0.5 (Bland, 2015).
Diagnostic accuracy analyses were completed using MedCalc version 15.8 (MedCalc Software, Ostend, Belgium), all other analyses were completed using SPSS version 22 (IBM Corp, Armonk, NY). Statistical significance was set at p < 0.05 for all analyses.
Results
Trekking demands
Physiological and perceptual responses to the submaximal step tests are shown in Table 1. Physical, physiological, and perceptual demands of the final day's trek into Base Camp are shown in Table 2. The trekkers took 262 (52) minutes to complete the 6.3 km trek with 613 m altitude gain from 4472 to 5085 m.
Physiological and Perceptual Responses to Step Tests
Conducted as familiarization trials, but data included here for completeness.
By design, values are the same in all participants for this variable.
RPE, ratings of perceived exertion; SD, standard deviation; SpO2, oxygen saturation as measured by pulse oximetry.
Summary of Trekking Demands and Relationship to Sea Level \documentclass{aastex}\usepackage{amsbsy}\usepackage{amsfonts}\usepackage{amssymb}\usepackage{bm}\usepackage{mathrsfs}\usepackage{pifont}\usepackage{stmaryrd}\usepackage{textcomp}\usepackage{portland, xspace}\usepackage{amsmath, amsxtra}\usepackage{upgreek}\pagestyle{empty}\DeclareMathSizes{10}{9}{7}{6}\begin{document}
$$\dot{{\rm V}}$$
\end{document}O2max
Relationship to \documentclass{aastex}\usepackage{amsbsy}\usepackage{amsfonts}\usepackage{amssymb}\usepackage{bm}\usepackage{mathrsfs}\usepackage{pifont}\usepackage{stmaryrd}\usepackage{textcomp}\usepackage{portland, xspace}\usepackage{amsmath, amsxtra}\usepackage{upgreek}\pagestyle{empty}\DeclareMathSizes{10}{9}{7}{6}\begin{document}
$$\dot{{V}}$$
\end{document}O2max
\documentclass{aastex}\usepackage{amsbsy}\usepackage{amsfonts}\usepackage{amssymb}\usepackage{bm}\usepackage{mathrsfs}\usepackage{pifont}\usepackage{stmaryrd}\usepackage{textcomp}\usepackage{portland, xspace}\usepackage{amsmath, amsxtra}\usepackage{upgreek}\pagestyle{empty}\DeclareMathSizes{10}{9}{7}{6}\begin{document}
$$\dot{{\rm V}}$$
\end{document}O2max, maximum oxygen consumption.
Sea-level fitness and submaximal exercise responses at altitude
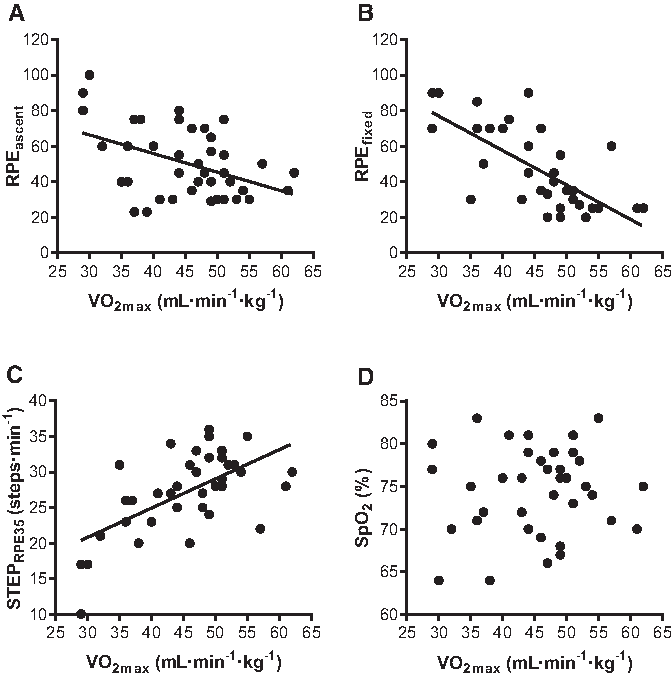
Greater sea-level fitness was associated with lower sense of effort (RPEfixed and RPEascent) and higher step rate (STEPRPE35) at altitude (Fig. 2). Ascent time to Base Camp was not related to fitness (r = −0.11; p = 0.48; Table 2). Therefore, fitter persons ascended with less sensed effort (lower RPE), but a similar walking speed compared with their less-fit counterparts. Lower RPEascent was also associated with less negative mood (total mood disturbance; r = 0.50; p = 0.001), specifically less fatigue (r = 0.57; p < 0.001), tension (r = 0.40; p = 0.01), and confusion (r = 0.35; p = 0.03). Lower RPEascent was also associated with increased vigor, although weakly (r = −0.28; p = 0.09). Lower sense of effort and higher step rate in fitter individuals did not come at the cost of worse arterial oxygen saturation: sea-level \documentclass{aastex}\usepackage{amsbsy}\usepackage{amsfonts}\usepackage{amssymb}\usepackage{bm}\usepackage{mathrsfs}\usepackage{pifont}\usepackage{stmaryrd}\usepackage{textcomp}\usepackage{portland, xspace}\usepackage{amsmath, amsxtra}\usepackage{upgreek}\pagestyle{empty}\DeclareMathSizes{10}{9}{7}{6}\begin{document}
$$\dot{{\rm V}}$$
\end{document}O2max was not related to SpO2 during the fixed-workload (r = 0.07; p = 0.67) or perceptually regulated (r = 0.16; p = 0.33) step tests at altitude.
Relationship between sea-level fitness (\documentclass{aastex}\usepackage{amsbsy}\usepackage{amsfonts}\usepackage{amssymb}\usepackage{bm}\usepackage{mathrsfs}\usepackage{pifont}\usepackage{stmaryrd}\usepackage{textcomp}\usepackage{portland, xspace}\usepackage{amsmath, amsxtra}\usepackage{upgreek}\pagestyle{empty}\DeclareMathSizes{10}{9}{7}{6}\begin{document}
$$\dot{{\rm V}}$$
\end{document}O2max) and submaximal exercise at altitude. Greater sea-level fitness was associated with (A) reduced session RPE from ascent to Base Camp (RPEascent; r = −0.43; p = 0.005), (B) reduced RPE at a fixed workload (RPEfixed; r = −0.69; p < 0.001), and (C) greater step rate during perceptually regulated exercise (STEPRPE35; r = 0.62; p < 0.001). Sea-level fitness was not related to (D) oxygen saturation during fixed-workload step test at altitude (SpO2; r = 0.07; p = 0.67). SpO2, oxygen saturation as measured by pulse oximetry; \documentclass{aastex}\usepackage{amsbsy}\usepackage{amsfonts}\usepackage{amssymb}\usepackage{bm}\usepackage{mathrsfs}\usepackage{pifont}\usepackage{stmaryrd}\usepackage{textcomp}\usepackage{portland, xspace}\usepackage{amsmath, amsxtra}\usepackage{upgreek}\pagestyle{empty}\DeclareMathSizes{10}{9}{7}{6}\begin{document}
$$\dot{{\rm V}}$$
\end{document}O2max, maximum oxygen consumption.
Acute mountain sickness
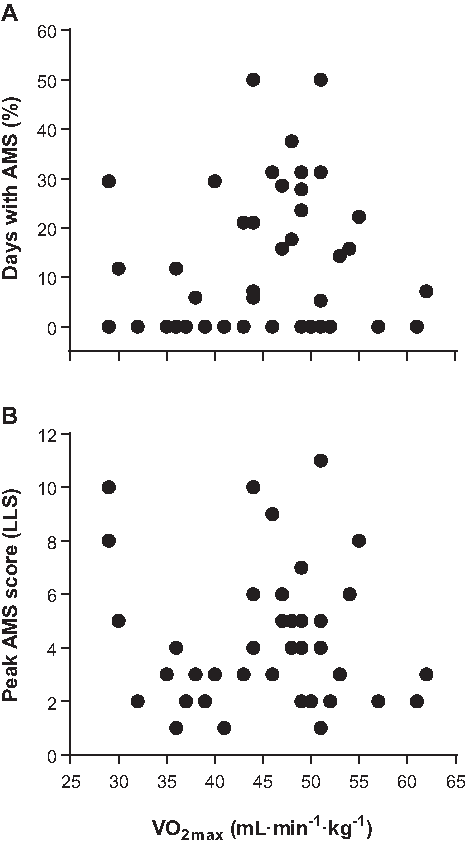
Twenty-five participants (61%) had clinically defined AMS at least once during the expedition. Of those with AMS, it lasted 4 (2) days. The highest incidence of AMS for a given day was 47%, occurring on day 1 at Base Camp (5085 m). AMS was not related to any sea-level assessment variables. None of sea-level fitness, hypoxic sensitivity, or physiological responses to chronic hypoxia was related to AMS susceptibility, percentage of days with AMS, or peak LLS (r = 0.05–0.26; p = 0.12–0.91; Fig. 3). AUC were all below 0.70, indicating poor diagnostic accuracy for all methods. Two (5%) participants took acetazolamide in the treatment of AMS for 1 and 8 days each, while 30 (68%) participants took some form of analgesic medication, with 2.2 (1.9) days spent on analgesics across the whole sample. There was no relationship between fitness and number of days on acetazolamide (r = −0.08; p = 0.60) or analgesic medications (r = 0.20; p = 0.22).
Sea-level fitness (\documentclass{aastex}\usepackage{amsbsy}\usepackage{amsfonts}\usepackage{amssymb}\usepackage{bm}\usepackage{mathrsfs}\usepackage{pifont}\usepackage{stmaryrd}\usepackage{textcomp}\usepackage{portland, xspace}\usepackage{amsmath, amsxtra}\usepackage{upgreek}\pagestyle{empty}\DeclareMathSizes{10}{9}{7}{6}\begin{document}
$$\dot{{\rm V}}$$
\end{document}O2max) was not related to (A) percent of trekking days with clinically defined AMS (r = 0.13; p = 0.41), or (B) peak AMS score (r = −0.05; p = 0.74). AMS, acute mountain sickness.
Acclimatization, sea-level fitness, and submaximal exercise responses at altitude
In a sub-sample, the step tests were repeated on day 3 after participants' AMS symptoms had reduced (LLS decreased from 3.3 [2.5] to 2.1 [2.1]; p = 0.06), and sense of effort during submaximal exercise had decreased across the sub-sample (RPEfixed decreased from 57 [31] on day 1, to 44 [19] on day 3; p < 0.01). Submaximal step rate during perceptually regulated exercise increased (STEPRPE35 increased from 26 [6] on day 1, to 28 [5] on day 3; p < 0.01). These adaptive changes (representative of enhanced acclimatization) did not affect the relationship between fitness and submaximal exercise responses, which were consistent with those observed on day 1. Greater sea-level fitness was associated with lower RPEfixed on day 3 (r = −0.75; p < 0.001) and greater STEPRPE35 on day 3 (r = 0.70; p = 0.001), and was not related to SpO2 during the fixed workload (r = 0.26; p = 0.28). Greater sea-level fitness tended to be associated with greater SpO2 during the perceptually regulated step test (r = 0.43; p = 0.058), despite participants producing a higher absolute workload.
Physiological mechanisms
Hypoxic sensitivity and submaximal exercise responses at altitude
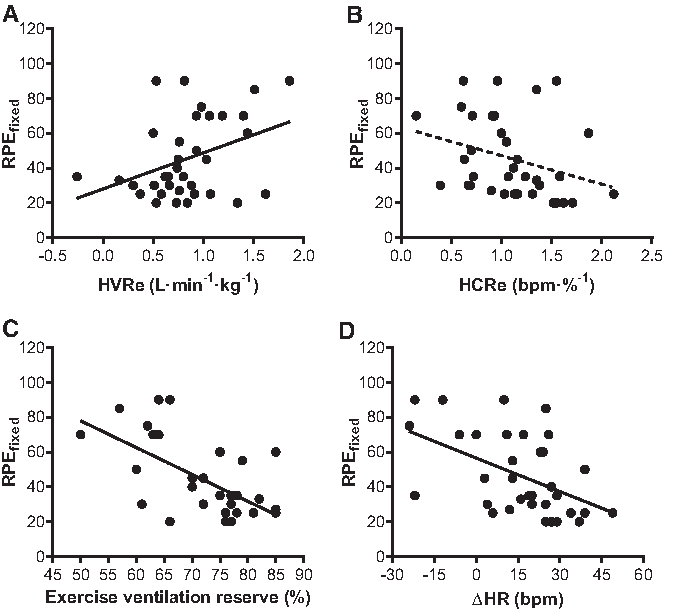
Individuals with lower HVRe (Fig. 4A) and higher HCRe (Fig. 4B) had lower sense of effort compared with their counterparts. HVRe was positively related to RPEfixed (r = 0.38; p = 0.02), and negatively related to STEPRPE35 (r = −0.39; p = 0.02). There was a weak negative relationship between HCRe and RPEfixed, (r = −0.31; p = 0.07), but HCRe was not related to STEPRPE35 (r = 0.19; p = 0.26). ΔSpO2e was not related to any measure of sense of effort at altitude (r = 0.23–0.25; p = 0.15–0.17).
Relationships between ventilatory and cardiac responses to acute and chronic high altitude with sense of effort at altitude (RPEfixed). Reduced RPEfixed was associated with (A) reduced hypoxic ventilatory response (HVRe; r = 0.38; p = 0.02), (B) elevated hypoxic cardiac response (HCRe; r = −0.31; p = 0.07), (C) elevated exercise ventilation reserve at altitude (r = −0.60; p < 0.001), and (D) elevated chronic change in heart rate (r = −0.49; p = 0.003).
Physiological responses to chronic high altitude
Individuals with less ventilatory stress at altitude (Fig. 4C) and a greater cardiac response to chronic high altitude (Fig. 4D) had lower sense of effort compared with their counterparts. Greater exercise ventilation reserve was associated with lower RPEfixed (r = −0.61; p < 0.001) and superior STEPRPE35 (r = 0.44; p = 0.01). Greater ventilatory efficiency was associated with lower RPEfixed (r = −0.44; p = 0.01) and superior STEPRPE35 (r = 0.44; p < 0.001). A larger chronic change in heart rate was associated with lower RPEfixed (r = −0.49; p < 0.01) and superior STEPRPE35 (r = 0.41; p = 0.01).
Mediation analysis
Cardiac parameters tended to explain (negatively mediate) the relationship between sea-level fitness and submaximal exercise sense of effort at altitude (Table 3). Hypoxic exercise ventilation reserve also tended to explain (positively mediate) the relationship between sea-level fitness and submaximal exercise sense of effort at altitude. In contrast, exercise ventilation reserve and ventilatory efficiency did not mediate the relationship between sea-level fitness and sense of effort during submaximal exercise at altitude.
Mediation Analysis Summary for Acute Normobaric Hypoxia and Chronic High-Altitude Cardiac and Ventilatory Parameters
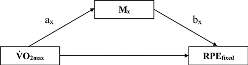
If a variable Mx explains (mediates) the relationship between \documentclass{aastex}\usepackage{amsbsy}\usepackage{amsfonts}\usepackage{amssymb}\usepackage{bm}\usepackage{mathrsfs}\usepackage{pifont}\usepackage{stmaryrd}\usepackage{textcomp}\usepackage{portland, xspace}\usepackage{amsmath, amsxtra}\usepackage{upgreek}\pagestyle{empty}\DeclareMathSizes{10}{9}{7}{6}\begin{document}
$$\dot{{\rm V}}$$
\end{document}O2max and RPEfixed, the indirect effect (abx) should not span zero. The values suggest that HCRe and chronic change in heart rate tended or did significantly explain (positively mediate) the relationship between \documentclass{aastex}\usepackage{amsbsy}\usepackage{amsfonts}\usepackage{amssymb}\usepackage{bm}\usepackage{mathrsfs}\usepackage{pifont}\usepackage{stmaryrd}\usepackage{textcomp}\usepackage{portland, xspace}\usepackage{amsmath, amsxtra}\usepackage{upgreek}\pagestyle{empty}\DeclareMathSizes{10}{9}{7}{6}\begin{document}
$$\dot{{\rm V}}$$
\end{document}O2max and RPEfixed. In contrast HVRe tended to explain (negatively mediate) the relationship between \documentclass{aastex}\usepackage{amsbsy}\usepackage{amsfonts}\usepackage{amssymb}\usepackage{bm}\usepackage{mathrsfs}\usepackage{pifont}\usepackage{stmaryrd}\usepackage{textcomp}\usepackage{portland, xspace}\usepackage{amsmath, amsxtra}\usepackage{upgreek}\pagestyle{empty}\DeclareMathSizes{10}{9}{7}{6}\begin{document}
$$\dot{{\rm V}}$$
\end{document}O2max and RPEfixed. Values are standardized regression coefficients and 95% confidence intervals (lower limit; upper limit) for direct effects of \documentclass{aastex}\usepackage{amsbsy}\usepackage{amsfonts}\usepackage{amssymb}\usepackage{bm}\usepackage{mathrsfs}\usepackage{pifont}\usepackage{stmaryrd}\usepackage{textcomp}\usepackage{portland, xspace}\usepackage{amsmath, amsxtra}\usepackage{upgreek}\pagestyle{empty}\DeclareMathSizes{10}{9}{7}{6}\begin{document}
$$\dot{{\rm V}}$$
\end{document}O2max on mediators (ax), direct effects of mediators on RPEfixed (bx), and indirect effects of \documentclass{aastex}\usepackage{amsbsy}\usepackage{amsfonts}\usepackage{amssymb}\usepackage{bm}\usepackage{mathrsfs}\usepackage{pifont}\usepackage{stmaryrd}\usepackage{textcomp}\usepackage{portland, xspace}\usepackage{amsmath, amsxtra}\usepackage{upgreek}\pagestyle{empty}\DeclareMathSizes{10}{9}{7}{6}\begin{document}
$$\dot{{\rm V}}$$
\end{document}O2max on RPEfixed through mediators (abx).
p < 0.05; bp < 0.01.
Utility of variables to predict submaximal exercise responses at altitude
The equation of Matthews et al. (1999) was used to calculate a simple questionnaire-based estimation of \documentclass{aastex}\usepackage{amsbsy}\usepackage{amsfonts}\usepackage{amssymb}\usepackage{bm}\usepackage{mathrsfs}\usepackage{pifont}\usepackage{stmaryrd}\usepackage{textcomp}\usepackage{portland, xspace}\usepackage{amsmath, amsxtra}\usepackage{upgreek}\pagestyle{empty}\DeclareMathSizes{10}{9}{7}{6}\begin{document}
$$\dot{{\rm V}}$$
\end{document}O2max. The predicted values were closely related to the measured values from the maximal exercise test (r = 0.80; p < 0.001). Furthermore, this simple fitness assessment negatively predicted sense of effort during submaximal exercise at altitude (RPEfixed), although the prediction was significantly improved with the addition of laboratory-assessed \documentclass{aastex}\usepackage{amsbsy}\usepackage{amsfonts}\usepackage{amssymb}\usepackage{bm}\usepackage{mathrsfs}\usepackage{pifont}\usepackage{stmaryrd}\usepackage{textcomp}\usepackage{portland, xspace}\usepackage{amsmath, amsxtra}\usepackage{upgreek}\pagestyle{empty}\DeclareMathSizes{10}{9}{7}{6}\begin{document}
$$\dot{{\rm V}}$$
\end{document}O2max (see Table 4, analysis 1).
Summary of Hierarchical Regression Analyses for Variables Predicting Sense of Effort During Submaximal Exercise at Altitude (RPEfixed)
In analysis 1, model 1 shows the utility of questionnaire-based estimation of \documentclass{aastex}\usepackage{amsbsy}\usepackage{amsfonts}\usepackage{amssymb}\usepackage{bm}\usepackage{mathrsfs}\usepackage{pifont}\usepackage{stmaryrd}\usepackage{textcomp}\usepackage{portland, xspace}\usepackage{amsmath, amsxtra}\usepackage{upgreek}\pagestyle{empty}\DeclareMathSizes{10}{9}{7}{6}\begin{document}
$$\dot{{\rm V}}$$
\end{document}O2max, whereas model 2 shows the additional utility of laboratory-assessed \documentclass{aastex}\usepackage{amsbsy}\usepackage{amsfonts}\usepackage{amssymb}\usepackage{bm}\usepackage{mathrsfs}\usepackage{pifont}\usepackage{stmaryrd}\usepackage{textcomp}\usepackage{portland, xspace}\usepackage{amsmath, amsxtra}\usepackage{upgreek}\pagestyle{empty}\DeclareMathSizes{10}{9}{7}{6}\begin{document}
$$\dot{{\rm V}}$$
\end{document}O2max (note the significant r2 in model 1 and r2 change value in model 2). In analysis 2, model 1 shows the utility of laboratory-assessed \documentclass{aastex}\usepackage{amsbsy}\usepackage{amsfonts}\usepackage{amssymb}\usepackage{bm}\usepackage{mathrsfs}\usepackage{pifont}\usepackage{stmaryrd}\usepackage{textcomp}\usepackage{portland, xspace}\usepackage{amsmath, amsxtra}\usepackage{upgreek}\pagestyle{empty}\DeclareMathSizes{10}{9}{7}{6}\begin{document}
$$\dot{{\rm V}}$$
\end{document}O2max, whereas model 2 shows the lack of benefit of additional hypoxic exercise testing (note the significant r2 in model 1, but insignificant r2 change value in model 2).
p < 0.001; bp < 0.05; cp < 0.01.
β, standardized beta coefficient (the magnitude of the effect in standardized units, allowing comparison between variables); B, unstandardized beta coefficient (the magnitude of the effect in raw units); SE B, standard error of B.
\documentclass{aastex}\usepackage{amsbsy}\usepackage{amsfonts}\usepackage{amssymb}\usepackage{bm}\usepackage{mathrsfs}\usepackage{pifont}\usepackage{stmaryrd}\usepackage{textcomp}\usepackage{portland, xspace}\usepackage{amsmath, amsxtra}\usepackage{upgreek}\pagestyle{empty}\DeclareMathSizes{10}{9}{7}{6}\begin{document}
$$\dot{{\rm V}}$$
\end{document}O2max alone was sufficient to predict submaximal exercise responses at altitude, with hypoxic exercise testing providing no additional benefit. Specifically, hypoxic sensitivity did not account for any additional variance than laboratory \documentclass{aastex}\usepackage{amsbsy}\usepackage{amsfonts}\usepackage{amssymb}\usepackage{bm}\usepackage{mathrsfs}\usepackage{pifont}\usepackage{stmaryrd}\usepackage{textcomp}\usepackage{portland, xspace}\usepackage{amsmath, amsxtra}\usepackage{upgreek}\pagestyle{empty}\DeclareMathSizes{10}{9}{7}{6}\begin{document}
$$\dot{{\rm V}}$$
\end{document}O2max when predicting sense of effort for RPEfixed (r2 change = 0.07; p = 0.22; see Table 4, analysis 2), RPEascent (r2 change = 0.05; p = 0.52), or STEPRPE35 (r2 change = 0.06; p = 0.33). In addition, hypoxic sensitivity did not account for any additional variance than questionnaire-based estimation of \documentclass{aastex}\usepackage{amsbsy}\usepackage{amsfonts}\usepackage{amssymb}\usepackage{bm}\usepackage{mathrsfs}\usepackage{pifont}\usepackage{stmaryrd}\usepackage{textcomp}\usepackage{portland, xspace}\usepackage{amsmath, amsxtra}\usepackage{upgreek}\pagestyle{empty}\DeclareMathSizes{10}{9}{7}{6}\begin{document}
$$\dot{{\rm V}}$$
\end{document}O2max when predicting submaximal exercise responses for RPEfixed (r2 change = 0.09; p = 0.18), RPEascent (r2 change = 0.06; p = 0.48), or STEPRPE35 (r2 change = 0.09; p = 0.26).
Discussion
The primary findings of this study were that greater sea-level fitness is associated with lower sense of effort and higher step rate during perceptually regulated exercise, but not worse AMS or arterial desaturation. We were able to demonstrate that these relationships are robust, and are not affected by acclimatization. Consequently, simple sea-level fitness tests predicted sense of effort during submaximal exercise at altitude, and no additional screening information was gained from hypoxic sensitivity testing.
Greater sea-level fitness was associated with lower sense of effort during an arduous trekking day, lower sense of effort during submaximal exercise, and a superior step rate during perceptually regulated exercise (at the typical chosen effort of mountain walkers and workers) at altitude. Importantly, lower sense of effort during trekking was also associated with better mood, including less fatigue, tension, and confusion. High fitness may, therefore, also protect against the major risk factors of musculoskeletal pain (Jakobsen et al., 2015), injury (Burtscher et al., 2015), and mortality (Firth et al., 2008), and enhance productivity in those travelling to altitude for work and leisure. Lower sense of effort and better mood indicates that trekkers more comfortably met the demands of the trek, suggesting that high fitness may also protect against summit failure and improve expedition enjoyment. Consequently, this study provides the first empirical evidence that simple sea-level fitness assessments may be useful to aid preparations for high-altitude travel. Furthermore, it provides preliminary evidence to support the recommendation that individuals should complete cardiorespiratory training to improve aerobic fitness before high-altitude travel (Bärtsch and Swenson, 2013). Aerobic training can improve \documentclass{aastex}\usepackage{amsbsy}\usepackage{amsfonts}\usepackage{amssymb}\usepackage{bm}\usepackage{mathrsfs}\usepackage{pifont}\usepackage{stmaryrd}\usepackage{textcomp}\usepackage{portland, xspace}\usepackage{amsmath, amsxtra}\usepackage{upgreek}\pagestyle{empty}\DeclareMathSizes{10}{9}{7}{6}\begin{document}
$$\dot{{\rm V}}$$
\end{document}O2max by ∼20%, although the response varies between 0% and 50%, depending on genetics, age, initial fitness, and the exact training type (Bouchard et al., 2011; Bacon et al., 2013; Milanović et al., 2015). Aerobic fitness is therefore a factor that can be modified to the substantial benefit of those that travel to altitude for work or leisure. As higher fitness was not associated with greater AMS or arterial desaturation, we recommend increasing fitness as much as possible before altitude travel. But of course increased fitness should not be used to ascend more quickly than current guidelines, which would increase altitude illness risk.
The most useful variable to predict sense of effort during submaximal exercise at altitude was \documentclass{aastex}\usepackage{amsbsy}\usepackage{amsfonts}\usepackage{amssymb}\usepackage{bm}\usepackage{mathrsfs}\usepackage{pifont}\usepackage{stmaryrd}\usepackage{textcomp}\usepackage{portland, xspace}\usepackage{amsmath, amsxtra}\usepackage{upgreek}\pagestyle{empty}\DeclareMathSizes{10}{9}{7}{6}\begin{document}
$$\dot{{\rm V}}$$
\end{document}O2max as determined by laboratory maximal exercise testing. Even sea-level fitness (\documentclass{aastex}\usepackage{amsbsy}\usepackage{amsfonts}\usepackage{amssymb}\usepackage{bm}\usepackage{mathrsfs}\usepackage{pifont}\usepackage{stmaryrd}\usepackage{textcomp}\usepackage{portland, xspace}\usepackage{amsmath, amsxtra}\usepackage{upgreek}\pagestyle{empty}\DeclareMathSizes{10}{9}{7}{6}\begin{document}
$$\dot{{\rm V}}$$
\end{document}O2max) estimated by a short questionnaire collecting simple demographic information also provided a strong prediction of sense of effort at altitude. Since the addition of hypoxic sensitivity variables did not improve the prediction of sense of effort during submaximal exercise at altitude, it must be concluded that technically demanding hypoxic exercise testing has no additional benefit beyond simple fitness testing for screening individuals' readiness to perform at altitude. It must be acknowledged that this study used a modified version of Richalet's proposed test. However, research by Richalet's group showed exercise intensity and Fio2 do not affect HVR or HCR obtained from the test (Lhuissier et al., 2012). Given the ease of administration (no arduous exercise or specialist equipment required), this simple questionnaire-based assessment of sea-level fitness provides medical and outdoor practitioners with a useful tool to help patients and clients prepare for altitude travel.
Importantly, lower sense of effort during submaximal exercise in fitter individuals did not come at the cost of worse altitude illness. Increased sea-level fitness was not a risk factor for AMS at altitude when ascent rate and trekking EE were similar in individuals. Additionally, in this study, all participants followed the same ascent profile. In contrast, previous studies to show a positive relationship between fitness and AMS have measured across multiple expeditions without accounting for differences in ascent rate (Karinen et al., 2010; Richalet et al., 2012). This suggests that any observed relationship between fitness and AMS is likely an artefact of behavioral differences. That is, fitter individuals likely ascend faster than their less-fit counterparts and it is this increased ascent rate that is responsible for their increased AMS (Schneider et al., 2002).
Physiological responses provided some explanation for the lower sense of effort during submaximal exercise in fitter individuals at altitude. Contrary to previous studies with acute hypoxic exposures, high-fit individuals had similar or better SpO2 than less-fit individuals during exercise tests completed at the high-altitude Base Camp on day 1 and 3, respectively. This was accompanied by an elevated heart rate response and a lower ventilatory response to acute hypoxia and chronic altitude exposure. Thus, at steady state submaximal exercise (typical of that required during trekking), the lung was able to accommodate the increased cardiac output without compromising pulmonary gas exchange. It is not clear whether the lower ventilatory response in high-fit individuals is due to decreased chemosensitivity or a more efficient ventilatory system, but whatever the cause, this response can be considered adaptive as it was associated with lower sense of effort during submaximal exercise. In support of this interpretation, hyperventilation is associated with increased work of breathing and dyspnea (Amann et al., 2007; Babb et al., 2008), which is a major determinant of RPE (Bernhadt et al., 2013). Increased work of breathing is particularly detrimental at altitude as it elevates peripheral and central fatigue (Ainslie and Ogoh, 2010; Amann, 2012) by reducing locomotor and cerebral blood flow that occur to maintain respiratory muscle demands (Amann et al., 2007).
Limitations
This study included no altitude measure of maximal exercise capacity, such as \documentclass{aastex}\usepackage{amsbsy}\usepackage{amsfonts}\usepackage{amssymb}\usepackage{bm}\usepackage{mathrsfs}\usepackage{pifont}\usepackage{stmaryrd}\usepackage{textcomp}\usepackage{portland, xspace}\usepackage{amsmath, amsxtra}\usepackage{upgreek}\pagestyle{empty}\DeclareMathSizes{10}{9}{7}{6}\begin{document}
$$\dot{{\rm V}}$$
\end{document}O2max, time to exhaustion, or time trial tests. However, RPE during submaximal exercise is closely related to maximal exercise capacity (Eston, 2012; Coquart et al., 2014, 2016). In addition, the assessment of maximal exercise capacity has limited functional relevance to the assessment of trekking and other submaximal work and exercise commonly performed at altitude. Due to their crucial role in fatigue (a major risk factor for mortality on high-altitude treks), we believe that sense of effort and perceptually regulated exercise are the best methods available to assess trekking exercise. This study provides preliminary evidence of the physiological mechanisms likely to explain the relationship between sea-level fitness and sense of effort during submaximal exercise at altitude. Future studies that experimentally manipulate fitness through training or other methods are required to confirm the importance of cardiorespiratory adaptations for submaximal exercise and fatigue at high altitude.
Conclusion
Understanding the determinants of exercise and illness at altitude is important to better prepare those who travel to high altitude (Puthon et al., 2015). This study indicates that greater sea-level fitness is related to lower sense of effort during submaximal exercise at altitude and better mood (less fatigue, tension, and confusion). Importantly, the lower sense of effort during submaximal exercise in high-fit individuals did not come at the cost of worse AMS or greater arterial oxygen desaturation. This study provides the first empirical evidence to support recent recommendations that people might complete sea-level aerobic fitness training before high-altitude travel (Bärtsch and Swenson, 2013; Burtscher et al., 2015). Indeed, our data suggest that low-fit persons may improve their trekking experience by increasing sea level fitness because it is associated with less effort and better mood during trekking at altitude. The study also indicates that a sea-level fitness assessment could be used to aid preparation for high-altitude travel by enabling better aerobic exercise prescription and identifying those people who might benefit most from the aerobic training. Given that fatigue and confusion are major risk factors for injury and fatality at altitude, sea-level fitness assessment and exercise training should be considered as part of preparations for high-altitude travel.
Footnotes
Acknowledgments
MEDEX 2015 research expedition comprised of many persons who without their help the study would not have been possible. In particular, the authors would like to thank the expedition organizers and volunteers who participated in this research, and also Kevin Williams, Jason Edwards, and Denzil Broadhurst for their technical assistance.
Author Disclosure Statement
No competing financial interests exist.
References
1.
AinsliePN, CampbellIT, FraynKN, HumphreysSM, MaclarenDPM, and ReillyT. (2002). Physiological and metabolic responses to a hill walk. J Appl Physiol, 92:179–187.
2.
AinsliePN, and OgohS. (2010). Regulation of cerebral blood flow in mammals during chronic hypoxia: A matter of balance. Exp Physiol, 95:251–262.
3.
AmannM. (2012). Pulmonary system limitations to endurance exercise performance in humans. Exp Physiol, 97:311–318.
4.
AmannM, PegelowDF, JacquesAJ, and DempseyJA. (2007). Inspiratory muscle work in acute hypoxia influences locomotor muscle fatigue and exercise performance of healthy humans. Am J Physiol Regul Integr Comp Physiol, 293:2036–2045.
5.
BabbTG, RanasingheKG, ComeauLA, SemonTL, and SchwartzB. (2008). Dyspnea on exertion in obese women: Association with an increased oxygen cost of breathing. Am J Respir Crit Care Med, 178:116–123.
6.
BaconAP, CarterRE, OgleEA, and JoynerMJ. (2013). VO2max trainability and high intensity interval training in humans: A meta-analysis. PLoS One, 8:e73182.
7.
BärtschP. (2014). Con: Hypoxic cardiopulmonary exercise testing identifies subjects at risk for severe high altitude illnesses. High Alt Med Biol, 15:318–320.
8.
BärtschP, and SwensonER. (2013). Clinical practice: Acute high-altitude illnesses. N Engl J Med, 368:2294–2302.
9.
BassettDR, and HowleyET. (2000). Limiting factors for maximum oxygen uptake and determinants of endurance performance. Med Sci Sport Exerc, 32:70–84.
10.
BernardiL, SchneiderA, PomidoriL, PaolucciE, and CogoA. (2006). Hypoxic ventilatory response in successful extreme altitude climbers. Eur Respir J, 27:165–171.
11.
BernhadtV, WoodHE, MoranRB, and BabbTG. (2013). Dyspnea on exertion in obese men. Respir Physiol Neurobiol, 185:241–248.
12.
BlandM. (2015). Determination of Sample Size. Oxford University Press, Oxford, UK.
13.
BorgG, and BorgE. (2001). A new generation of scaling methods: Level-anchored ratio scaling. Psychologica, 28:15–45.
14.
BouchardC, SarzynskiMA, RiceTK, KrausWE, ChurchTS, SungYJ, RaoDC, and RankinenT. (2011). Genomic predictors of the maximal O2 uptake response to standardized exercise training programs. J Appl Physiol, 110:1160–1170.
15.
BurtscherM, GattererH, and KleinsasserA. (2015). Cardiorespiratory fitness of high altitude mountaineers: The underestimated prerequisite. High Alt Med Biol, 16:169–170.
16.
CallenderN, EllertonJ, and MacdonaldJH. (2012). Physiological demands of mountain rescue work. Emerg Med J, 29:753–757.
17.
Canouï-PoitrineF, VeerabudunK, LarmignatP, LetournelM, Bastuji-GarinS, and RichaletJ-P. (2014). Risk prediction score for severe high altitude illness: A cohort study. PLoS One, 9:e100642.
18.
CoquartJB, GarcinM, ParfittG, Tourny-CholletC, and EstonRG. (2014). Prediction of maximal or peak oxygen uptake from ratings of perceived exertion. Sport Med, 44:563–578.
19.
CoquartJ, TabbenM, FarooqA, TournyC, and EstonR. (2016). Submaximal, perceptually regulated exercise testing predicts maximal oxygen uptake: A meta-analysis study. Sport Med, 46:885–897.
20.
CoyleEF, CogganAR, HopperMK, and WaltersTJ. (1988). Determinants of endurance in well-trained cyclists. J Appl Physiol, 64:2622–2630.
21.
EnokaRM, and StuartDG. (1992). Neurobiology of muscle fatigue. J Appl Physiol, 72:1631–1648.
22.
EstonR. (2012). Use of ratings of perceived exertion in sports. Int J Sports Physiol Perform, 7:175–182.
23.
FanchiniM, FerraresiI, ModenaR, SchenaF, CouttsAJ, and ImpellizzeriFM. (2016). Use of CR100 scale for session-RPE in soccer and interchangeability with CR10. Int J Sports Physiol Perform, 11:388–392.
24.
FerrettiG, MoiaC, ThometJ, KayserB, Physiologie D De, UniversitaireCM, and ServetM. (1997). The decrease of maximal oxygen consumption during hypoxia in man: A mirror image of the oxygen equilibrium curve. J Physiol, 498:231–237.
25.
FirthPG, ZhengH, WindsorJS, SutherlandAI, ImrayCH, MooreGWK, SempleJL, RoachRC, and SalisburyRA. (2008). Mortality on Mount Everest, 1921–2006: Descriptive study. Br Med J, 337:a2654.
26.
FosterC, FlorhaugJA, FranklinJ, GottschallL, HrovatinLA, ParkerS, DoleshalP, and DodgeC. (2001). A new approach to monitoring exercise training. J Strength Cond Res, 15:109–115.
27.
FulcoCS, RockPB, and CymermanA. (1998). Maximal and submaximal exercise performance at altitude. Aviat Space Environ Med, 69:793–801.
28.
GaskillSE, RubyBC, WalkerAJ, SanchezOA, SerfassRC, and LeonAS. (2001). Validity and reliability of combining three methods to determine ventilatory threshold. Med Sci Sport Exerc, 33:1841–1848.
29.
Government of Nepal. (2013). Ministry of Culture Tourism & Civil Aviation: Nepal Tourism Statistics 2013.
30.
HayesAF. (2013). Introduction to Mediation, Moderation and Conditional Process Analysis: A Regression-Based Approach. Guilford Press, New York.
31.
JacksonAS, BlairSN, MaharMT, WierLT, RossRM, and StutevilleJE. (1990). Prediction of functional aerobic capacity without exercise testing. Med Sci Sport Exerc, 22:863–870.
32.
JakobsenMD, SundstrupE, BrandtM, JayK, AagaardP, and AndersenLL. (2015). Physical exercise at the workplace reduces perceived physical exertion during healthcare work: Cluster randomized controlled trial. Scand J Public Health, 43:1–8.
33.
KarinenHM, PeltonenJE, KähönenM, and TikkanenHO. (2010). Prediction of acute mountain sickness by monitoring arterial oxygen saturation during ascent. High Alt Med Biol, 11:325–332.
34.
LazioMP, RooJD Van, PesceC, MalikS, and CourtneyDM. (2010). Postexercise peripheral oxygen saturation after completion of the 6-minute walk test predicts successfully reaching the summit of Aconcagua. Wilderness Environ Med, 21:309–317.
35.
LhuissierFJ, BrummM, RamierD, and RichaletJ-P. (2012). Ventilatory and cardiac responses to hypoxia at submaximal exercise are independent of altitude and exercise intensity. J Appl Physiol, 112:566–570.
36.
MacInnisMJ, NugentSF, MacleodKE, and LohseKR. (2015). Methods to estimate VO2max upon acute hypoxia exposure. Med Sci Sport Exerc, 47:1869–1876.
37.
MarconiC, MarzoratiM, GrassiB, BasnyatB, ColombiniA, KayserB, and CerretelliP. (2004). Second generation Tibetan lowlanders acclimatize to high altitude more quickly than Caucasians. J Physiol, 5562:661–671.
38.
MatthewsCE, HeilDP, FreedsonPS, and PastidesH. (1999). Classification of cardiorespiratory fitness without exerise testing. Med Sci Sport Exerc, 31:486–493.
39.
MilanovićZ, SporišG, and WestonM. (2015). Effectiveness of high-intensity interval training (HIT) and continuous endurance training for VO2max improvements: A systematic review and meta-analysis of controlled trials. Sport Med, 45:1469–1481.
40.
MollardP, WooronsX, LetournelM, LambertoC, FavretF, PichonA, BeaudryM, and RichaletJ-P. (2007). Determinants of maximal oxygen uptake in moderate acute hypoxia in endurance athletes. Eur J Appl Physiol, 100:663–673.
41.
OliverSJ, SandersSJ, WilliamsCJ, SmithZA, Lloyd-DaviesE, RobertsR, ArthurC, HardyL, and MacdonaldJH. (2012). Physiological and psychological illness symptoms at high altitude and their relationship with acute mountain sickness: A prospective cohort study. J Travel Med, 19:210–219.
42.
PandolfKB, GivoniB, and GoldmanRF. (1977). Predicting energy expenditure with loads while standing or walking very slowly. J Appl Physiol, 43:577–581.
43.
PescatelloL, ArenaR, RiebeD, and ThompsonP. (2013). American College of Sports Medicine's Guidelines for Exercise Testing and Prescription. Wolters Kluwer/Lippincott Williams & Wilkins Health, Philadelphia, PA.
44.
PuthonL, BouzatP, RuppT, RobachP, Favre-JuvinA, and VergesS. (2015). Physiological characteristics of elite high-altitude climbers. Scand J Med Sci Sports, 26:1052–1059.
45.
RathatC, RichaletJ-P, HerryJ-P, and LarmignatP. (1992). Detection of high-risk subjects for high altitude diseases. Int J Sports Med, 13:S76–S78.
46.
RichaletJ-P, and Canouï-PoitrineF. (2014). Pro: Hypoxic cardiopulmonary exercise testing identifies subjects at risk for severe high altitude illnesses. High Alt Med Biol, 15:315–317.
47.
RichaletJ-P, LarmignatP, PoitrineE, LetournelM, and Canouï-PoitrineF. (2012). Physiological risk factors for severe high-altitude illness: A prospective cohort study. Am J Respir Crit Care Med, 185:192–198.
48.
RichaletJ-P, and LhuissierFJ. (2015). Aging, tolerance to high altitude, and cardiorespiratory response to hypoxia. High Alt Med Biol, 16:117–124.
49.
RoachRC, BärtschP, OelzO, and HackettPH. (1993). Lake Louise AMS scoring consensus committee: The Lake Louise acute mountain sickness scoring system. In: Hypoxia and Molecular Medicine. SuttonJR, HoustonC, and CoatesG, eds. Charles S. Houston, Burlington, VT. pp. 272–274.
50.
SchneiderM, BernaschD, WeymannJ, HolleR, and BärtschP. (2002). Acute mountain sickness: Influence of susceptibility, preexposure, and ascent rate. Med Sci Sport Exerc, 34:1886–1891.
51.
SchoeneRB, LahiriS, HackettPH, PetersRM, MilledgeJS, PizzoCJ, SarnquistFH, BoyerSJ, GraberDJ, MaretKH, and WestJB. (1984). Relationship of hypoxic ventilatory response to exercise performance on Mount Everest. J Appl Physiol, 56:1478–1483.
52.
TerryPC, LaneAM, LaneHJ, and KeohaneL. (1999). Development and validation of a mood measure for adolescents: POMS-A. J Sports Sci, 17:861–872.
53.
Van ThienenR, and HespelP. (2016). Enhanced muscular oxygen extraction in athletes exaggerates hypoxemia during exercise in hypoxia. J Appl Physiol, 120:351–361.