
Abstract
Abstract
Ha, Hoehun. Geographic variation in mentally unhealthy days: air pollution and altitude perspectives. High Alt Med Biol. 18:258–266, 2017.
Background:
Mental health incorporates our emotional, psychological, and social well-being and it is critical at each phase of life, from youth and preadulthood through adulthood.
Methods:
We assessed the association between mentally unhealthy days (MUDs), air pollutant concentrations, and altitude on the basis of cross-county studies. Data on poor mental health days for the United States were based on health-related telephone surveys conducted by the Behavioral Risk Factor Surveillance System (BRFSS). Average annual regional air pollution data were obtained from Center for Disease Control and Prevention (CDC) WONDER Environmental data, and altitude data were collected from the U.S. Geological Survey (USGS).
Results:
In the data set (across 2589 U.S. counties for 2011), even after accounting for potential confounding variables and multicollinearity, a significant association between altitude, air pollution, and poor mental health days was found, explaining that poor mental health days increase with increasing air pollution concentrations and with decreasing altitude (R2 = 0.663, p < 0.001). Controlling for socioeconomic (e.g., education and employment) and social (including social relationship and crime) factors did not change these findings.
Conclusions:
In this study, we found that counties with lower air pollution and higher altitude had significantly lower average number of MUDs reported within the past 30 days. This association has not been reported before in the literature. These findings suggest a need for further investigation into the extent that air quality and altitude may serve as significant factors for mental health and have major implications in our understanding of the etiology of mental health by medical professionals.
Introduction
M
Depressive and anxiety disorders are frequently recurrent, long-lasting diseases that lead to substantial individual and societal costs (Kessler, 2012). The Agency for Healthcare Research and Quality refers to an expense of $57.5B in 2006 for mental healthcare in the United States, which is equivalent to the expense of cancer care (Soni, 2009). However, unlike cancer, much of the economic burden on mental illness is not the cost of care, but rather the loss of income due to unemployment, costs for social supports, and a range of indirect expenses due to a perpetual disability that starts early in life (Soni, 2009; Insel, 2011). Moreover, the WHO has reported that mental disorders are the major causes of disability adjusted life years (DALYs) worldwide, accounting for 37% of healthy years from noncommunicable diseases and 33% for depression alone for this disability (World Health Organization, 2008, 2011; Insel, 2011). This report estimates the worldwide expense of mental health disorder at almost $2.5T, which accounts for two-thirds of indirect costs in 2010, with a projected increase to over $6T by 2030 (World Health Organization, 2008, 2011; Insel, 2011).
There is no single cause for mental disorders; rather, they can be caused by a combination of biological, psychological, and environmental variables (Ahn et al., 2009). It is well known that rates of mental disorders differ by culture, gender, race, and ethnicity. For example, culture bears on what kind of social support and coping styles people have and how much stigma they attach to mental disorders. Also, men and African Americans are less likely than women and whites to suffer from major depression (U.S. Department of Health & Human Services, 2001; Ahn et al., 2009).
Moreover, a number of studies incorporate socioeconomic status (education and employment), geographical region (rural/urban), health equity (access to care and quality of care), mental health characteristics (alcohol or other substance abuse), and social (including social relationship and crime) factors (Galea et al., 2005; Frideli, 2009; Ngui et al., 2010; Umberson and Montez, 2010; Betz et al., 2011). Evidence exists that persons living in rural areas with limited opportunities for education and employment, and less social relationships and access to care, experience worse mental health that hampers their capacity to contribute to society (Ngui et al., 2010; Umberson and Montez, 2010; Betz et al., 2011). Recently, different rates of mental disorders have been observed regionally. Few theories exist that explain this marked regional variation in rates of mental disorders (Akinbami et al., 2011).
One environmental factor that may contribute to the regional disparity in mental disorders is air pollution. Specifically, areas with higher level of air pollution, which are primarily found in the eastern region of the country, might be more likely to have higher rates of mental disorders. This could be due to the long-term exposure to air pollution, which can cause physical changes to the brain, as well as learning and memory problems, and even depression (Evans, 2003; Fonken et al., 2011). In particular, there are notable investigations on the association between PM2.5 (particulate matter, particulates with size of 2.5 μm in diameter or smaller) exposure and incident depression (Fonken et al., 2011; Kim et al., 2016). For example, in a mouse study by Fonken et al. (2011), PM2.5 mice displayed more depressive-like responses and impairments in spatial learning and memory compared with mice exposed to filtered air (Fonken et al., 2011). The research is thought to have major environmental implications for the improvement of low mood and concentration problems for people who live and work in polluted areas around the world.
Moreover, increased elevation has been shown to have a protective relationship with certain medical illnesses, with apparent decreases in morbidity among patients with coronary artery disease (Balibas et al., 2005), stroke (Faeh et al., 2009), and diabetes (Kruse et al., 2003). Also, recent studies in the United States and Himalayan regions found an influence of altitude on attention-deficit/hyperactivity disorder (ADHD) (Huber et al., 2015) and depression (Ishikawa et al., 2016), one of the most commonly diagnosed mental disorders. Several mechanisms have been suggested to explain the association between mental health and altitude, including hypobaric hypoxia, which may affect human behavior (Maldonado et al., 2009; Huber et al., 2015).
However, it is likely that other cultural, sociodemographic, clinical, and mental health characteristics not adjusted in previous investigations may explain some of mental disorders at different altitudes and it is important to identify the differences in other characteristics before concluding that there is a significant relationship between mental health and altitude (Betz et al., 2011; Ishikawa et al., 2016). While some of these variables may vary across regions, their contribution to mental health would propose different approaches in mental health studies. In this study, we report on a nationwide study, examining 2589 contiguous U.S. counties, to evaluate whether independent relationships between air pollution, altitude, and mental health exist. Recognizing the wide geographic variability of air pollution and altitude, we conducted an analysis of county-level data, while also controlling for other confounding variables associated with mental health.
Methods and Materials
Mentally unhealthy days
The Selected Metropolitan/Micropolitan Area Risk Trends (SMART) of Behavioral Risk Factor Surveillance System (BRFSS) in 2011 was used in the present analyses to examine associations between air pollution, altitude, and mental health. The Center for Disease Control and Prevention (CDC) analyzes BRFSS data for metropolitan and micropolitan statistical areas (MMSA) to produce city- and county-level health information known as SMART BRFSS. Typically, BRFSS data are utilized to provide state-level estimates; however, for the SMART project, BRFSS data were utilized to provide city- and county-level estimates (Centers for Disease Control and Prevention [CDC], 2011; Voss et al., 2013). During the interviews, the respondents provided a county of residence, which was then matched to a county code using the American National Standards Institute (ANSI) database. A minimum of 500 respondents per county were required to be included. Otherwise, counties are not included. As a result, there were a total 2,751,294 respondents from 2589 counties in the SMART BRFSS, accounting for 82% of the total counties used for further analysis.
The data sets include information on U.S. residents regarding their health-related risk behaviors, chronic health conditions, and use of preventive services collected in 2011. As a measure of health-related quality of life, the BRFSS inquiries about mentally unhealthy days (MUDs) and data were collected based on the following question: “Now thinking about your mental health, which includes stress, depression, and problems with emotions, for how many days during the past 30 days was your mental health not good?” The data were adjusted for age as it allows populations to be compared when the age profiles of the populations are quite different. Moreover, we used the average number of days a county's adult respondents reported for the entire year of 2011 to provide a consistent time frame with air pollution data and other covariates. We also used county-level census data to assign average number of MUDs for each county, as shown in Figure 1.
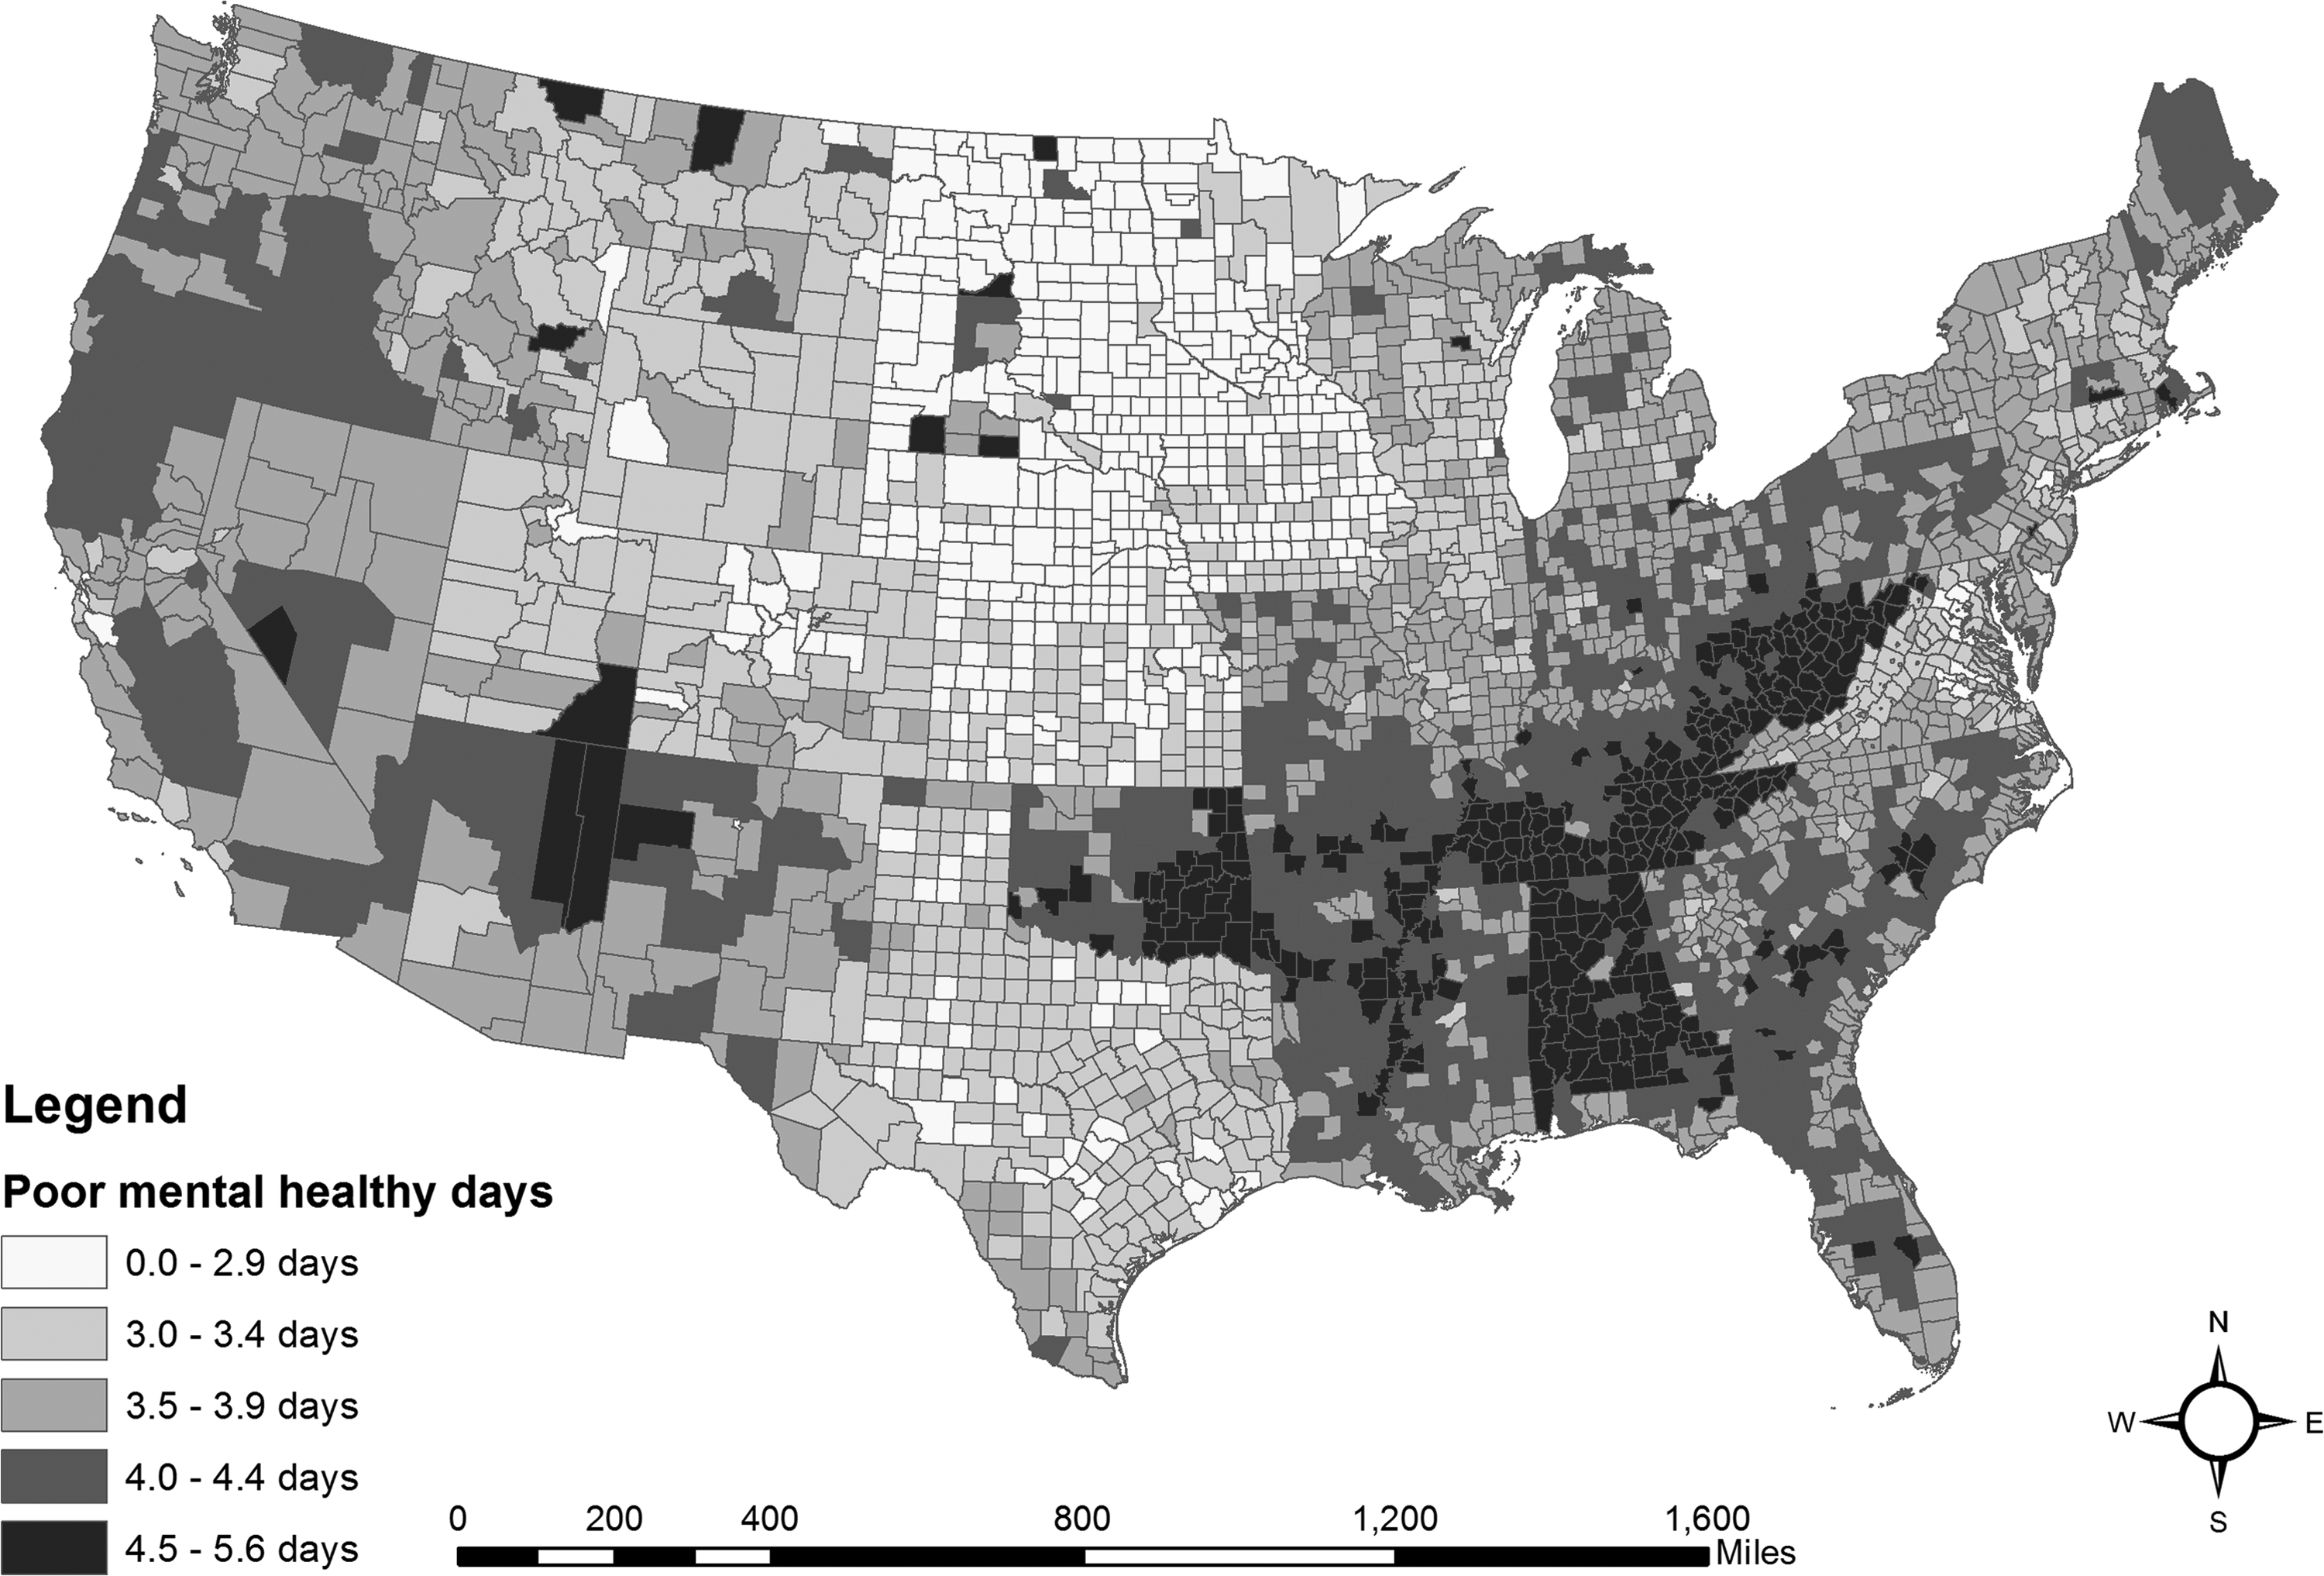
Annual average number of mentally unhealthy days reported in past 30 days (age adjusted).
Air pollution data
Daily measures of fine particulate matter in the outdoor air, spanning the years 2003–2011, were obtained from the CDC WONDER environmental data. Data are available by place (48 contiguous states or area nationwide, county), time (year, month, day), and specified fine particulate matter (μg/m3) value. County-level and higher data are aggregated from 10-km2 spatial resolution grids. In this research, average annual concentration of fine particulate matter in micrograms per cubic meter (PM2.5) measured in 2011 was used. Figure 2 shows average annual density of fine particulate matter in micrograms per cubic meter (μg/m3) for each county. PM2.5 was considered as a major air pollution variable in the study as PM2.5 has been demonstrated to be especially associated with neuropsychological outcomes because of its capability of reaching the brain due to its small size (Block and Calderón-Garcidueñas, 2009; Calderón-Garcidueñas et al., 2015).
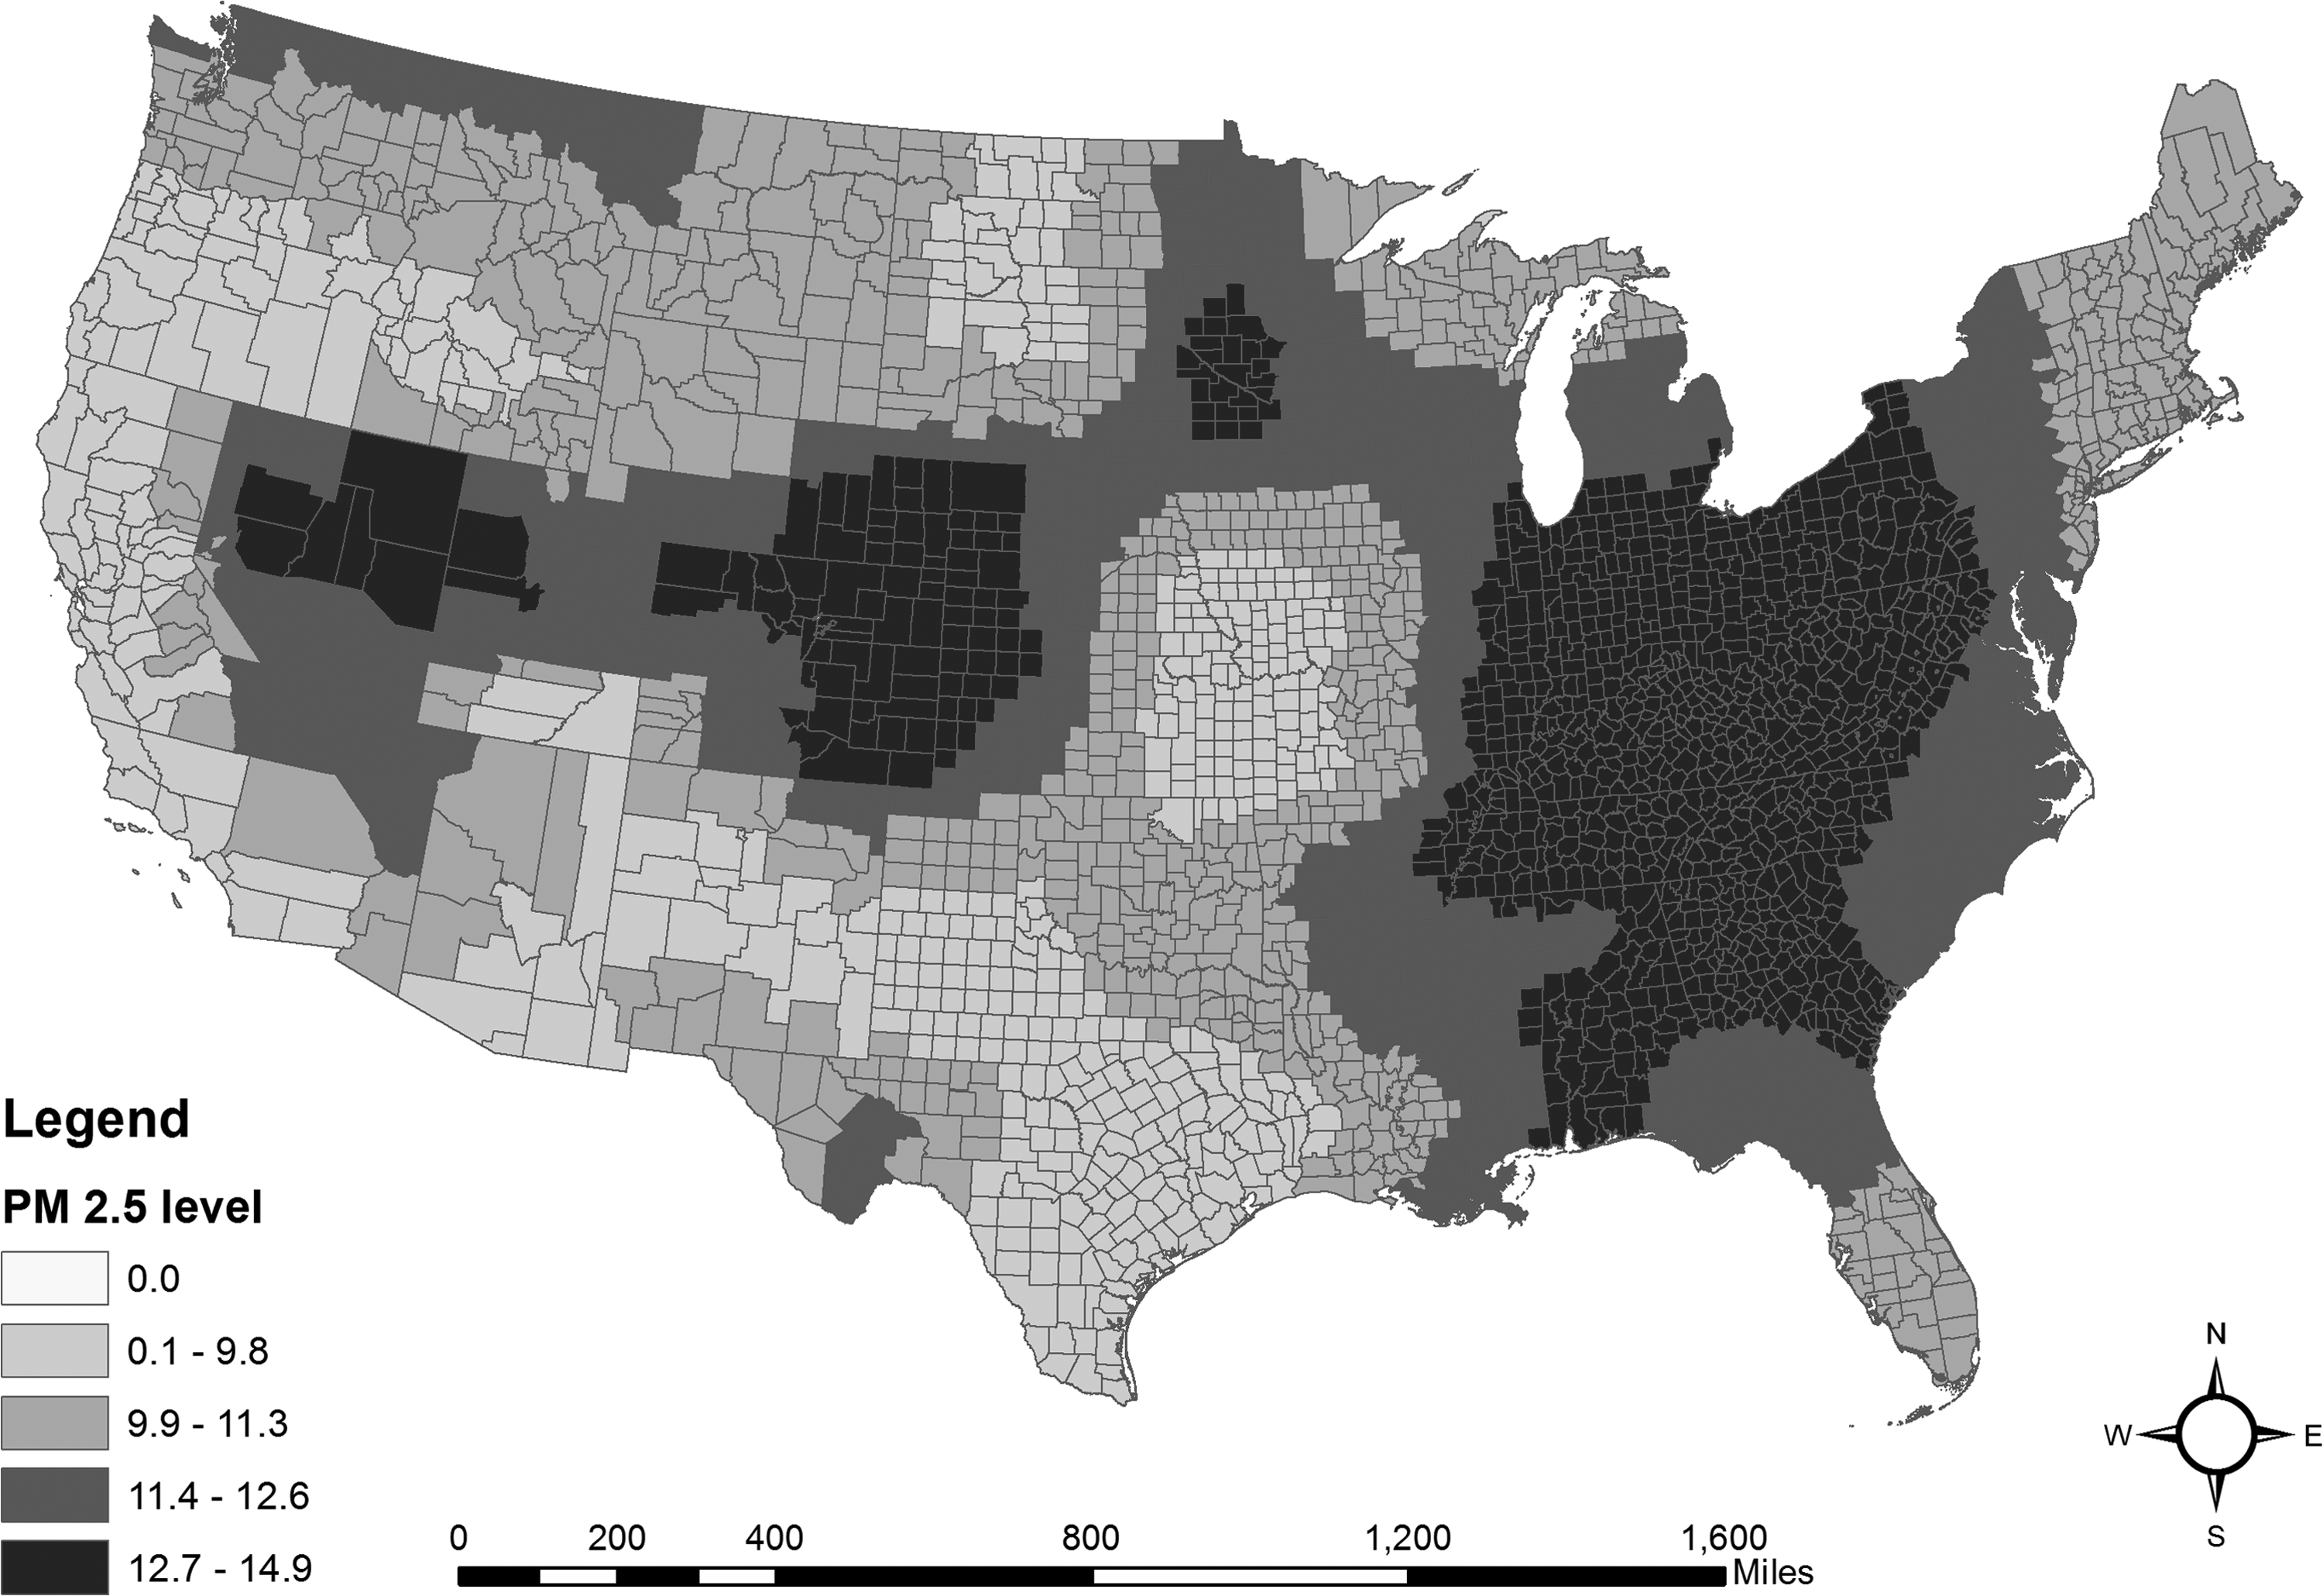
Average annual density of fine particulate matter in micrograms per cubic meter (PM2.5). PM2.5, particulate matter, particulates with size of 2.5 μm in diameter or smaller.
Mean county altitude data
County elevation for 3141 administrative areas (counties) within the United States was created in 2012 by the U.S Geological Survey (U.S. Geological Survey, 2012). Mean county altitude allowed accurate calculations due to the 100-m spatial resolution of the U.S. Geological Survey (USGS) data set. The mean altitude of each county was calculated using zonal statistics within the ArcGIS 10.3 environment to reduce variations in topography. This is a more reliable approach even for large counties, although the problems are obviously worse when considering entire states (Huber et al., 2015) or simply using elevation values at the center of each county (Brenner et al., 2011). Data from 2589 counties were used in the analyses. Alaska and Hawaii were not included in the analyses because digital altitude information was not fully available in the USGS data set. County boundaries from the U.S. Census Bureau (2011) were used to obtain mean county altitudes in meter and the areas in square miles for each included county as shown in Figure 3.
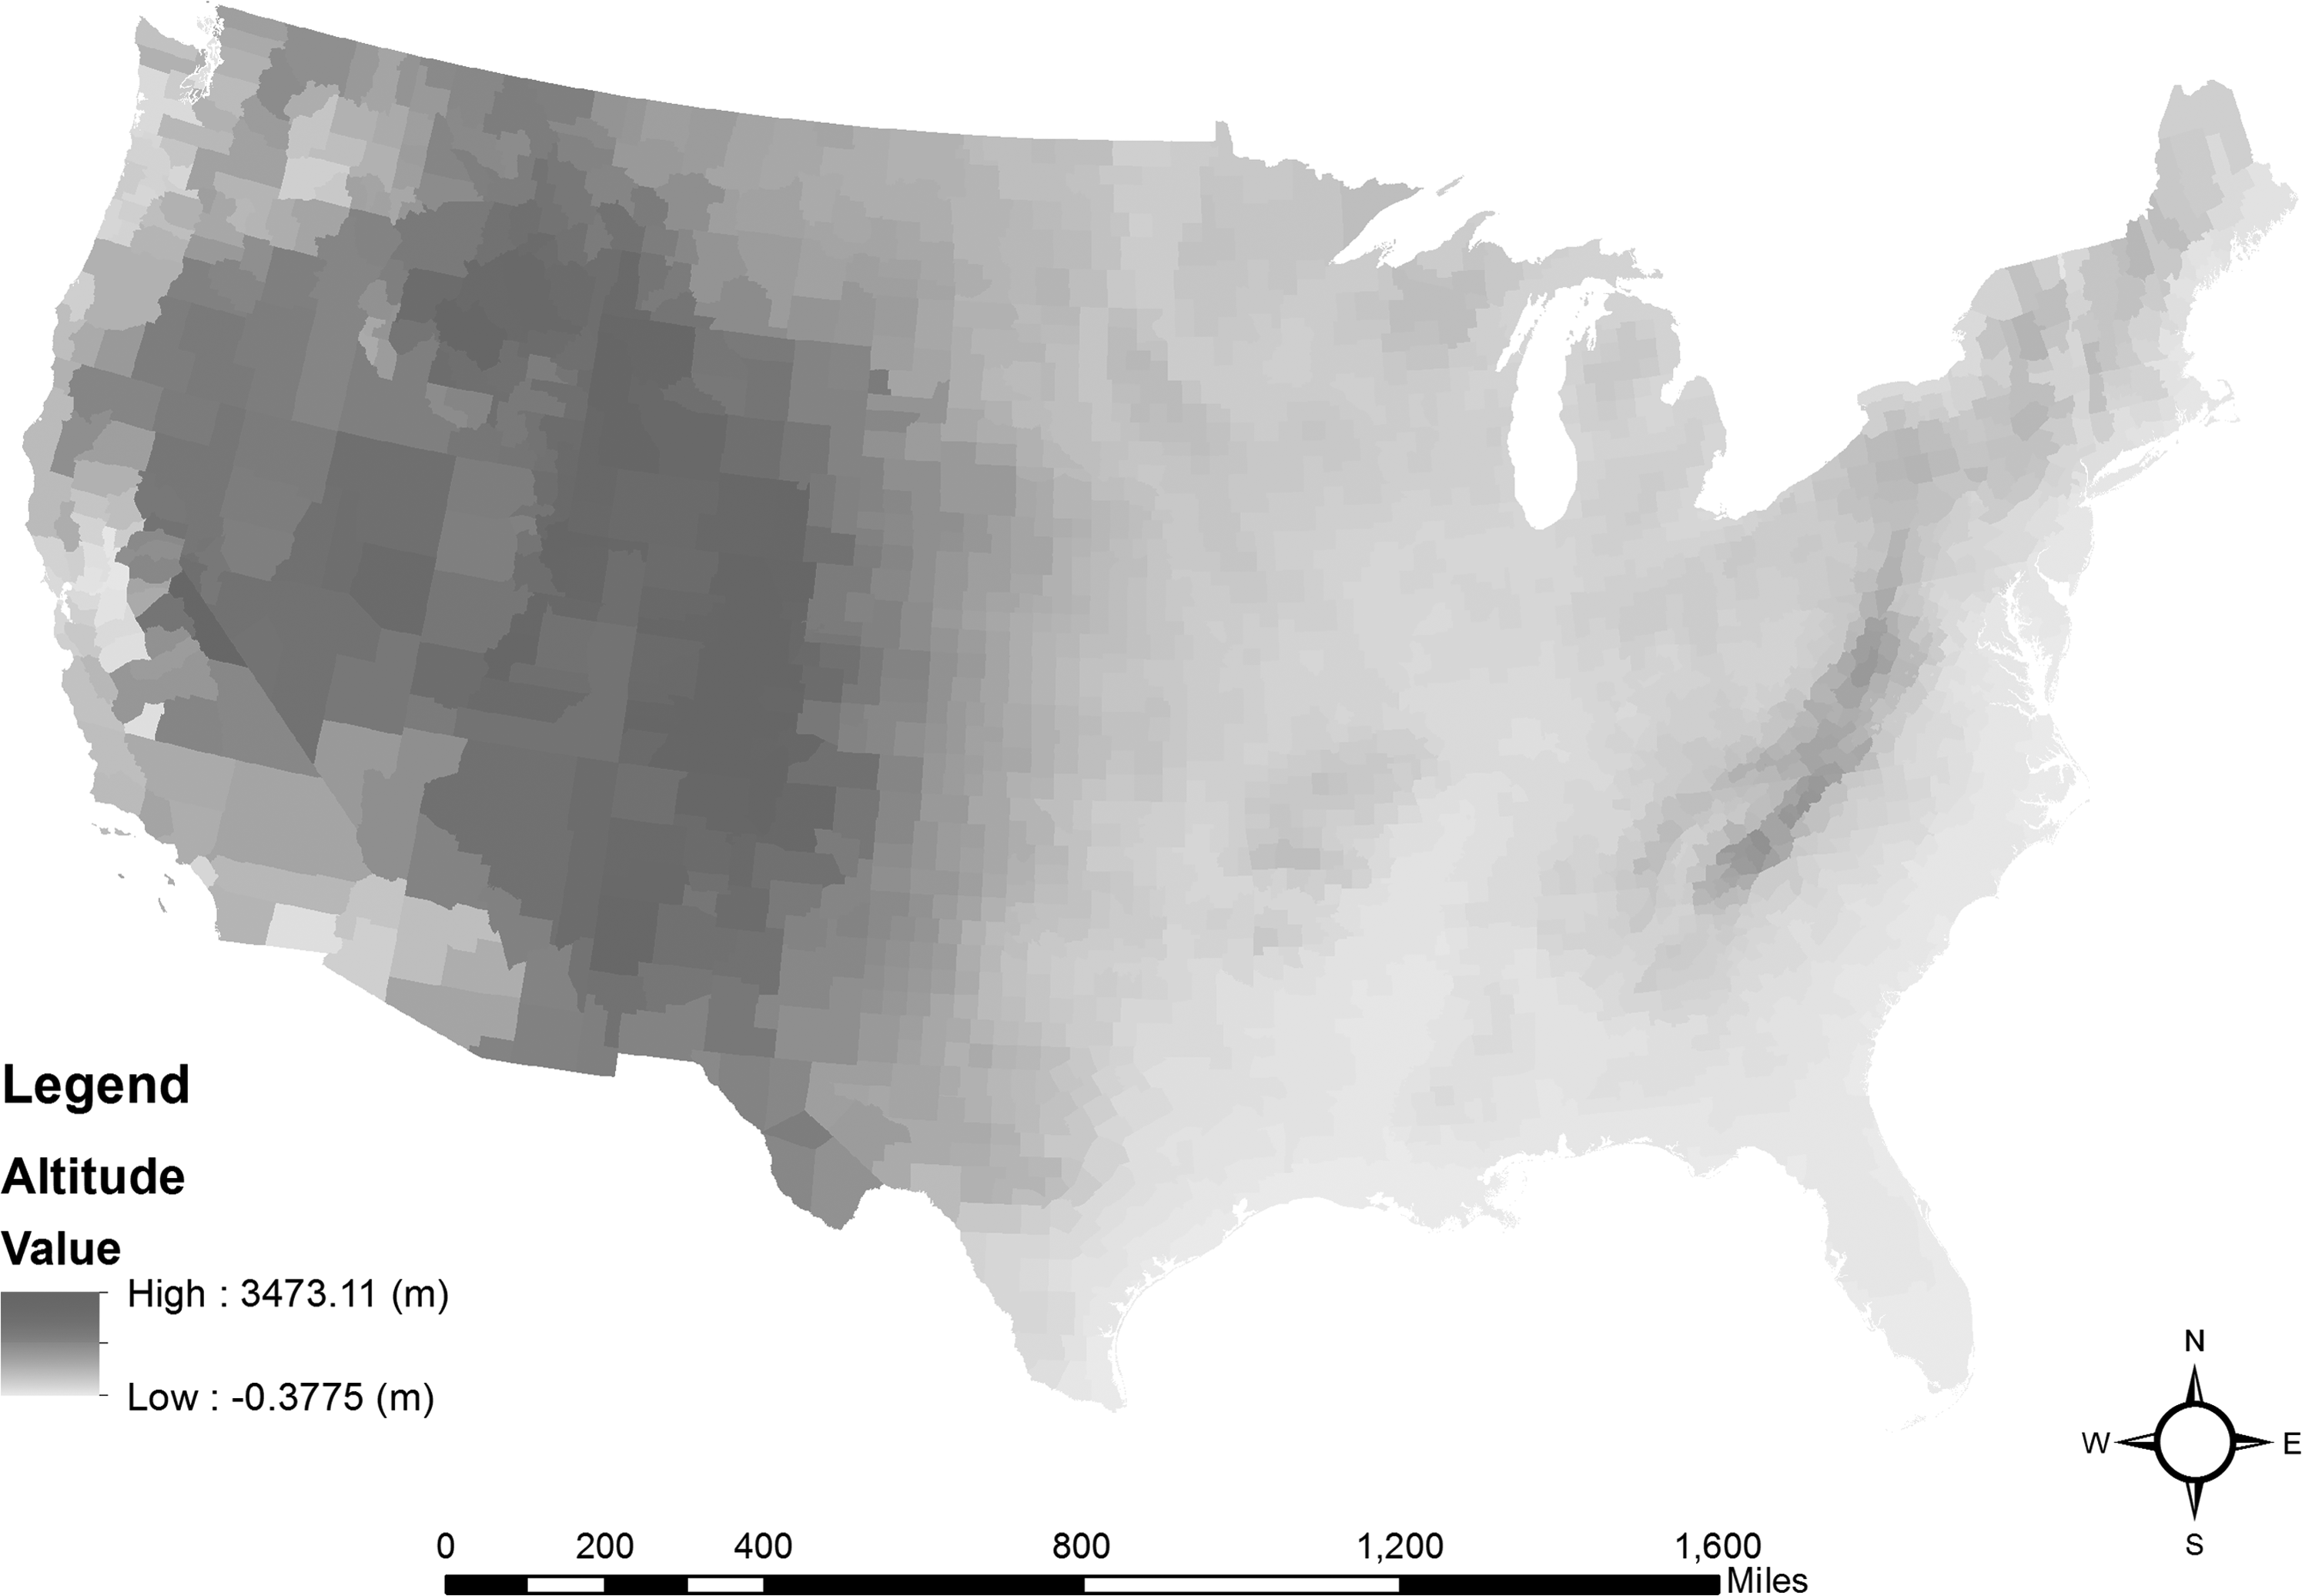
Mean county altitude in meter.
Potential confounding variables
We accounted for effects of potential confounding variables to enhance confidence levels in our analyses. The included variables were (1) clinical care variables (ratio of population to primary care physicians, ratio of population to mental health providers, preventable hospital stays), (2) social and economic variables (percentage of adults with a post-secondary education, percentage of unemployment, percentage of children in single parent, number of membership associations, violent crime rate), (3) physical variables (percentage of housing with severe problems), and (4) demographic variables (percentage of African American, percentage of female, percentage of rural area).
Confounding variables were collected from various data sources because variables possibly relevant to mental health condition were not available and sufficient from SMART BRFSS. Specifically, information on clinical care was collected from the American Medical Association and CMS, National Provider Identification File. The percentage of unemployment in 2011 was obtained from the Bureau of Labor Statistics. Moreover, American Community Survey (ACS) and Census Population Estimates provided data on education, family, and social support, and demographics for 2010–2014, respectively (Table 1). Most of these covariates from different database sources used ACS 5-year estimates from 2010–2014 and Census Population Estimates in 2011 to be consistent with the time frame of the SMART BRFSS and air pollution data.
BRFSS, Behavioral Risk Factor Surveillance System; PM2.5, particulate matter, particulates with size of 2.5 μm in diameter or smaller; SD, standard deviation; SMART, Selected Metropolitan/Micropolitan Area Risk Trends.
Model analyses
Separate analyses were conducted to adjust for the included confounding variables. Before the analyses, data skewness was checked to determine whether we would need data transformation. Afterward, correlation analyses were performed between MUDs and the following county-level variables (Table 2). Air pollution, altitude, and the remaining confounding variables were entered into a separate model, using MUDs as the dependent variable for the data set. We applied stepwise multiple regression to the models to quantify the independent effects of air pollution and altitude while controlling for the presence of others (MacNally, 2000; Zuur et al., 2007). Results were further checked for multicollinearity based on the variance inflation factor (VIF), where one of the variables concerned was dropped from further consideration (Rogerson, 2006).
Significant at p < 0.001.
Significant at p < 0.05.
PM2.5, particulate matter, particulates with size of 2.5 μm in diameter or smaller.
The models included the MUDs with air pollution levels, altitude, primary care physician rate, mental health provider rate, preventable hospital rate, percentage of college education, percentage of unemployed, association rate, violent crime rate, percentage of severe housing problems, percentage of African American, percentage of female, and percentage of rural. Since we are interested in air pollution and altitude with MUDs, we initially ran a multiple linear regression model with only these two variables. Then, we included potential covariates in a subsequent regression model to assure that the inclusion of the covariates did not change the relative importance of air pollution and altitude in explaining poor mental health days. We used the coefficient of determination (R2) as a measure of variation explained by each regression model (Quinn and Keough, 2002). All regression analyses were performed using Statistical Product and Service Solutions (SPSS) version 20 at the 0.05 significance level for entry.
Results
Bivariate analysis of the SMART BRFSS data set
Table 1 shows descriptive statistics for predictor and outcome variables for the SMART BRFSS and covariate data sets. Results included values for the mean, standard deviations, and range statistics. Bivariate analysis of the SMART BRFSS data set suggests that average annual density of PM2.5 (p < 0.001); mean county altitude (p < 0.001); primary care physician rate (p < 0.001); mental health provider rate (p = 0.013); preventable hospital rate (p < 0.001); percentage of college education (p < 0.001); percentage of unemployed (p < 0.001); association rate (p < 0.001); violent crime rate (p < 0.001); percentage of severe housing problems (p < 0.001); percentage of African American (p < 0.001); percentage of female (p < 0.001); and percentage of rural (p = 0.004) were independently, significantly associated with MUDs (Table 2). Therefore, only two spatial components (average daily density of PM2.5 and mean county altitude) were included in a multiple linear regression model (Table 3), and then potential covariates were entered in a subsequent regression analysis using a stepwise method (Table 4).
Significant at p < 0.001.
SE, standard error.
Significant at p < 0.001.
Significant at p < 0.05.
Model with two spatial components and potential confounding variables
The initial regression model found that the overall model with two spatial components only (average daily density of PM2.5 and mean county altitude) was significant, F(2, 2552) = 194.864, p < 0.001. The regression model accounts for 14.0% of the variance in explaining MUDs. Results from the regression model suggest that both spatial components, average daily density of PM2.5, and mean county altitude were significantly associated with MUDs (Table 3) (B = 0.277; p = 0.000 and B = −0.206; p = 0.000, respectively). The value of R2 is 0.140, but this is significantly different from zero, give n the large number of counties examined.
The subsequent multiple linear regression found that the overall model, including the aforementioned 12 variables, was significant, F(13, 2286) = 346.186, p < 0.001. The total regression model accounts for 66.3% of the variance in explaining MUDs. Results from the regression model suggest that two spatial components (average daily density of PM2.5 and mean county altitude), mental health provider rate, preventable hospital rate, percentage of college education, percentage of unemployed, association rate, violent crime rate, percentage of African American, percentage of female, and percentage of rural were significantly related to MUDs (Table 4). In particular, percentage of college education, average daily density of PM2.5, and percentage of unemployed are three most significant contributions in explaining MUDs when controlling for other potential covariates (B = −0.383; p = 0.000, B = 0.211; p = 0.000, and B = 0.258; p = 0.000, respectively). Furthermore, percentage of female, mental health provider rate, preventable hospital rate, and association rate were closely related to the MUDs (B = 0.171; p = 0.000, B = 0.148; p = 0.000, B = 0.149; p = 0.000, and B = −0.140; p = 0.000, respectively).
Overall, two spatial variables, average daily density of PM2.5 and mean county altitude, had a substantial independent explanatory power in explaining MUDs. Even after accounting for potential confounding variables and multicollinearity, a significant association between altitude, air pollution, and poor mental health days was found, implying that poor mental health day increases with increasing air pollution concentrations and with decreasing altitude.
Discussion
SMART BRFSS data sets were analyzed to provide evidence to support the hypothesis that PM2.5 concentration and mean county altitude are significant predictors of mental health. Specifically, at higher concentrations of PM2.5 and lower altitudes, there are higher occurrences of MUDs. This study also controlled for potential confounders and is consistent with existing literature in finding a correlation between physical health, social and economic environment, race, gender, and mental disorders (Canadian Mental Health Association, 2008; Ahn et al., 2009; Eaton et al., 2012). This is the first study to investigate the effects of both air pollution and altitude on the regional variation in mental health. These findings suggest a need for further investigation into the mechanism in which to consider air pollution and altitude as significant factors for mental disorders. More speculatively, living at less polluted areas and higher altitudes may provide benefits for alleviating symptoms of mental disorders.
These findings are associated with previous findings from epidemiological research that implicate air pollution as a significant risk factor for suicide (Kim et al., 2015) and altitude as a protective factor for ADHD (Huber et al., 2015). There have been several studies that propose multiple mechanisms for the effect of air pollution on the central nervous system (CNS). First, air pollution can influence the immune system and induce emotional changes through effects on neurotransmitter systems (Dunn and Swiergiel, 1998; Dantzer and Kelley, 2007). Exposure to particulate matter (PM2.5) for several months increases hippocampal proinflammatory cytokines in mouse brain, and PM2.5-exposed mice displayed more depressive-like responses compared with mice exposed to filtered air (Fonken et al., 2011).
In addition, considering that the immune system could affect the development of depression (Dantzer and Kelley, 2007), the reported effects of particulate matter on cytokines may be related to our findings on mental health. Second, air pollutants could affect the metabolism of serotonin, one of the neurotransmitters associated with mental disorders such as depression, obsessive–compulsive disorder, and anxiety (Gonzalez-Pina and Paz, 1997). Third, stress hormones could be associated with air pollution and mental disorders. According to Thomson et al. (2013), long-term exposure of rats to particulate matter results in activation of the hypothalamo–pituitary–adrenal (HPA) axis, which is relevant to pathology in mood disorder (Odermatt and Gumy, 2008). Further studies with individual risks of mental disorders such as psychiatric disease could be helpful to clarify this hypothesis.
Altitude is also another environmental factor that may contribute to the regional variation in mental health. However, we need to interpret the significance of the factor with caution. Formerly, others have proposed that the relationship between suicide rates and high elevation may originate from biologic elements associated with the effects of hypoxia. These prior studies have shown the connections between brief exposure to the effects of high altitude in a hypobaric chamber and the results of neuropsychological testing (Gerard et al., 2000; Nicolas et al., 2000). However, it is uncertain that these previous studies can be generalized to those residing at high elevations in different parts of the world, and none of them showed clinically significant depressions or mood changes (Betz et al., 2011). Several risk factors for depression have been recognized, including female (gender), white (race), poverty, unemployment, and social isolation (Galea et al., 2005; Frideli, 2009; Ngui et al., 2010; Umberson and Montez, 2010; Betz et al., 2011).
A number of sociodemographic and cultural factors are related with depression, so any relationship between high altitude and depression must be considered speculative (Ishikawa et al., 2016). For instance, Betz et al. (2011) found that victims living at high elevation varied significantly from those living at low elevation in regard to various sociodemographic and mental health-related variables, including race, ethnicity, history of alcohol and substance abuse, or interpersonal problem. Even after multivariate adjustment, there were still several differences in personal and mental health-related variables between different altitude groups (Betz et al., 2011).
Another possible explanation for the low MUDs at high altitudes is that the social or cultural backgrounds of these populations may prevent the development of depression (Ishikawa et al., 2016). Social support and social interaction are also known to be higher in provincial regions, with denser networks that are often kin based and related with religious institutions (e.g., Utah) (Ishikawa et al., 2016). Ishikawa et al. (2016) observed that depressive elderly received care from their family, as well as from the entire community. High-altitude residents in the Himalayan regions have exceptionally solid family ties, and a solid interpersonal relationship may suppress the development of depression. It has often been considered that cultural backgrounds and ethnicity affect the relationship between depressive symptoms and the way that depressive behaviors are expressed (Blazer et al., 1998; Ishikawa et al., 2016).
Also, it is important to discuss the implications of air pollution and altitude findings in regard to clinical significance for MUDs. Skarupski et al. (2011) evaluated the relationship between MUDs and depressive symptoms among older adults over time. Results indicated that 14% of participants had four or more depressive symptoms at baseline; of these, only 52% reported one or more MUDs. Thirty-eight percent of those with one or more MUDs had four or more depressive symptoms. The authors suggested a significant association of MUDs with having more depressive symptoms over time. In addition, previous studies have shown factors associated with depression to include culture, gender, race, socioeconomic status, geographic locale, health equity, and social relationship (Galea et al., 2005; Frideli, 2009; Ngui et al., 2010; Umberson and Montez, 2010; Ishikawa et al., 2016).
Several of these confounding variables were tested, and these variables were found to be significant factors associated with depression. For example, for the positive relationship between MUD and mental health providers, when people are treated for depression, they may interact with more than one healthcare provider, who work together to ensure their patients get the best care. Thus, the rate of mental health providers is likely to be higher in counties where more people suffer from depressive symptoms. Moreover, for the relationship between MUD and preventable hospital rate, a recent study found that individuals with depression are more than twice as likely to have hospitalizations that might be preventable with timely outpatient medical care in the community (Davydow et al., 2015).
There are several limitations regarding the association between air pollution, altitude, and mental health. First, the data were based on county-level data, leading to the potential heterogeneity in air pollution concentrations and altitude within counties. All the analyses using the data were limited by the threat of ecological fallacies; that is, we used only aggregated data at the county level, without accounting for individual-based factors (Betz et al., 2011). Thus, it would be important to use person-level data or data from outside the United States to confirm these associations for future studies. Second, comparing the annual mean county air quality and annual mean county MUDs could miss important short-term fluctuations in air quality, MUDs, and local patterns. Finally, while BRFSS questions were based on the measure of health-related quality of life, there are limitations related with the accuracy of the individual report without verification.
In summary, this study has highlighted the strength of associations between MUDs and physical environmental factors varied among regions. The overall analysis of SMART BRFSS data sets revealed a strong association of MUD with particulate matter pollution, as well as a highly significant association with altitude. The symptoms of mental disorders may be exacerbated by increases in hippocampal proinflammatory cytokines in the brain that are known to be related to air pollution exposure. These observations may have treatment implications to guide mental health interventions to prevent the development of depression. Also, this study provides important information showing that the issues of MUDs and psychiatric issues at altitude are very complex. There are many individual factors of people who are depressed at higher altitudes, which differ significantly from those with similar symptoms at low altitudes with respect to sociodemographic, cultural, and mental health-related characteristics. These factors are likely more plausible than hypoxia to explain MUDs. Future studies to explain multiple mechanisms that are affected by air pollution and altitude for individuals with mental disorders should be investigated.
Footnotes
Acknowledgments
The author thanks the anonymous reviewers for their comments and suggestions to improve the article and is grateful for the constructive suggestions made by the reviewers. The contents of this publication are solely the responsibility of the author and do not necessarily represent CDC official views. Also, the author acknowledges BRFSS, CDC WONDER, and USGS for providing data on the MUDs, air pollution, and altitude. MUD data used in this article from BRFSS are available at www.cdc.gov/brfss (data accessed May 15, 2015), altitude data are available at http://nationalmap.gov/elevation.html (data accessed May 16, 2015), and PM2.5 data are available at ![]() (data accessed May 20, 2015).
(data accessed May 20, 2015).
Author Disclosure Statement
No competing financial interests exist.