
Abstract
Abstract
Sutherland, Angus, Joseph Freer, Laura Evans, Alberto Dolci, Matteo Crotti, and Jamie Hugo Macdonald. MEDEX 2015: Heart rate variability predicts development of acute mountain sickness. High Alt Med Biol. 18: 199–208, 2017.
Aims:
Acute mountain sickness (AMS) develops when the body fails to acclimatize to atmospheric changes at altitude. Preascent prediction of susceptibility to AMS would be a useful tool to prevent subsequent harm. Changes to peripheral oxygen saturation (SpO2) on hypoxic exposure have previously been shown to be of poor predictive value. Heart rate variability (HRV) has shown promise in the early prediction of AMS, but its use pre-expedition has not previously been investigated. We aimed to determine whether pre- and intraexpedition HRV assessment could predict susceptibility to AMS at high altitude with better diagnostic accuracy than SpO2.
Methods:
Forty-four healthy volunteers undertook an expedition in the Nepali Himalaya to >5000 m. SpO2 and HRV parameters were recorded at rest in normoxia and in a normobaric hypoxic chamber before the expedition. On the expedition HRV parameters and SpO2 were collected again at 3841 m. A daily Lake Louise Score was obtained to assess AMS symptomology.
Results:
Low frequency/high frequency (LF/HF) ratio in normoxia (cutpoint ≤2.28 a.u.) and LF following 15 minutes of exposure to normobaric hypoxia had moderate (area under the curve ≥0.8) diagnostic accuracy. LF/HF ratio in normoxia had the highest sensitivity (85%) and specificity (88%) for predicting AMS on subsequent ascent to altitude. In contrast, pre-expedition SpO2 measurements had poor (area under the curve <0.7) diagnostic accuracy and inferior sensitivity and specificity.
Conclusions:
Pre-ascent measurement of HRV in normoxia was found to be of better diagnostic accuracy for AMS prediction than all measures of HRV in hypoxia, and better than peripheral oxygen saturation monitoring.
Introduction
A
The exact mechanism causing AMS is unknown, but it is thought to be related to neurohumoral or hemodynamic processes within the central nervous system (Hackett, 1999). Reduced arterial oxygen saturation is presumably the ultimate upstream cause and is known to be associated with increased reporting of AMS symptoms (Oliver et al., 2012). Nevertheless, participants with similar peripheral oxygen saturation (SpO2) may or may not present with AMS (Luks and Swenson, 2011). As SpO2 decreases during ascent to high altitude, heart rate increases, presumably as a result of increased sympathetic activity and to maintain oxygen delivery (Brierley et al., 2012). Although the role of the autonomic nervous system in AMS is poorly understood, it is conceivable that autonomic dysregulation could play an important role in its genesis (Duplain et al., 1999).
Despite the mechanism of AMS remaining elusive, many authors have attempted to develop tools to predict AMS susceptibility. The most commonly investigated tool remains SpO2 monitoring (Burtscher et al., 2008). Unfortunately, such predictive tools have not shown high diagnostic accuracy and therefore have not been widely accepted (Burtscher et al., 2008; Luks and Swenson, 2011). Therefore, alternative or additional measures to improve AMS prediction are of interest. In this regard, Burtscher et al. (2008) demonstrated a small improvement in AMS prediction when combing SpO2 monitoring with the blood lactate response to hypoxia, but this invasive approach requires technical skills and is time-consuming. If autonomic dysregulation in response to hypoxia has a role in the genesis of AMS, then measures of peripheral autonomic activity such as heart rate variability (HRV) may provide an alternative additional predictive tool.
HRV is the beat-to-beat variation in R-R intervals in an electrocardiogram and it has been suggested that it can be used to monitor the activity of the autonomic nervous system (Billman, 2011). The R-R interval data are analyzed and the power of HRV is quantified by determining the areas of the spectrum in different component widths: high frequency (HF; 0.15–0.4 Hz), low frequency (LF; 0.04–0.15 Hz), very LF (VLF; ≤0.04 Hz), and ultra-LF (ULF; ≤0.0033 Hz) (Task Force of the European Society of Cardiology and the North American Society of Pacing and Electrophysiology, 1996; Camm et al., 1996).
HF is widely accepted as an indicator of vagal tone. It is currently considered a good estimator of parasympathetic activation of the autonomic nervous system because the sympathetic nervous system accounts for only 10% of HF variability (Malliani et al., 1991; Billman, 2013). In contrast, it has been suggested that sympathetic and parasympathetic nervous system activation explains roughly 50% and 25% of the LF variability, respectively (De Vito et al., 2002; Shaffer et al., 2014). In addition, LF currently is not considered a valid marker of autonomic nervous activity per se as it is influenced by the activity of baroreceptors in addition to those of the autonomic nervous system (De Vito et al., 2002; Rahman et al., 2011; Billman, 2013). A ratio of LF/HF has also been widely used as an indicator of sympathovagal balance. Taking into account what is known about LF, the LF/HF ratio may be more usefully described as a mutual relationship between baroreflex sensitivity and parasympathetic modulation (Cohen and Taylor, 2002; Rahman et al., 2011; Billman, 2013). Finally, a physiological explanation and the mechanism involved in the generation of VLF and ULF have not been clarified. Nevertheless, some authors suggest that circadian rhythms, core body temperature, metabolism, hormones, and intrinsic rhythms generated by the heart could be the cause of VLF and ULF fluctuations (Shaffer et al., 2014).
In clinical settings, HRV has been shown to be useful in postmyocardial infarction risk stratification and in prediction of anxiety disorders (La Rovere et al., 1998; Chalmers et al., 2014). At altitude, a number of studies have investigated the dysregulation of the autonomic nervous system using HRV. These studies have shown a transient reduction in parasympathetic and increased sympathetic activity during acute exposure to hypobaric hypoxia (Kanai et al., 2001). However, there are few studies linking these alterations in the autonomic nervous system with AMS symptoms. Karinen et al. (2012) investigated the potential predictive value of HRV assessed during the actual ascent in determining later AMS susceptibility, showing good sensitivity and specificity in diagnosing AMS, but if HRV is to become a useful applied tool in the prediction and management of AMS, its utility in assessment before expedition to altitude should be investigated. In this regard, Zhang et al. (2014) explored the response of the autonomic system when exposed to short-term normobaric hypoxia and showed that even on acute short-term exposure, a decrease in HRV is seen. Taken together, the query remains of the possible predictive valve of HRV in normobaric hypoxia to predict the development of AMS symptoms on a subsequent expedition to altitude. Advances in heart rate telemetry monitoring systems have made it possible to evaluate HRV noninvasively and in a real-time manner. So, if successful, HRV may offer a low-cost noninvasive tool to help identify those who are at risk of AMS before ascent (Burtscher et al., 2004).
The aim of this study was to determine whether HRV assessment before (acute normobaric normoxia or hypoxia) and during (chronic hypobaric hypoxia) an expedition could predict susceptibility to AMS at high altitude with similar or better diagnostic accuracy to peripheral oxygen desaturation during acute normobaric hypoxia or chronic hypobaric hypoxia. We hypothesized that LF, HF, and their ratio assessed during 15 minutes of normobaric hypoxia (FiO2 = 11.5%) would have acceptable and the best diagnostic accuracy to predict AMS susceptibility (defined as a Lake Louise Score of headache ≥1 and total score ≥3) during a subsequent trek to high altitude.
Methods
Participants
The study group consisted of 44 healthy participants (age range 24–62 years; 26 males). Participant demographics are provided in Table 1. Participants' maximum living altitude was 450 m and none of the participants had been above 3000 m during the month before the expedition. None of the participants were taking prophylactic medications for AMS, and none were taking medication known to increase HRV (beta-adrenoreceptor antagonists, statins, and angiotensin-converting enzyme inhibitors; Bilchick and Berger 2006). All participants gave written informed consent to participate and the study was approved by the National Institute for Social Care and Health Research Wales Research Ethics Service (14/WA/1260).
AMS, acute mountain sickness.
Study design
Baseline data were collected in the laboratories of Bangor University, North Wales (65 m above sea level). One month later, participants completed an expedition that trekked on foot to a field laboratory at 3841 m and on to a maximum altitude of 5085 m (Manaslu circuit in the Nepali Himalaya). Participants were divided into five groups in which ascent profiles were essentially similar (Fig. 1).

Ascent profile for all groups.
Baseline data collection
To reduce variability in HRV measures, participants were required to avoid drinking caffeine, alcohol, or smoking for at least 12 hours and to avoid eating and drinking for at least 1 hour before the measurements. Participants presented at the laboratory and were fitted with a commercially available heart rate monitor capable of obtaining HRV data (RS800CX; Polar Electro, Warwick, United Kingdom) and a peripheral oxygen saturation monitor (Onyx II 9550; Nonin, Minnesota). Participants first lay supine in normoxia for 15 minutes with their eyes open and were asked to breathe normally and regularly. Paced breathing was not required of participants because it was deemed impractical for clinical settings and is not required to obtain reliable HRV data (Kobayashi, 2009; Kox et al., 2011). HRV data were collected for the last 5 minutes as previously recommended (Camm et al., 1996) and SpO2 was obtained in the final 30 seconds. Participants were then taken into a hypoxic chamber set at FiO2 of 11.5% (equivalent to ∼5000 m) for 15 minutes where the protocol above was repeated.
Data collection during ascent
Under the supervision of each trekking group's research lead, participants kept a daily diary of various parameters, including self-reported AMS symptoms by Lake Louise Score and SpO2 by fingertip pulse oximetry (as above). The same time of day, setting (for control of background ambient light), and finger were used each day for the measurement of SpO2 and each participant had a partner who obtained readings to ensure participants remained blinded to their results. Participants had warm hands and obtained measures following overnight fast (Luks and Swenson, 2011). Preceding the overnight fast (∼8 hours), normal habitual caffeine intake was allowed.
In addition, at 3841 m, the HRV and SpO2 were again obtained using the same data collection methods as at baseline, but while breathing ambient air only.
Data analysis
Data processing was performed by Polar Precision Performance software (version 3.02.007) and Kubios software (version 2.2) (Tarvainen et al., 2013). An initial examination of the HRV data excluded participants from analyses if their data were not considered physiologically plausible or if the tachogram presented evident artifacts exceeding 5% of the total R-R intervals (Dos Santosa et al., 2013) (Fig. 2). A low-level correction was then applied if the R-R Interval was lower than 0.35 seconds (refractory time) or R-R intervals that differed more than 20% from the preceding data point were detected. If the low-level correction detected more than 5% artifact in the HRV recording, then the tachogram was also excluded from analyses (Lippman et al., 1994; Wessel et al., 2000; Dos Santos et al., 2013; Liu et al., 2013).
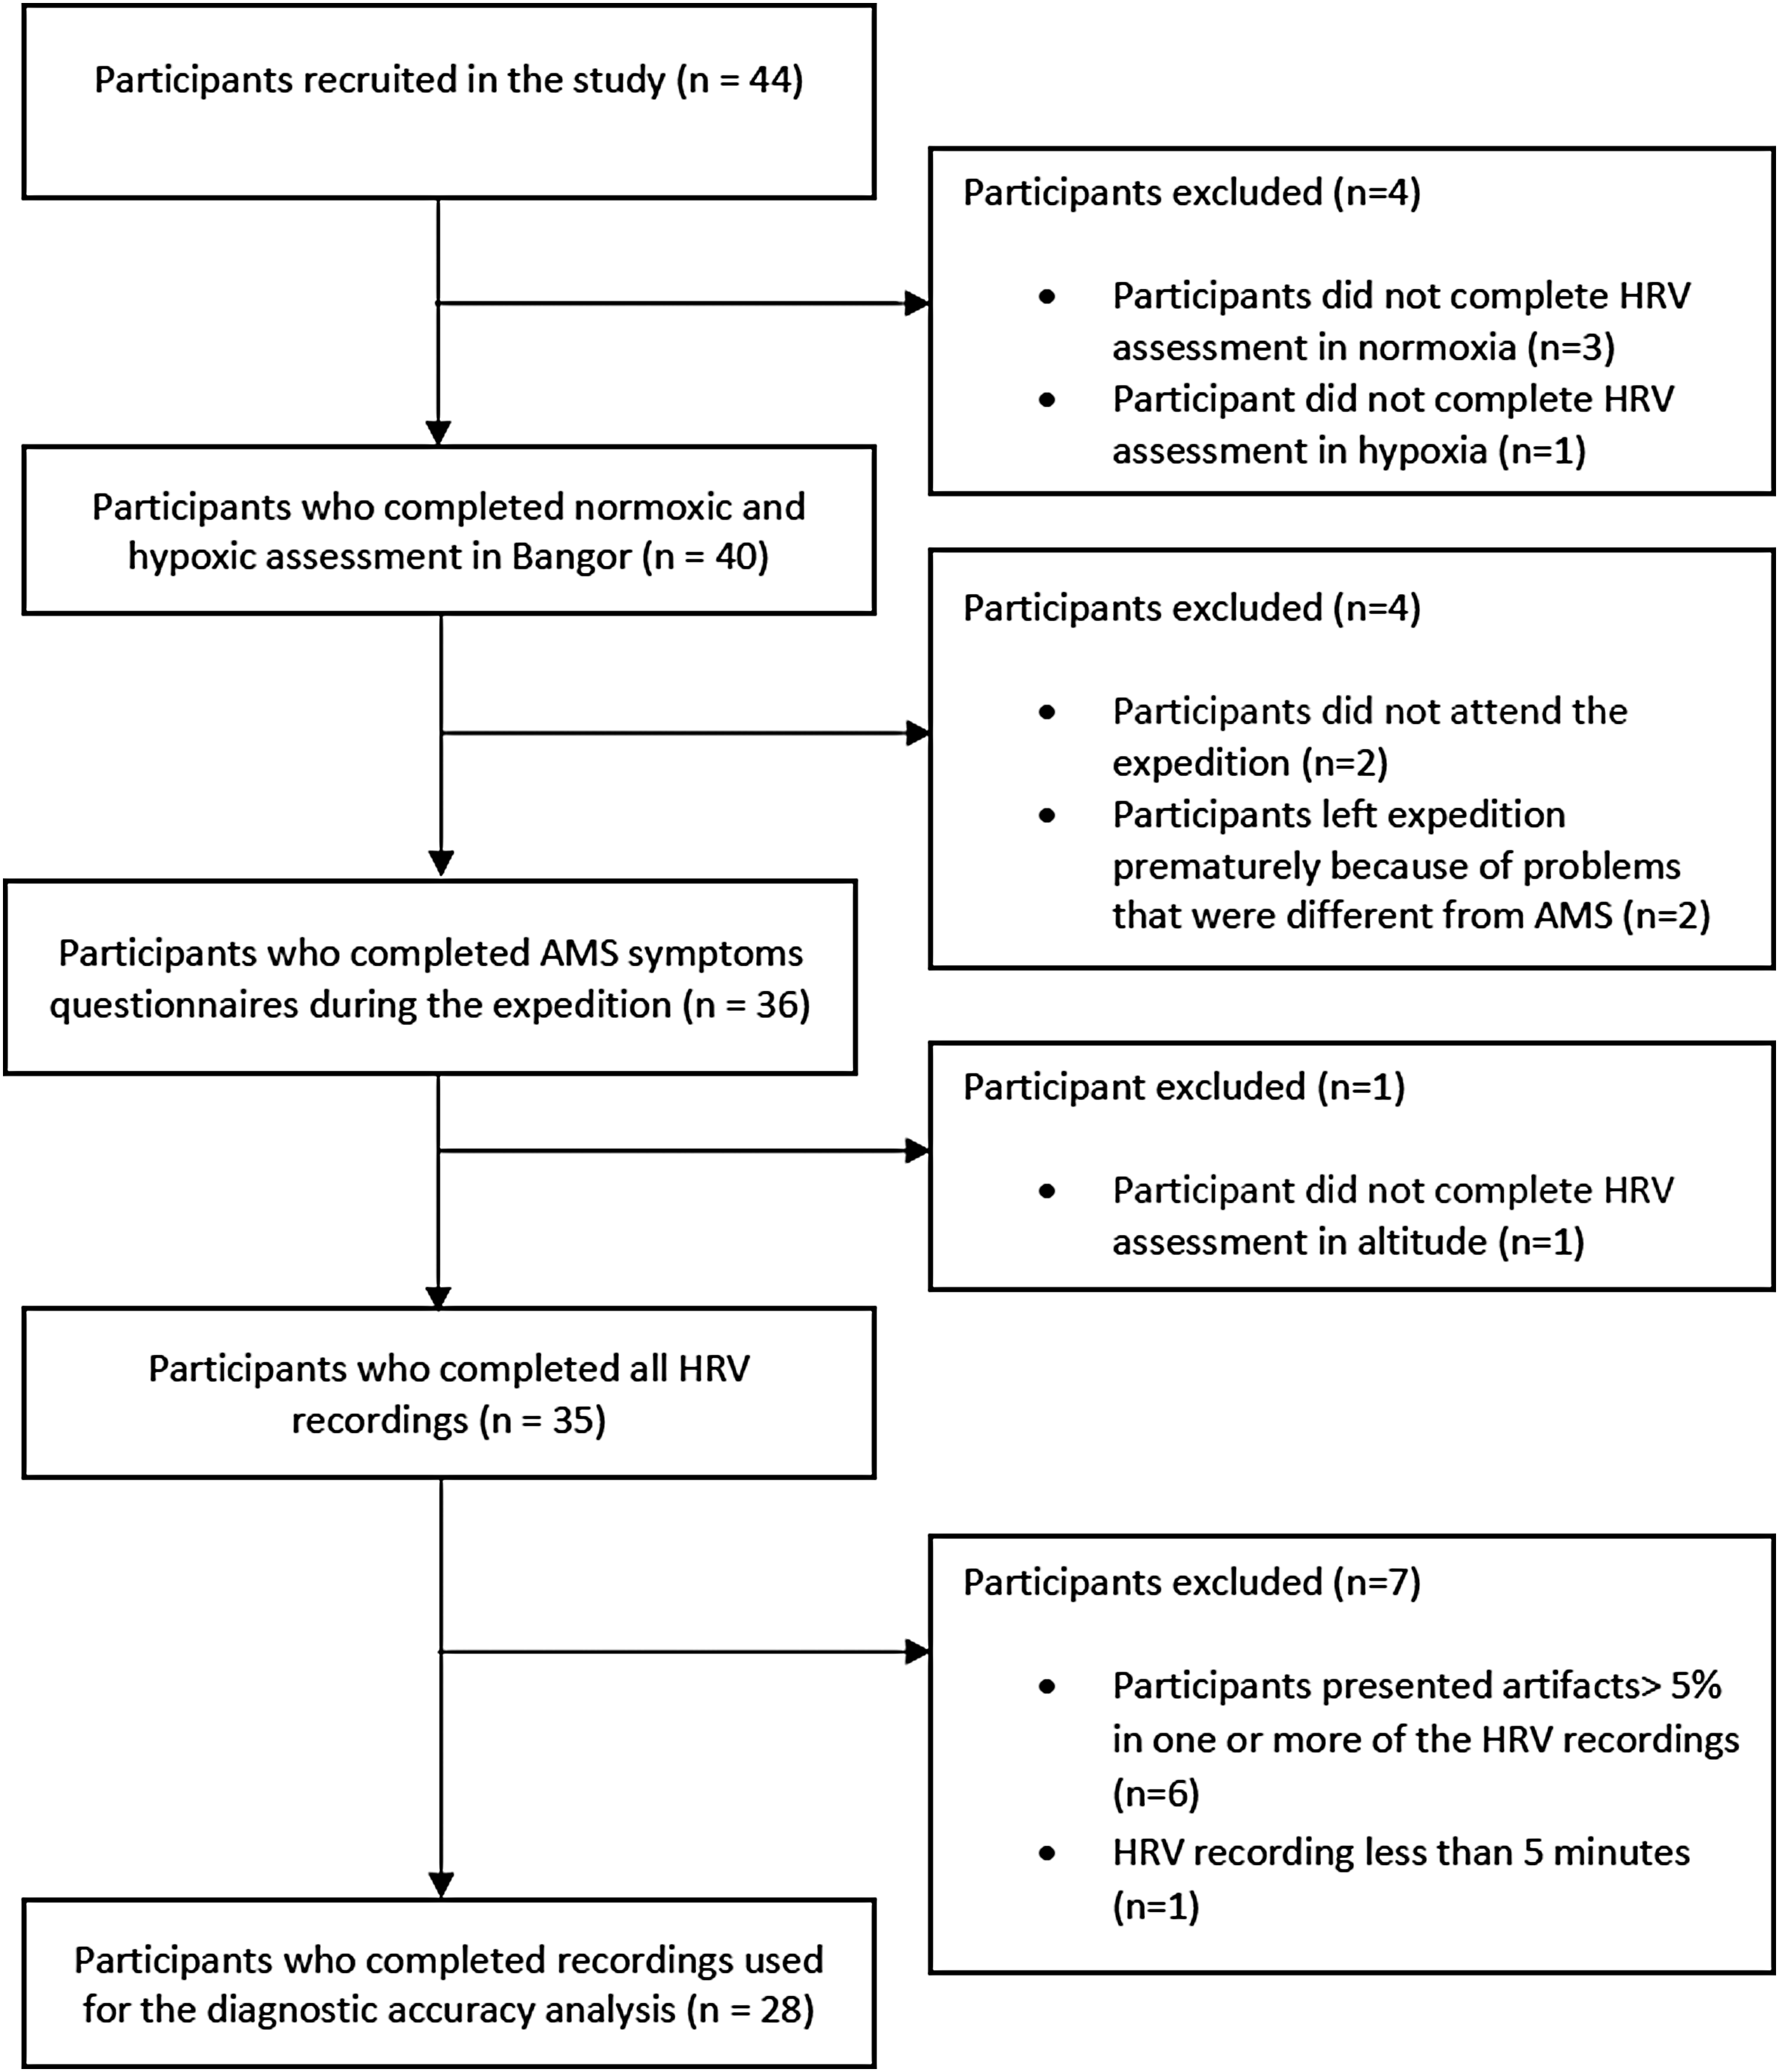
Participant flow through the study.
The power spectra were quantified by measuring the area in two frequency bands over a 5-minute epoch. The LF power was calculated for frequency band 0.04–0.15 Hz and the HF power for frequency band 0.15–0.40 Hz. The ratio of LF power to HF power (LF/HF) was also determined.
SpO2 data were expressed as the drop in SpO2 (%) following exposure to hypoxia. AMS was diagnosed when participants were above 2500 m and had presence of headache and at least one other symptom by Lake Louise Score. These participants were classified as AMS susceptible. Participants not meeting these criteria were classified as AMS resistant. Total symptom score was also presented.
Statistical analyses
Diagnostic accuracy analysis was performed to assess the ability of HRV and SpO2 to predict AMS susceptibility during consequent exposure to altitude. Receiver operating characteristic (ROC) curve analysis to predict AMS susceptibility was applied to the HRV data obtained in three different environmental conditions: normobaric normoxia and normobaric hypoxia (both obtained at baseline) and hypobaric hypoxia (obtained during the trekking ascent at 3841 m). Moreover, ROC curve analysis to predict AMS susceptibility was also applied to the drop in SpO2 between normoxia and normobaric hypoxia (after 15 minutes, FiO2 = 11.5%) and the drop in SpO2 between normoxia and hypobaric hypoxia (after 12 trekking days, 3841 m). All the diagnostic accuracy analyses were performed using R 3.2.5 (R Foundation, www.r-project.org). OptimalCutpoint package was installed in R and it was used to obtain the area under ROC curve (AUC), the optimal cut point, the sensitivity, the specificity, and the ROC curve plots (López-Ratón and Rodríguez-Álvarez, 2014). Epi and pROC packages were also installed in R and used to confirm the results concerning AUC generated by the OptimalCutpoint package. As results were the same, only data from the OptimalCutpoint package are presented herein. The pROC package was also used to calculate the confidence intervals (CIs) of the AUC. An AUC greater than 0.7 was considered fair and an AUC greater than 0.8 was considered moderate (Obuchowski et al., 2004); in both cases, it was required that the 95% CI was greater than 0.5 (www.r-project.org).
Results
Of the 44 participants recruited at the beginning of the study, 28 provided acceptable HRV, SpO2, and AMS data at all required time points. Therefore, only the data regarding these participants have been used for the data analysis and statistical analysis. The flow of participants through the study is shown in Figure 2. The mean HRV and SpO2 responses to various environmental conditions are shown in Table 2 and the individual responses for selected variables are shown in Figure 3.
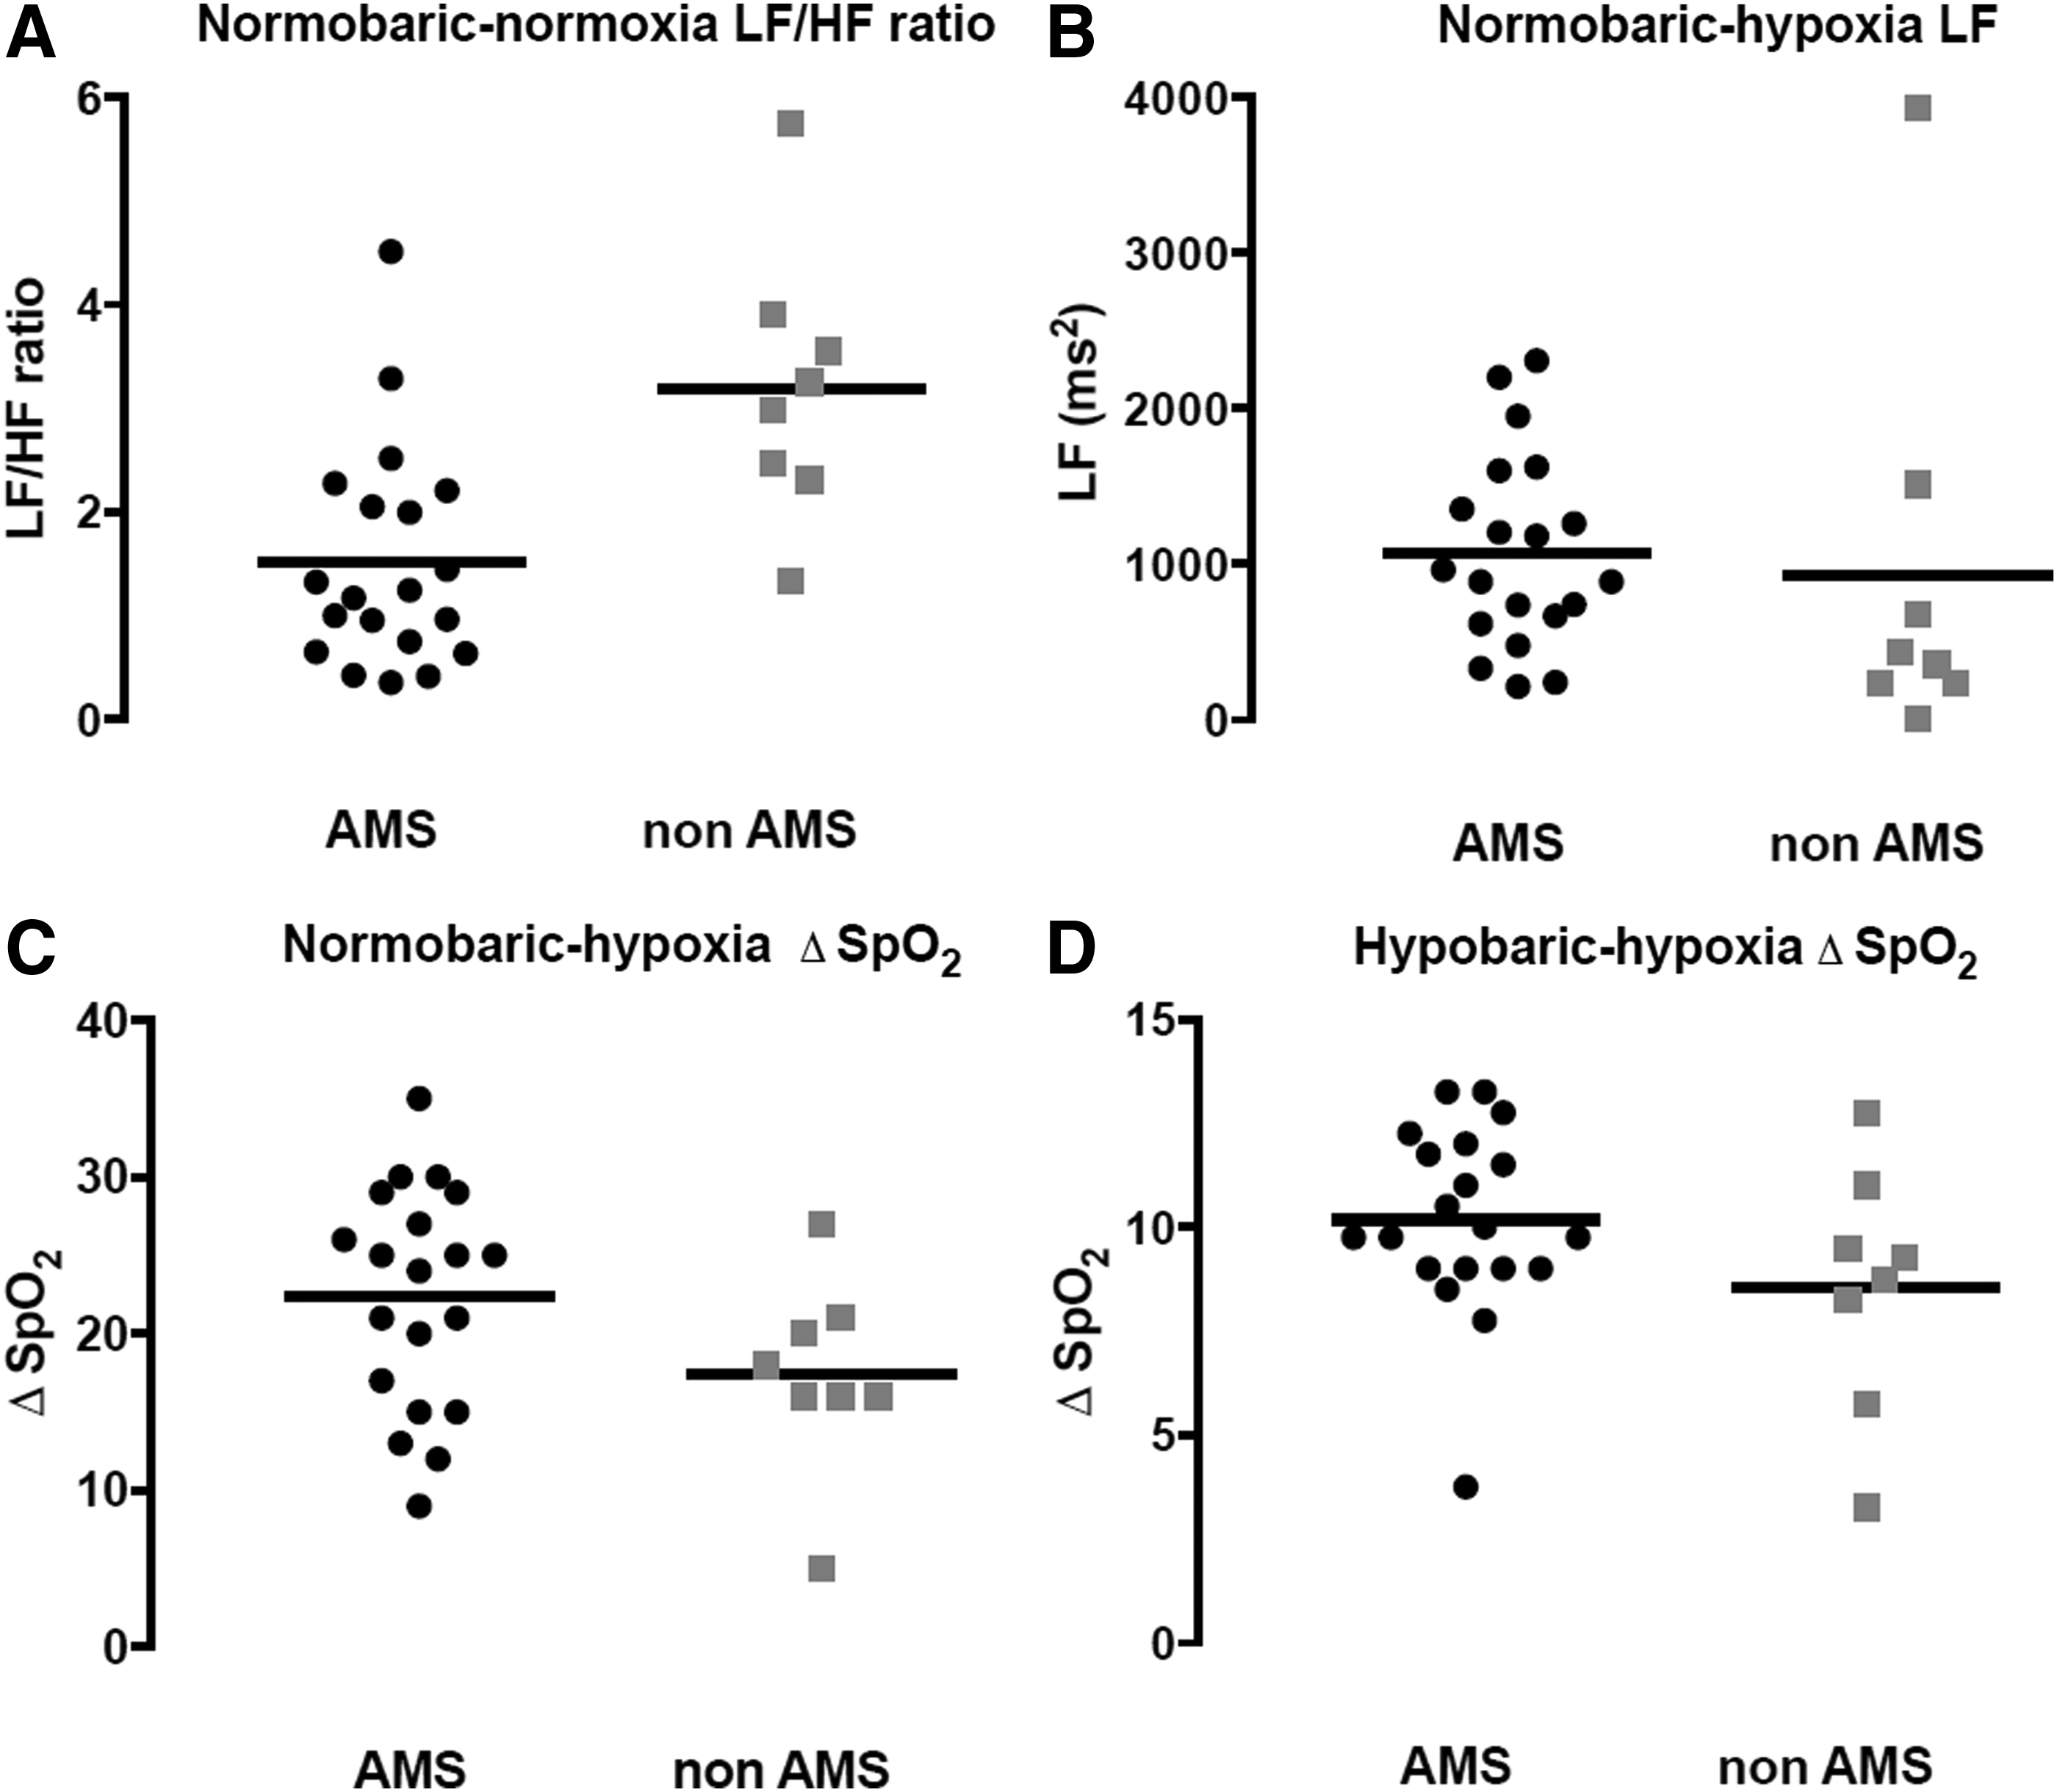
Individual responses to hypoxic exposure for selected heart rate variability and peripheral oxygen saturation variables assessed before and during a high altitude expedition.
HF, high frequency; HRV, heart rate variability; LF, low frequency; Δ SpO2, drop in peripheral oxygen saturation between normoxia and hypoxia.
During the expedition, 20 of the 28 participants showed AMS symptoms, giving an AMS incidence of 71.4%. The length of time with AMS was mean (SD) 3.85 (2.23) days. Participants who presented with clinically defined AMS reported a total accumulative symptom score of 30.3 (14.5); participants who did not present with clinically defined AMS reported a total accumulative symptom score of 12.3 (6.4).
Of the nine HRV predictor variables considered in this study, three variables presented fair diagnostic accuracy to predict AMS susceptibility (normoxia LF, chronic hypobaric hypoxia ratio, and chronic hypobaric hypoxia LF) and two presented moderate diagnostic accuracy (normoxia ratio and acute normobaric hypoxia LF) (Table 3). Of these two moderately accurate predictors, the normoxia ratio had the best diagnostic accuracy, having a higher AUC (0.88 vs. 0.80) and better sensitivity and specificity, correctly identifying 85% of true positives (AMS-susceptible participants) and 88% of true negatives (AMS-resistant participants) (Fig. 4). Notably, LF had better diagnostic accuracy than HF in all environmental conditions, having AUC values greater than 0.7 (AUCs of HF variables were all lower than 0.7). Moreover, LF showed similar or better sensitivity and specificity than HF. In contrast, SpO2 variables considered in this study showed a poor diagnostic accuracy (AUC <0.7) with poor values of sensitivity and specificity (Table 4 and Fig. 4).

Receiver operating characteristic curve for selected heart rate variability and peripheral oxygen desaturation variables assessed before a high altitude expedition to determine susceptibility to acute mountain sickness. Hypoxia LF, LF after 15-minute exposure to normobaric hypoxia; Normoxia Ratio, LF/HF ratio after 15-minute exposure to normobaric normoxia; SpO2 after 15′, drop in peripheral oxygen saturation between normoxia and normobaric hypoxia (after 15 minutes, FiO2 = 11.5%).
AUC (CI), area under receiver operating characteristic curve (95% confidence interval).
Discussion
The aim of this study was to assess the diagnostic accuracy of pre- and intraexpedition HRV and SpO2 measurements to predict AMS susceptibility at high altitude.
The study's main findings were that LF/HF ratio in normoxia and LF following 15 minutes of exposure to normobaric hypoxia are promising variables to predict AMS during subsequent altitude exposure, showing moderate diagnostic accuracy (AUC >0.8). Surprisingly, LF/HF ratio in normoxia had the best diagnostic accuracy (having the highest AUC) and the best sensitivity (85%) and specificity (88%) of all predictors. Three other variables had fair diagnostic accuracy (AUC >0.7) to predict AMS susceptibility: normoxia LF, chronic hypobaric hypoxia ratio, and chronic hypobaric hypoxia LF. Generally, LF band HRV had better diagnostic accuracy than HF bands. In contrast, fall in SpO2 following 15 minutes of exposure to normobaric hypoxia or following 12 days of exposure to hypobaric hypoxia had poor diagnostic accuracy (AUC <0.7).
We further found that at rest in normobaric normoxia, the mean LF/HF ratio was higher in the group of participants who did not subsequently develop AMS than in those who developed AMS. Despite this finding and the generally better diagnostic accuracy for this parameter compared with change in SpO2, scatterplots of individual data reveal that there is still significant overlap of data points for LF/HF ratio between the AMS and non-AMS groups (Fig. 3).
Heart rate variability
The relationship between hypoxia and HRV is complex and thus it is unsurprising that there are inconsistent results in the literature (Loeppky et al., 2003; Lanfranchi et al., 2005; Chen et al., 2008; Huang et al., 2010; Koehle et al., 2010; Karinen et al., 2012; Wille et al., 2012; Mairer et al., 2013). Generally, hypoxia is thought to potently stimulate the sympathetic nervous system, causing a reduction of HRV variability (LF and HF components) and an increase in the LF/HF ratio (Zhang et al., 2014). The results reported herein are consistent with this commonly observed response to hypoxia, showing a reduction in HRV upon acute exposure that was somewhat normalized with chronic exposure.
The present study extends previous findings by identifying that an LF/HF ratio of less than 2.28 a.u. in normoxia could identify AMS-susceptibility with reasonable diagnostic accuracy. The only other study to have described risks of developing AMS by using an HRV cutoff is by Huang et al. (2010), who found a sevenfold increase in the odds of developing AMS in participants with an LF/HF ratio greater than 1.3 a.u. measured at 1317 m. Although the present results do not concur with this finding, the measurements in Huang et al.'s study were taken in field conditions and were used to predict AMS at moderate altitude (3440 m). In contrast, the present data were taken pre-expedition and were used to predict AMS at a much higher altitude (5085 m). Comparisons between the present and previous studies are also difficult because of differences in data analysis. For example, to our knowledge, this is the first study to have employed strict a priori agreed exclusion criteria regarding implausible data and artifact and the first study to include a diagnostic accuracy analysis to determine performance of HRV data obtained pre-expedition to predict AMS susceptibility.
In the present study, LF/HF ratio in normoxia had the best diagnostic accuracy, while the LF band demonstrated better diagnostic accuracy than HF under all conditions. As mechanisms underlying HRV are complex, the exact physiological explanation of these findings is unclear. The traditional understanding that LF and HF components reflect sympathetic and parasympathetic activities, respectively, is now seen as overly simplistic (Scheff et al., 2014). It has recently been appreciated that other important factors in modulating HRV are mechanoreceptors and ventilatory response (Scheff et al., 2014) and that autonomic changes that affect heart rate tend to alter both LF and HF components (Chiu et al., 2003). Nevertheless, it is tempting to speculate that since LF/HF ratio and LF take into account both sympathetic and parasympathetic cardiac supply and may be related to baroreflex function, these HRV variables are better overall reflections of baroreflex activity, cardiac tone, and sympathovagal balance (De Vito et al., 2002; Shaffer et al., 2014). Hence, their performance to predict AMS susceptibility may be superior because they reflect the interaction of multiple physiological factors that cause AMS.
A surprising finding was the superior diagnostic accuracy of measurements taken in normoxia compared with hypoxia. Many studies have considered pre-expedition measurements in hypoxia to be a proxy for hypoxic conditions at true altitude, but it may be that individuals' physiological response to prolonged hypoxia, when given time to acclimatize, is different to acute hypoxic exposure. In this regard, Zhang et al. (2014) found a significant increase in cardiorespiratory phase synchronization on exposure to acute hypoxia, which was associated with a lower HRV. Thus, variable ventilatory responses to acute hypoxia may confound the measurements of HRV if also obtained in acute hypoxia.
A further problem when comparing studies is that models of the effect of altitude on the autonomic nervous system often only consider the hypoxia variable, although both temperature and barometric pressure may have an independent effect on physiology at altitude (Conkin and Wessel, 2008; Coppel et al., 2015). Moreover, AMS symptoms are less severe in normobaric hypoxia (Roach et al., 1996). Interestingly, the present finding that the best predictor for subsequent AMS is LF/HF ratio in normobaric normoxia suggests that there are physiological differences between AMS-susceptible and AMS-resistant individuals, which are observable even at sea level. The protective nature of a high HRV and a sympathovagal balance shifted to sympathetic dominance may be protective per se, or may reflect some other parameter, such as physical fitness or autonomic activity responsiveness, in particular to stressors such as hypoxia. Other sea level physiological differences have been demonstrated previously, such as gag reflex (Austin and Sleigh, 1995) and resting blood pressure (Lanfranchi et al., 2005). In support of our findings, Akselrod et al. (2001) found that individuals with higher baseline autonomic activity were more resistant to desaturation on exposure to acute hypoxia. Although a recent study by Botek et al. (2015) found no correlation between the LF/HF ratio and delta SpO2, it was not determined whether LF/HF ratio or delta SpO2 predicted subsequent AMS, so the lack of correlation may reveal the poor predictive value and the variable nature of the SpO2 response to acute hypoxia (rather than invalidating HRV measurements for field use).
Oxygen saturations
Measurement of SpO2 at rest has previously been proposed as an indicator for inadequate acclimatization (Karinen et al., 2010), with several studies finding an inverse relationship between SpO2 and AMS susceptibility (Karinen et al., 2010; Mairer et al., 2013). More severe desaturation in hypoxia in AMS-susceptible participants is probably due to differences in ventilatory response (Burtscher et al., 2004) or a ventilation/perfusion mismatch (Loeppky et al., 2008). However, measurement of SpO2 for 15 minutes in acute normobaric hypoxia and chronic hypobaric hypoxia in the present study showed poor diagnostic accuracy. Indeed, other studies have found no association (Wille et al., 2012). Although some authors have proposed that inconsistencies may be due to differences in the time of measurement (SpO2 measured after >20 minutes in hypoxia, but within the first hour, appears to have superior predictive value than later measurements (Burtscher et al., 2008; Loeppky et al., 2008)), it is an unlikely explanation in the present study because data were also taken after chronic exposure to hypobaric hypoxia and still showed poor diagnostic accuracy. It is conceivable that the peripheral oxygen saturation method may be unreliable even though the present methodology was standardized and likely to be more reliable than if used outside of the research setting.
Strengths and limitations of the study
The rate of ascent and previous acclimatization can affect the likelihood of developing AMS (Bartsch and Saltin, 2008). The ascent profiles for all participant groups were similar and all participants climbed the same route (Fig. 1). None of the participants had been to altitude within the month preceding the expedition. All data were collected at the same time after reaching a given altitude with control of variables such as caffeine, smoking, and eating before collection of HRV data. We also gave advice to ensure that participants stayed well hydrated during the expedition. Thus, many of the variables that can influence AMS and HRV were well controlled (enhancing internal validity). We note that uncontrolled variables such as age and sex can influence HRV; however, the outcome measure of AMS was obtained in the field in a group of heterogeneous participants representative of typical high altitude sojourners (enhancing external validity). We have also provided detailed explanation of the criterion used to exclude HRV data due to artifact or physiologically implausible data. Combined with the use of diagnostic accuracy statistics and individual data plots, the study thus allows a meaningful interpretation of the utility of HRV at different time points (before or during the expedition) to predict AMS.
A major concern regarding the use of HRV to predict AMS susceptibility is that of 35 complete data sets, 6 participants' data had to be excluded due to artifacts or implausible data (Fig. 2), despite controls such as lying still and not talking. Thus, until the data collection equipment is improved or simplified, there will be participants for whom prediction of AMS susceptibility is currently not possible. It is also possible that HRV simply reflects some other unidentified predictor of AMS (but exploratory analyses of other independent variables could not identify any such predictor).
Finally, it is well known that respiratory rate affects HRV and peripheral oxygen saturations. Bilman (2011) discussed the effect of respiratory parameters on HRV, suggesting that both respiratory rate and tidal volume alter HRV, including both the HF and LF components. Lehrer and Gevirtz (2014) suggest that a respiratory rate between 4.5 and 7 breaths per minute improves autonomic homeostasis through HRV biofeedback. They further suggest that breathing at the rate of the cardiovascular system's resonance frequency can enhance performance. However, respiratory rate is grossly affected by altitude (Richard et al., 2014); controlling and thus changing participants' respiratory rate would not reflect their physiological state during the rest of the expedition. Furthermore, it is practical to control respiratory rate in normobaric normoxia, but it may be impossible to control respiratory rate in normobaric or hypobaric hypoxia. Instead, we told participants to lie awake and breath normally, thus avoiding periodic breathing. As for peripheral oxygen saturations, some variability in this measure will have arisen due to using only acute exposure to normobaric hypoxia. Such variability may lead to an underestimation of the diagnostic accuracy of SpO2. However, previous observations by our group suggest that this variability is considerably reduced at 15 minutes compared with initial exposure. Thus, for both HRV and peripheral oxygen saturation, we chose to make a compromise between scientific rigor and practically implementable methods that would most likely be adopted in the field.
Implications for practice
In the present study, an accurate predictor for AMS susceptibility was identified using a simple tool implementable at sea level. This is important because for a diagnostic tool for AMS to be clinically useful, results must be available in time to make adjustments to prevent disease. For example, lengthening the ascent profile or taking prophylactic mediation. A recent study by Karinen et al. (2012) found root mean square differences of HRV at 2400 m had 92% sensitivity for detecting AMS if ascent continued to 3000–4300 m without acclimatization. However, the need for a field laboratory and technicians at 2400 m, at which point some individuals may already be suffering from AMS (Burtscher et al., 2008) and from which altitude it may be too late to change the itinerary, makes these measurements unwieldy and unsuitable as methods of predicting disease (Song et al., 2013). Even studies finding potentially clinically useful pre-expedition predictors usually require long exposure to simulated altitude (Mairer et al., 2013), which is demanding on time, technology, and finances.
LF/HF ratio of less than 2.28 in normoxia was recognized as being the best cut point to identify individuals at risk of AMS during altitude exposure. This has interesting practical implications because it suggests that hypoxic exposure pre-expedition may not be required to predict AMS susceptibility. This finding is consistent with the results of Rossetti et al. (2016; in press), who found that normoxic VO2 max predicts altitude performance without measures of hypoxic sensitivity. Our findings also give an insight into cardiac autonomic responses in regard to AMS development and might help to clarify the question of whether HRV modulations appear as a consequence and/or cause of AMS.
Currently, however, postprocessing of the HRV data is still required, making interpretations of the results difficult without some technical knowledge. In addition, until equipment is improved, any HRV test should last at least 10 minutes to allow for removal of artifact from the recording. Modification of existing heart rate monitors should be considered, to give information to users pre-expedition on their susceptibility to AMS at true altitude, by measuring LF/HF ratio in normoxia. A simple diagnostic test incorporated into a watch has the potential to reduce AMS by allowing implementation of preventative measures, but should be used with caution to prevent participants who are predicted to be AMS resistant from ignoring general advice on AMS prevention. Finally, at present, some overlap in HRV responses between AMS-susceptible and AMS-resistant individuals exists. Therefore, further research is needed to validate our findings with an increased number of more heterogeneous participants, with varying degrees of AMS, to determine the true utility of HRV data to predict AMS.
Conclusion
This study showed that HRV has better diagnostic accuracy for AMS prediction than peripheral SpO2 saturation monitoring. These results show that the measurement with the highest diagnostic accuracy is normoxic LF/HF ratio, measured pre-expedition. Further confirmatory studies are needed to validate these measurements, but they suggest an alternative approach to obtain a more accurate simple method of predicting AMS.
Footnotes
Acknowledgments
The authors would like to thank all research participants who took part in the MEDEX 2015 expedition.
Author Disclosure Statement
No competing financial interests exist.